

Chromite ore resources characteristic and analysis of supply and demand situation from 2021 to 2035 in China
-
摘要:
研究目的 铬矿作为我国关键性矿产之一,是支撑我国战略性新兴新兴产业发展的重要矿种。我国铬矿资源匮乏,资源禀赋不佳,产量低,长期以来,铬矿石对外依存度高。研究铬矿未来供需情况,对于铬矿资源产业良性持续发展至关重要。
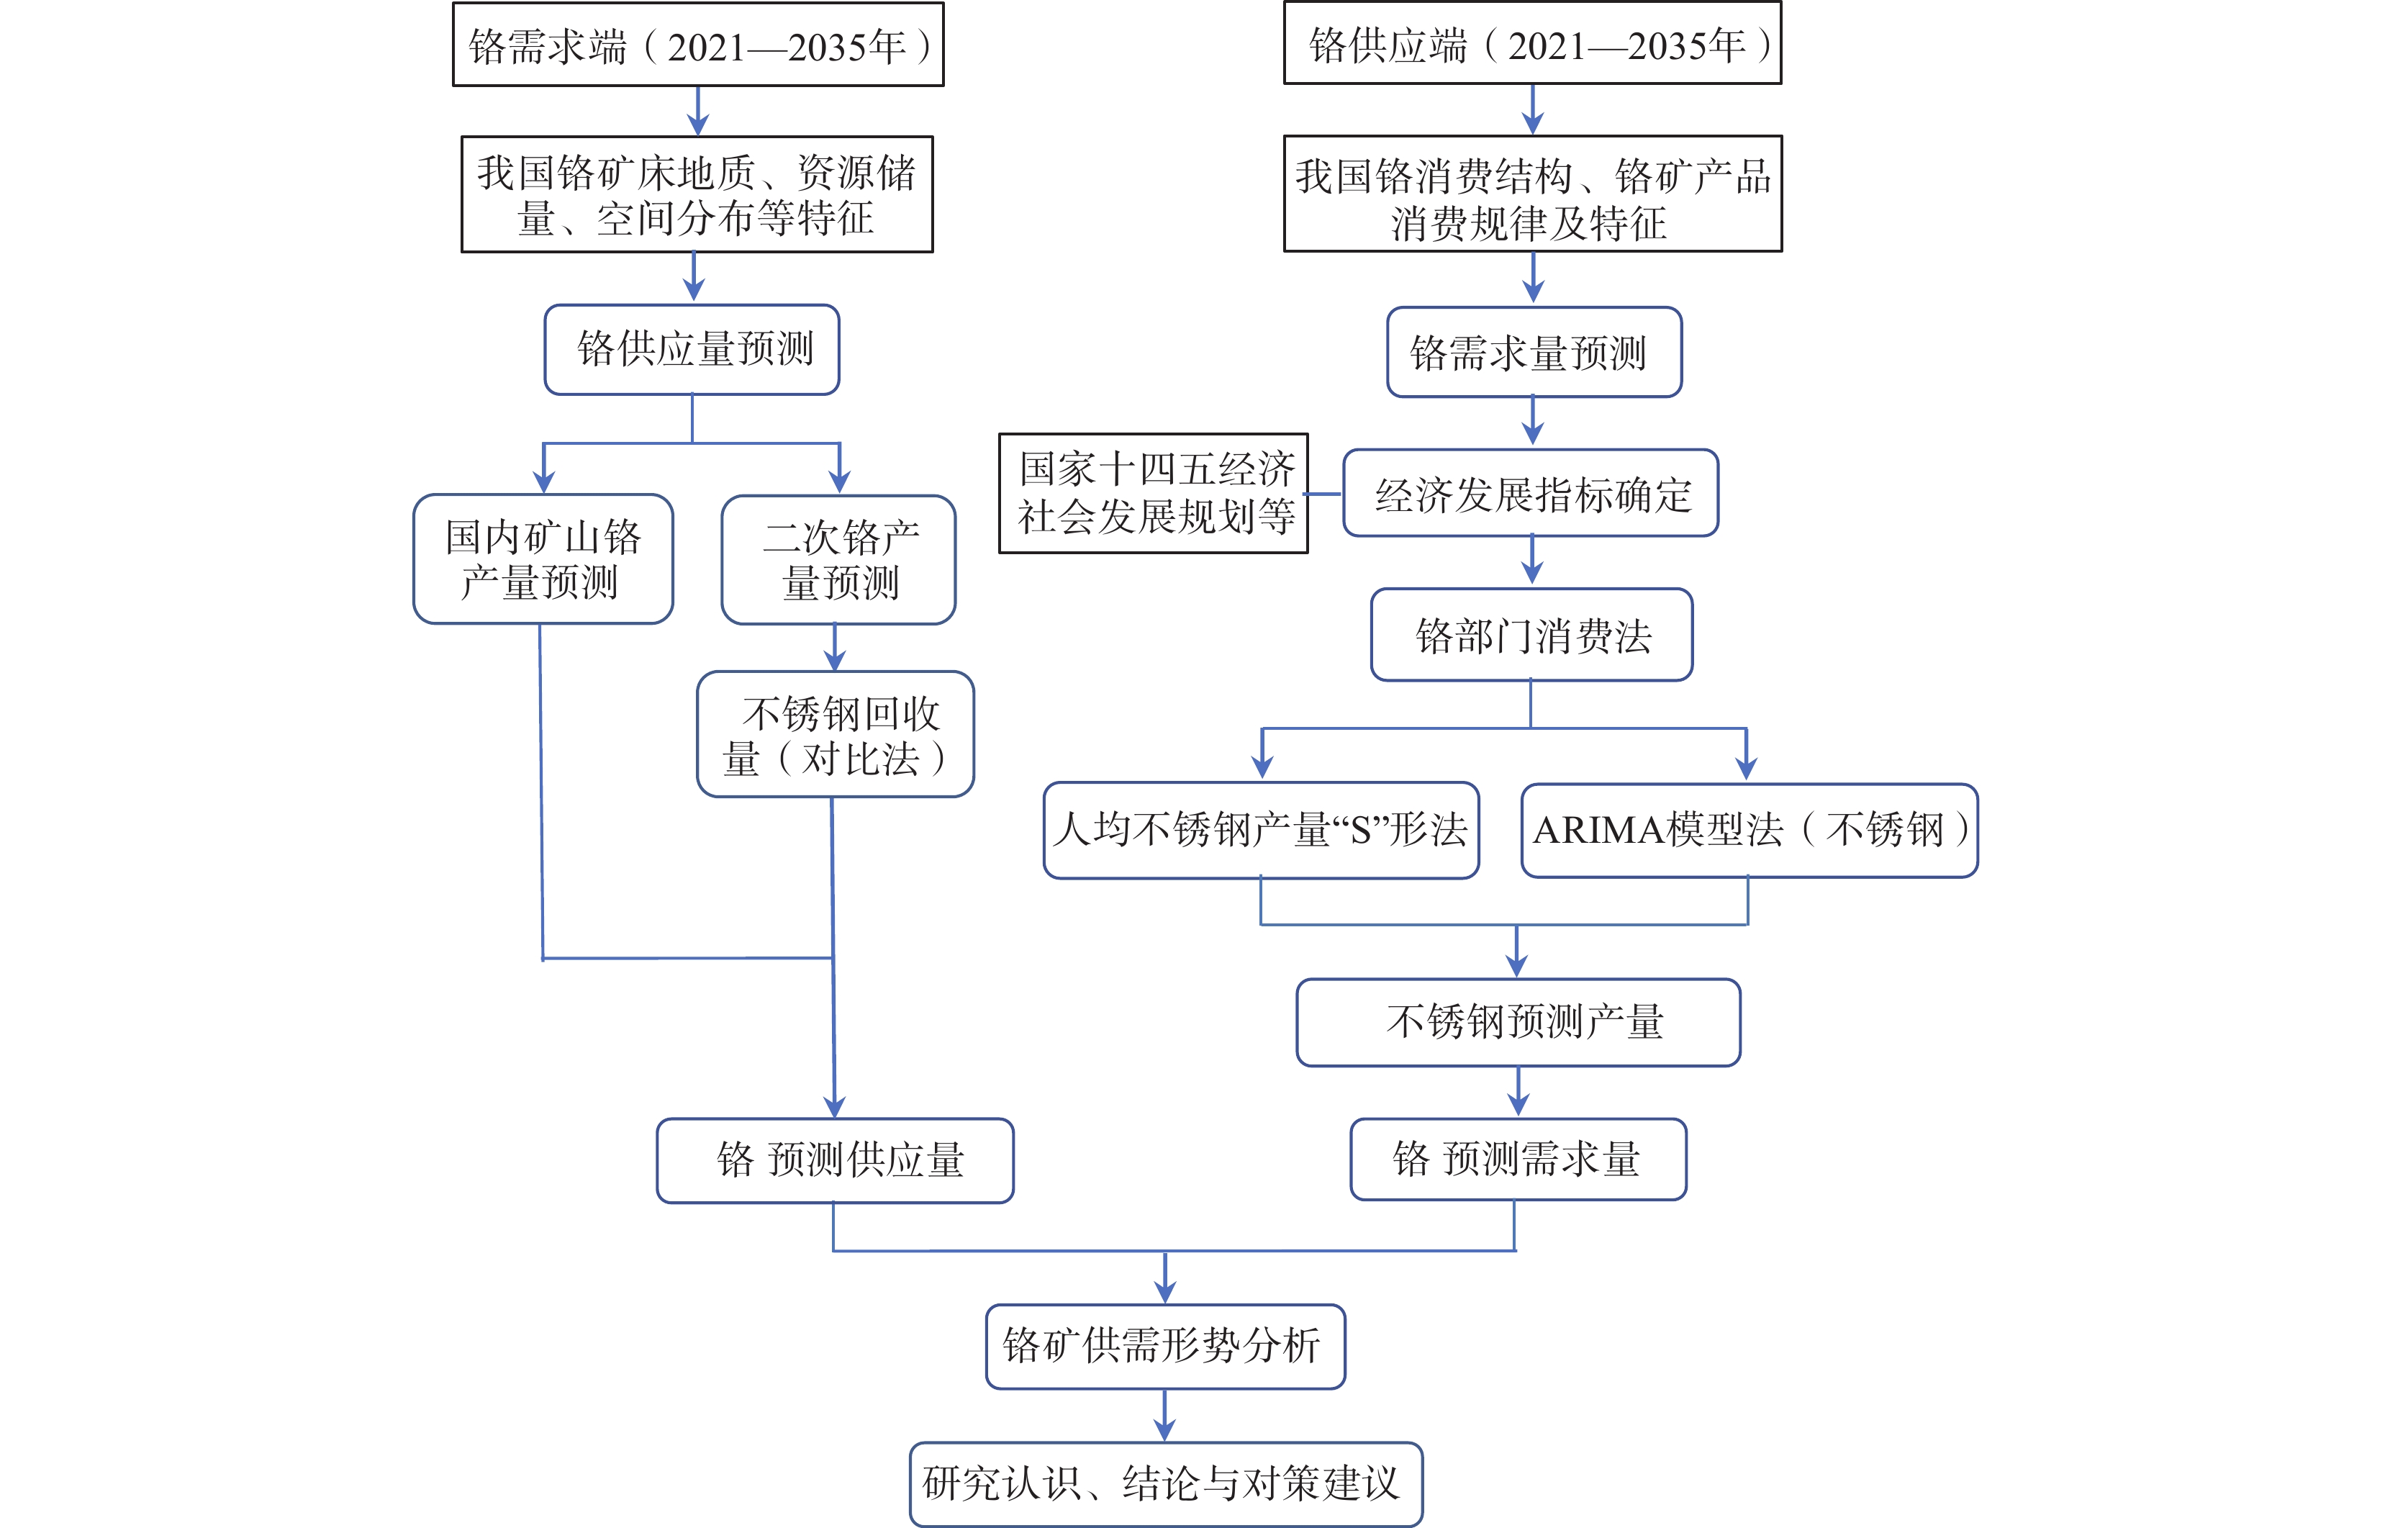
研究方法 本文对我国铬矿床地质、空间分布和资源储量等特征进行了总结,分析了我国铬矿资源开发利用的历史数据。在此基础上预测了我国铬供应量,并进一步利用铬部门消费法、人均不锈钢产量“S”形法、ARIMA模型法(不锈钢)等预测方法,分高、中、低3种情景对我国2021—2035年不锈钢产量和铬需求量进行了预测。
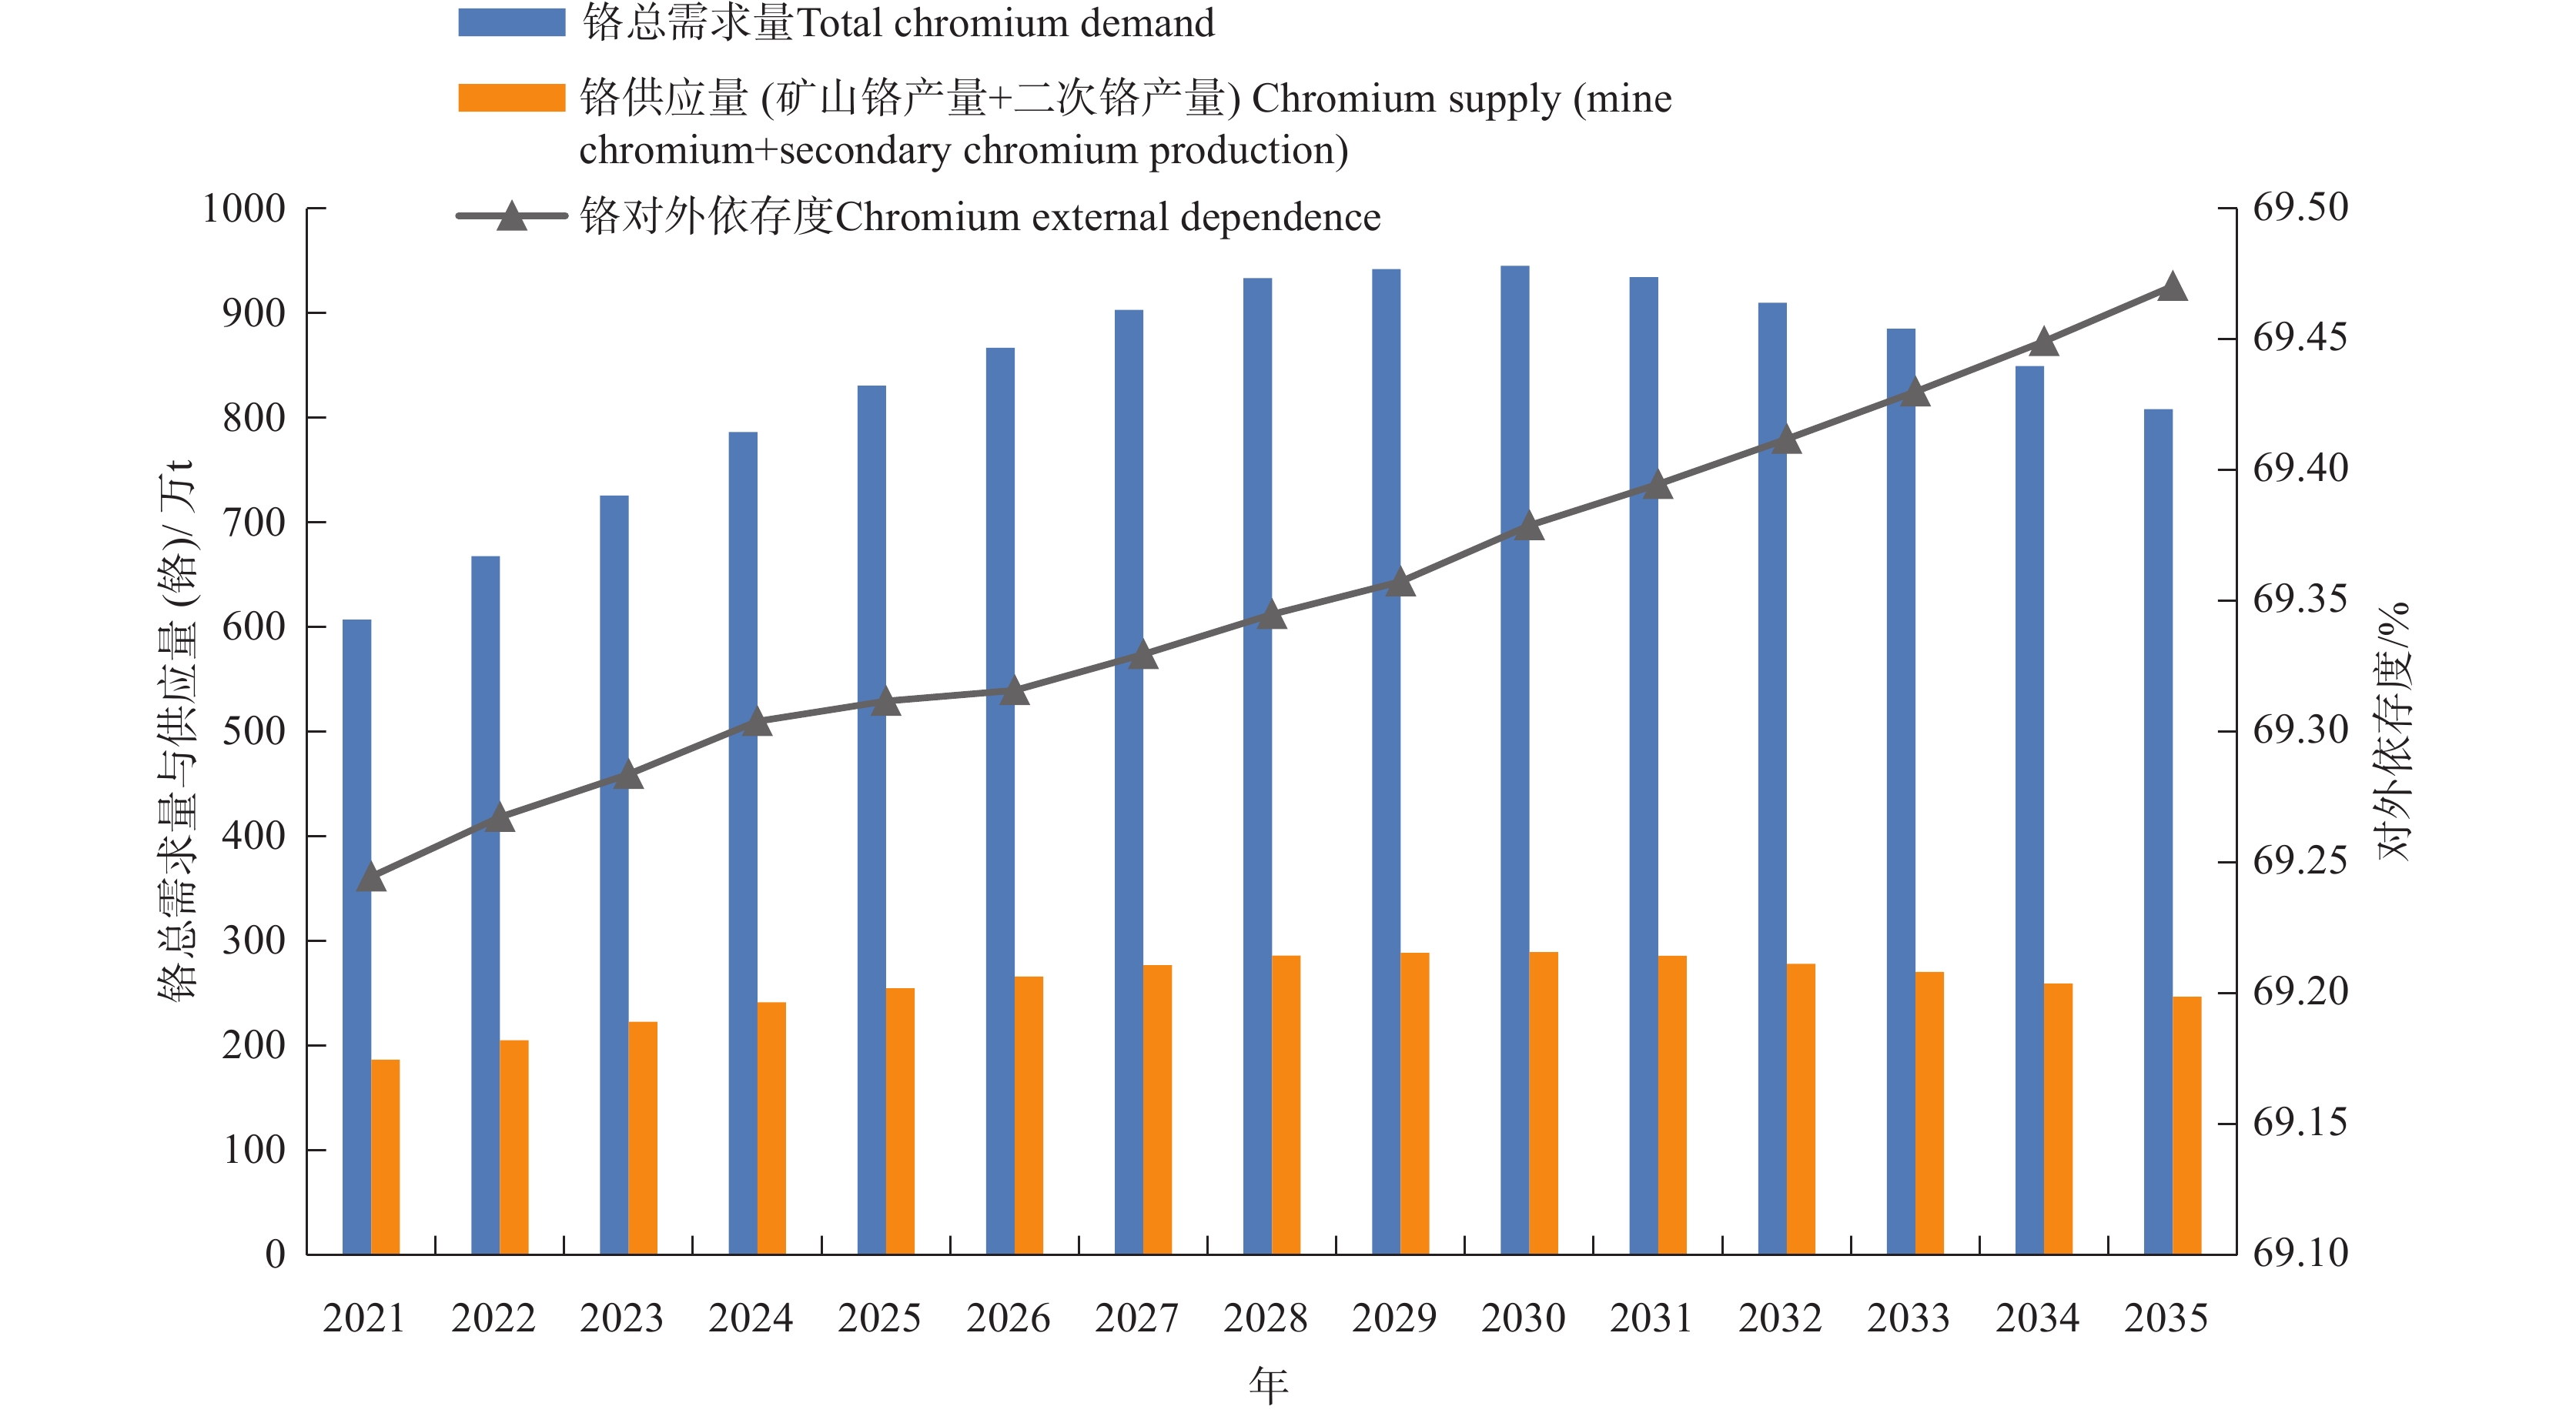
研究结果 (1)2021—2035年我国矿山铬年预测产量(矿石量)为15~20万t,二次铬预测产量(铬金属量)在182~284万t内;(2)在中情景下,2021—2035年我国铬需求量呈现先增后降的趋势,峰值点为2030年。2021—2030年我国人均不锈钢产量呈上升趋势,2030年到达峰值点,届时人均不锈钢产量35 kg,不锈钢产量5005万t,折铬总需求量945.39万t;之后逐渐下降,到2035年人均不锈钢产量降至30 kg,不锈钢产量4280万t,铬总需求量808.44万t。(3)2021—2035年,我国铬供需形势严峻,矿山铬对外依存度99%以上,若利用二次铬产量,则铬对外依存度降至69%以上。
结论 2021—2035年我国铬供需形势仍将严峻,缺口仍需大量进口矿石来补充。据此,提出加强铬矿地质勘查工作力度、力争实现铬矿找矿突破,重视二次铬回收利用、发展二次铬回收产业,加强铬矿产品储备、保障铬矿产品供应安全,优化铬矿产品结构,利用境外铬矿资源产品等对策结论。本文所形成的认识结论、对策建议对我国编制矿产资源规划、制定铬矿资源管理政策等具有一定的现实意义。
Abstract:This paper is the result of mineral exploration engineering.
Objective Chromium, as one of the critical minerals in China, supports the development of China's emerging industries. China is short of chromium ore resources, poor resource endowment and low production. For a long time, the chrome ore has been highly dependent on foreign countries. It is important for the healthy and sustainable development of chromium ore resource industry to study the future supply and demand of chrome ore.
Methods This paper summarizes the geology, spatial distribution, resource reserves and other characteristics of chromium deposits in China, and analyzes the historical data of the development and utilization of chromium resources in China. On this basis, the chromium supply in China is analyzed and predicted. And the stainless steel production and chromium demand in 2021−2035 in China are predicted under three scenarios, namely high, medium and low, by using chromium sector consumption method, S−curve of per capita stainless steel production, ARIMA model method (stainless steel) and other prediction methods.
Results (1) The production of chromium in China will be 150,000−200,000 tons, and the secondary chromium will be 1.82−2.84 million tons from 2021 to 2035; (2) Under the medium scenario, the demand for chromium in China from 2021 to 2035 is projected to follow an increasing and then decreasing trend, with the peak occurring in 2030. And, the per capita stainless steel production will keep an upward trend from 2021 to 2030, and will reach its peak in 2030. At that time, the per capita stainless steel production will be 35 kg, the stainless steel production will be 50.05 million tons, and the chromium demand will be 9.45 million production; After that, it will gradually decline. By 2035, the per capita stainless steel production will drop to 30 kg, the stainless steel production will be 42.8 million tons, and the chromium demand will be 8.07 million tons; (3) The supply and demand situation is severe in China from 2021 to 2035, and the external dependence rate of chromium will exceed 99%. If secondary chromium production is used, the external dependence rate of chromium will drop to more than 69%.
Conclusions The supply and demand situation of chromium in China will still be severe, and the gap still needs to be supplemented by a large number of imported ores from 2021−2035. On this basis, it is proposed to strengthen the geological exploration of chromium ore, strive to achieve a breakthrough in chromium ore prospecting, attach importance to the secondary chromium recovery, develop the secondary chromium recovery industry, strengthen the reserves of chromium ore products, ensure the safety of chromium ore product supply, optimize the structure of chromium ore products, and make use of overseas chromium ore resources and products. The conclusions and suggestions formed in this paper are of practical significance to the compilation of mineral resources planning and the formulation of chromium mineral resources management policies in China.
-

-
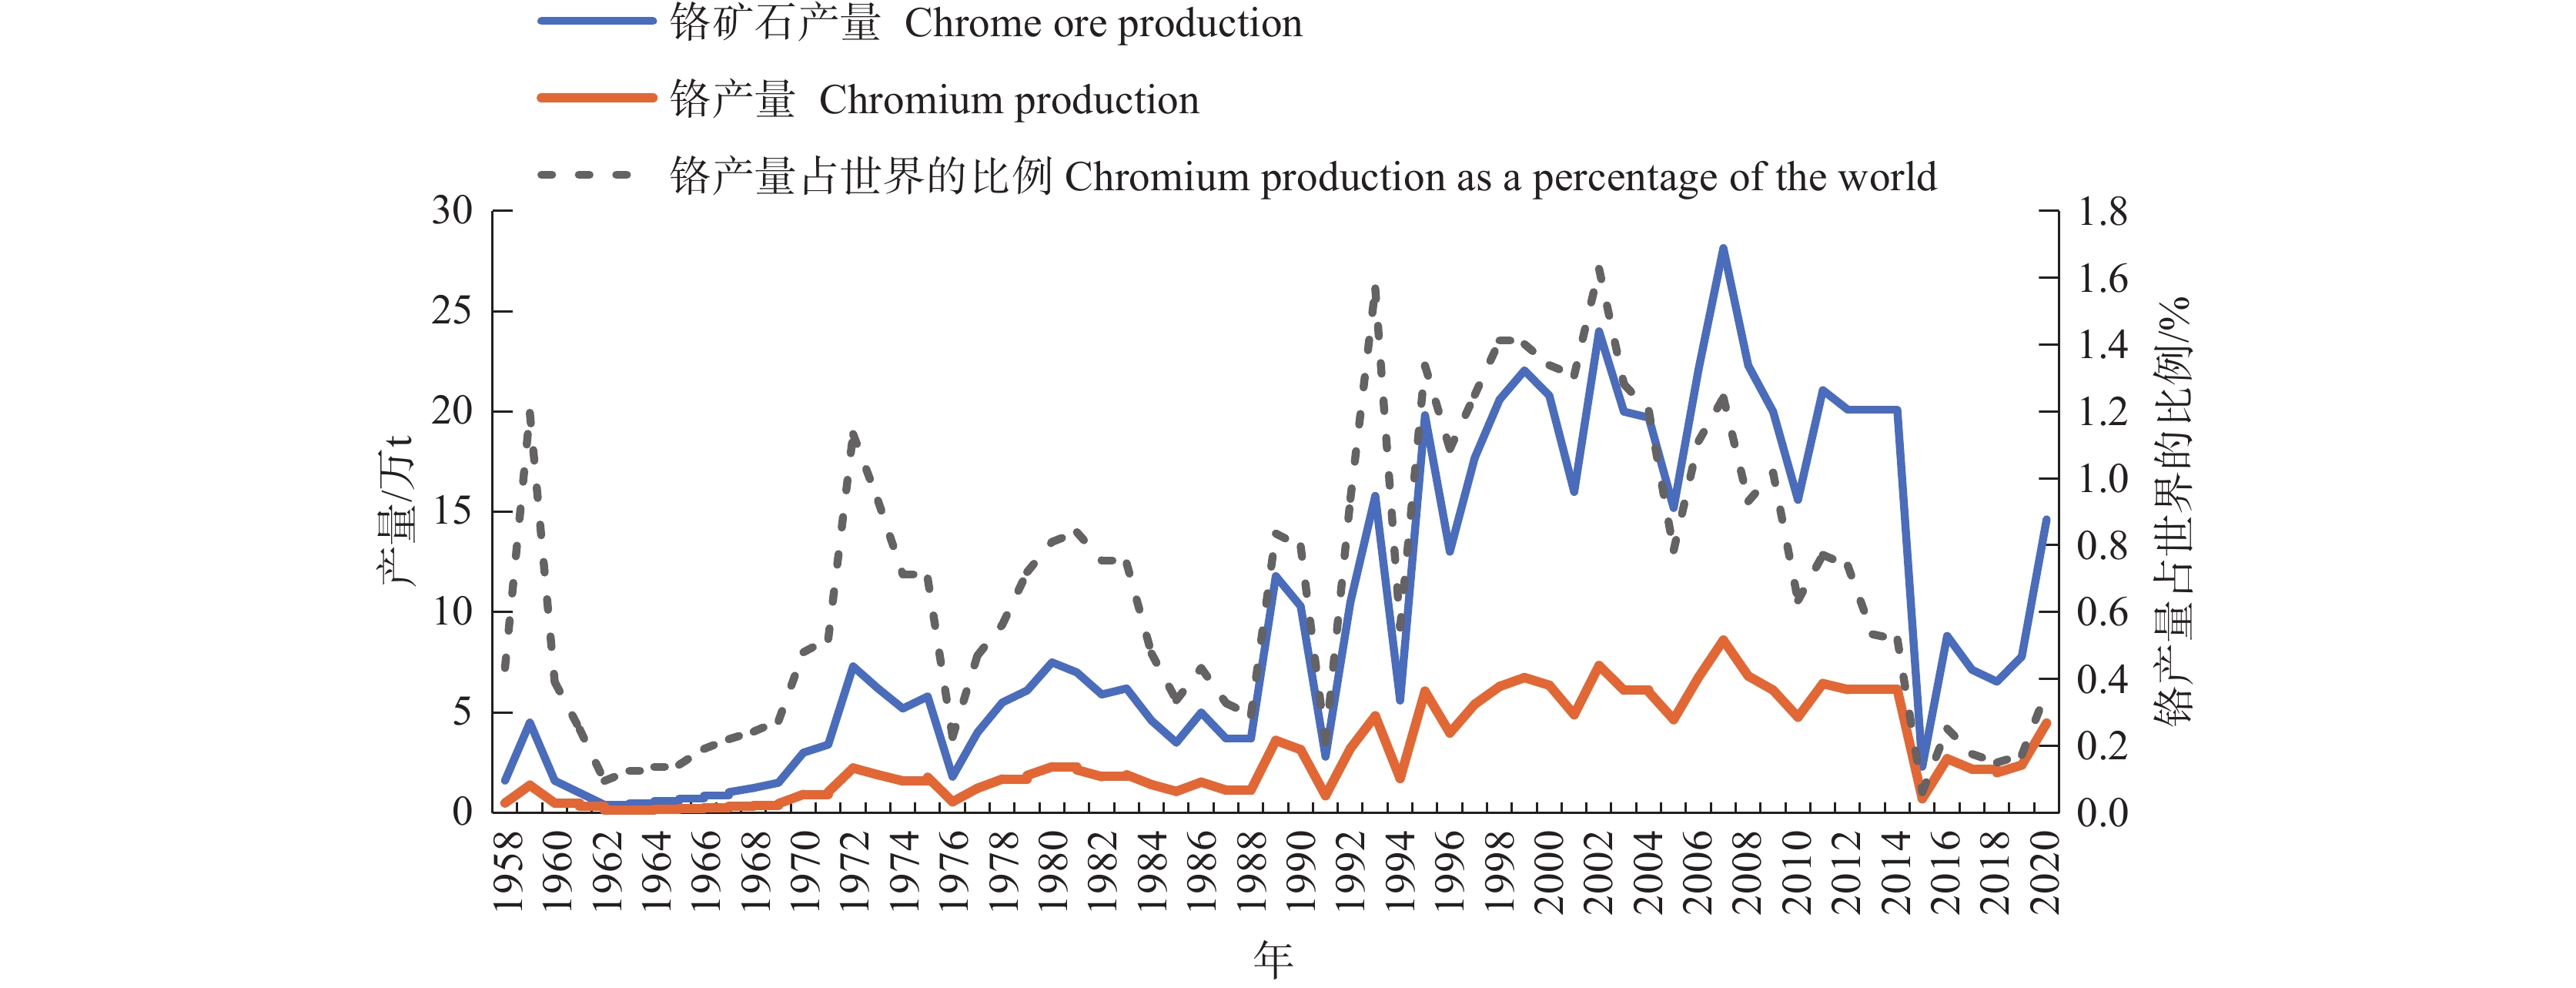
图 2 1958—2020年我国矿山铬矿石(铬)产量及其在世界的比例(数据来源,USGS, 1996—2022,https://www.usgs.gov/centers/national-minerals-information-center/chromium-statistics-and-information;《中国铬矿志》编辑委员会,1996;朱训,1999 )
Figure 2.
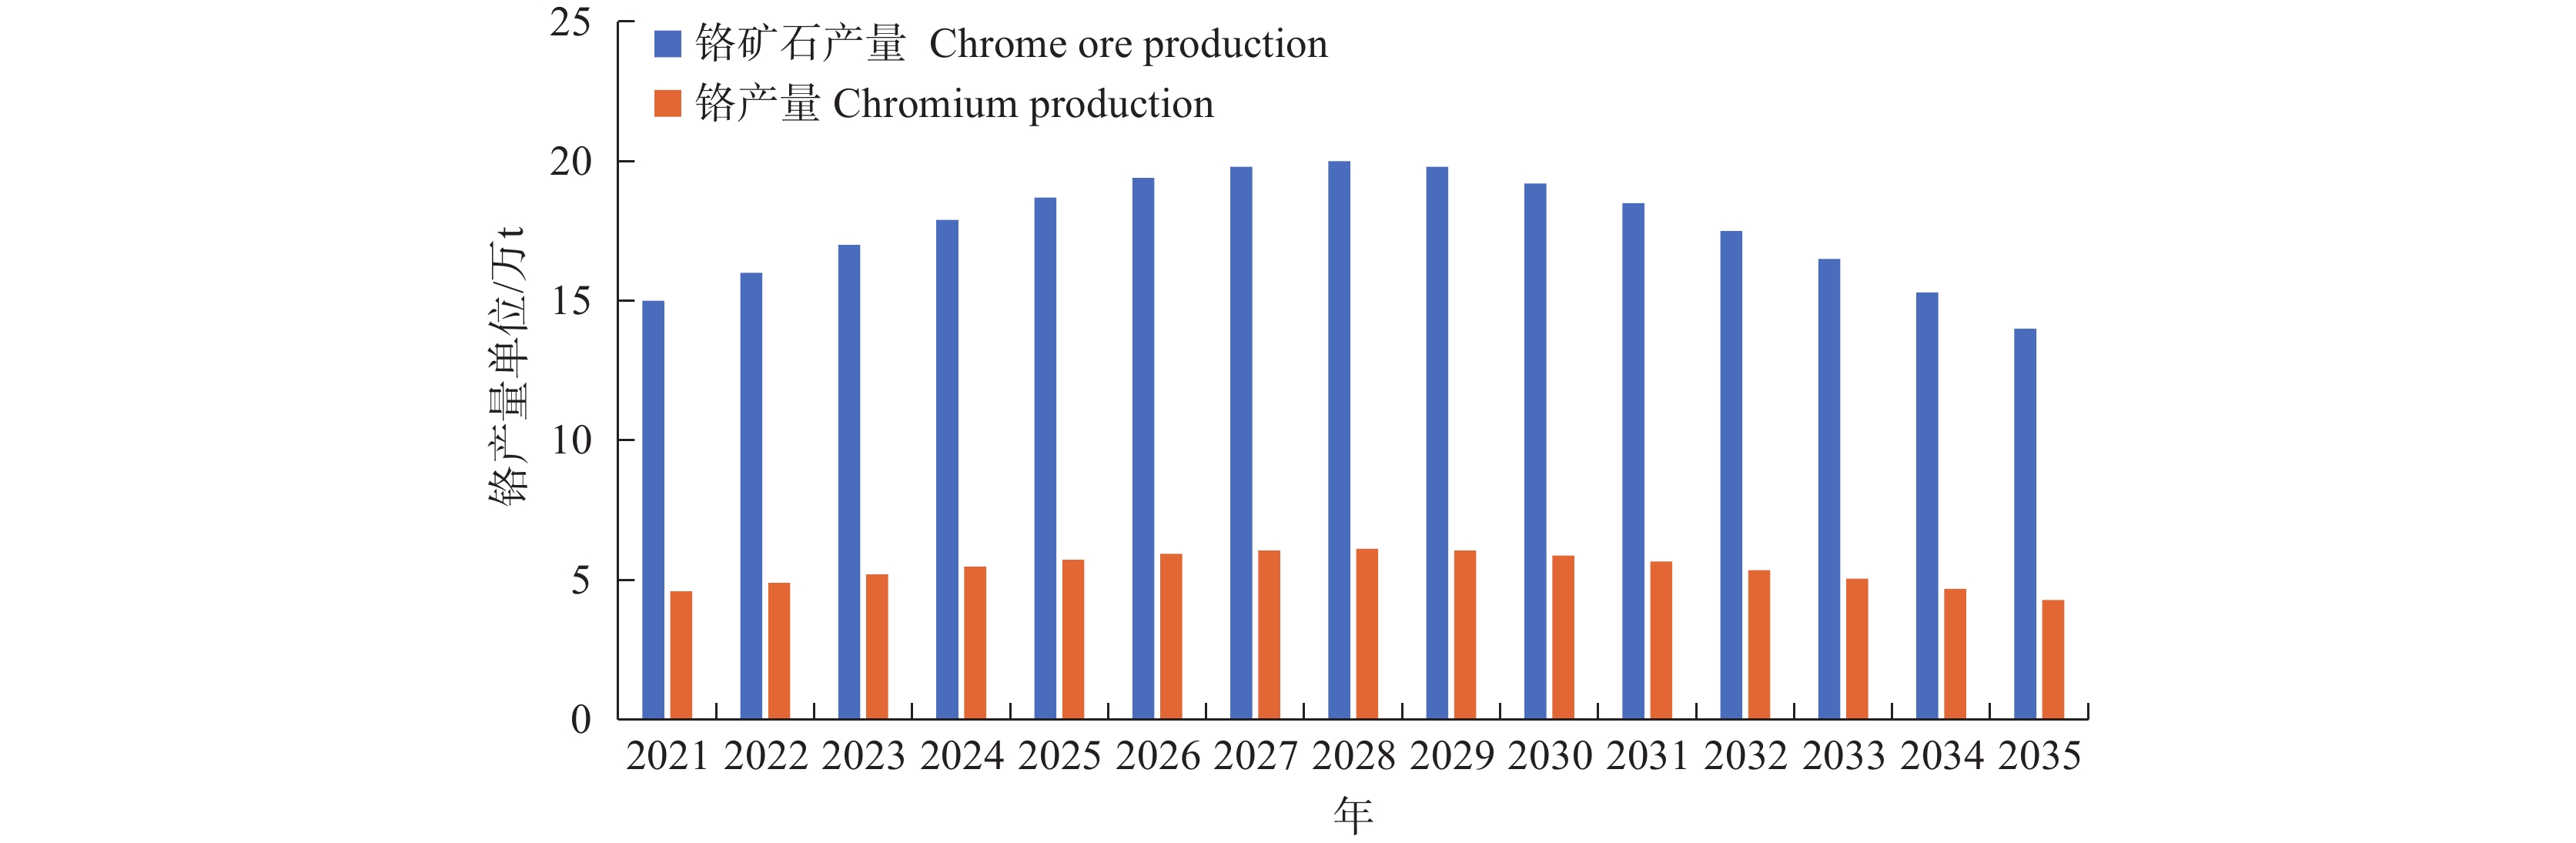
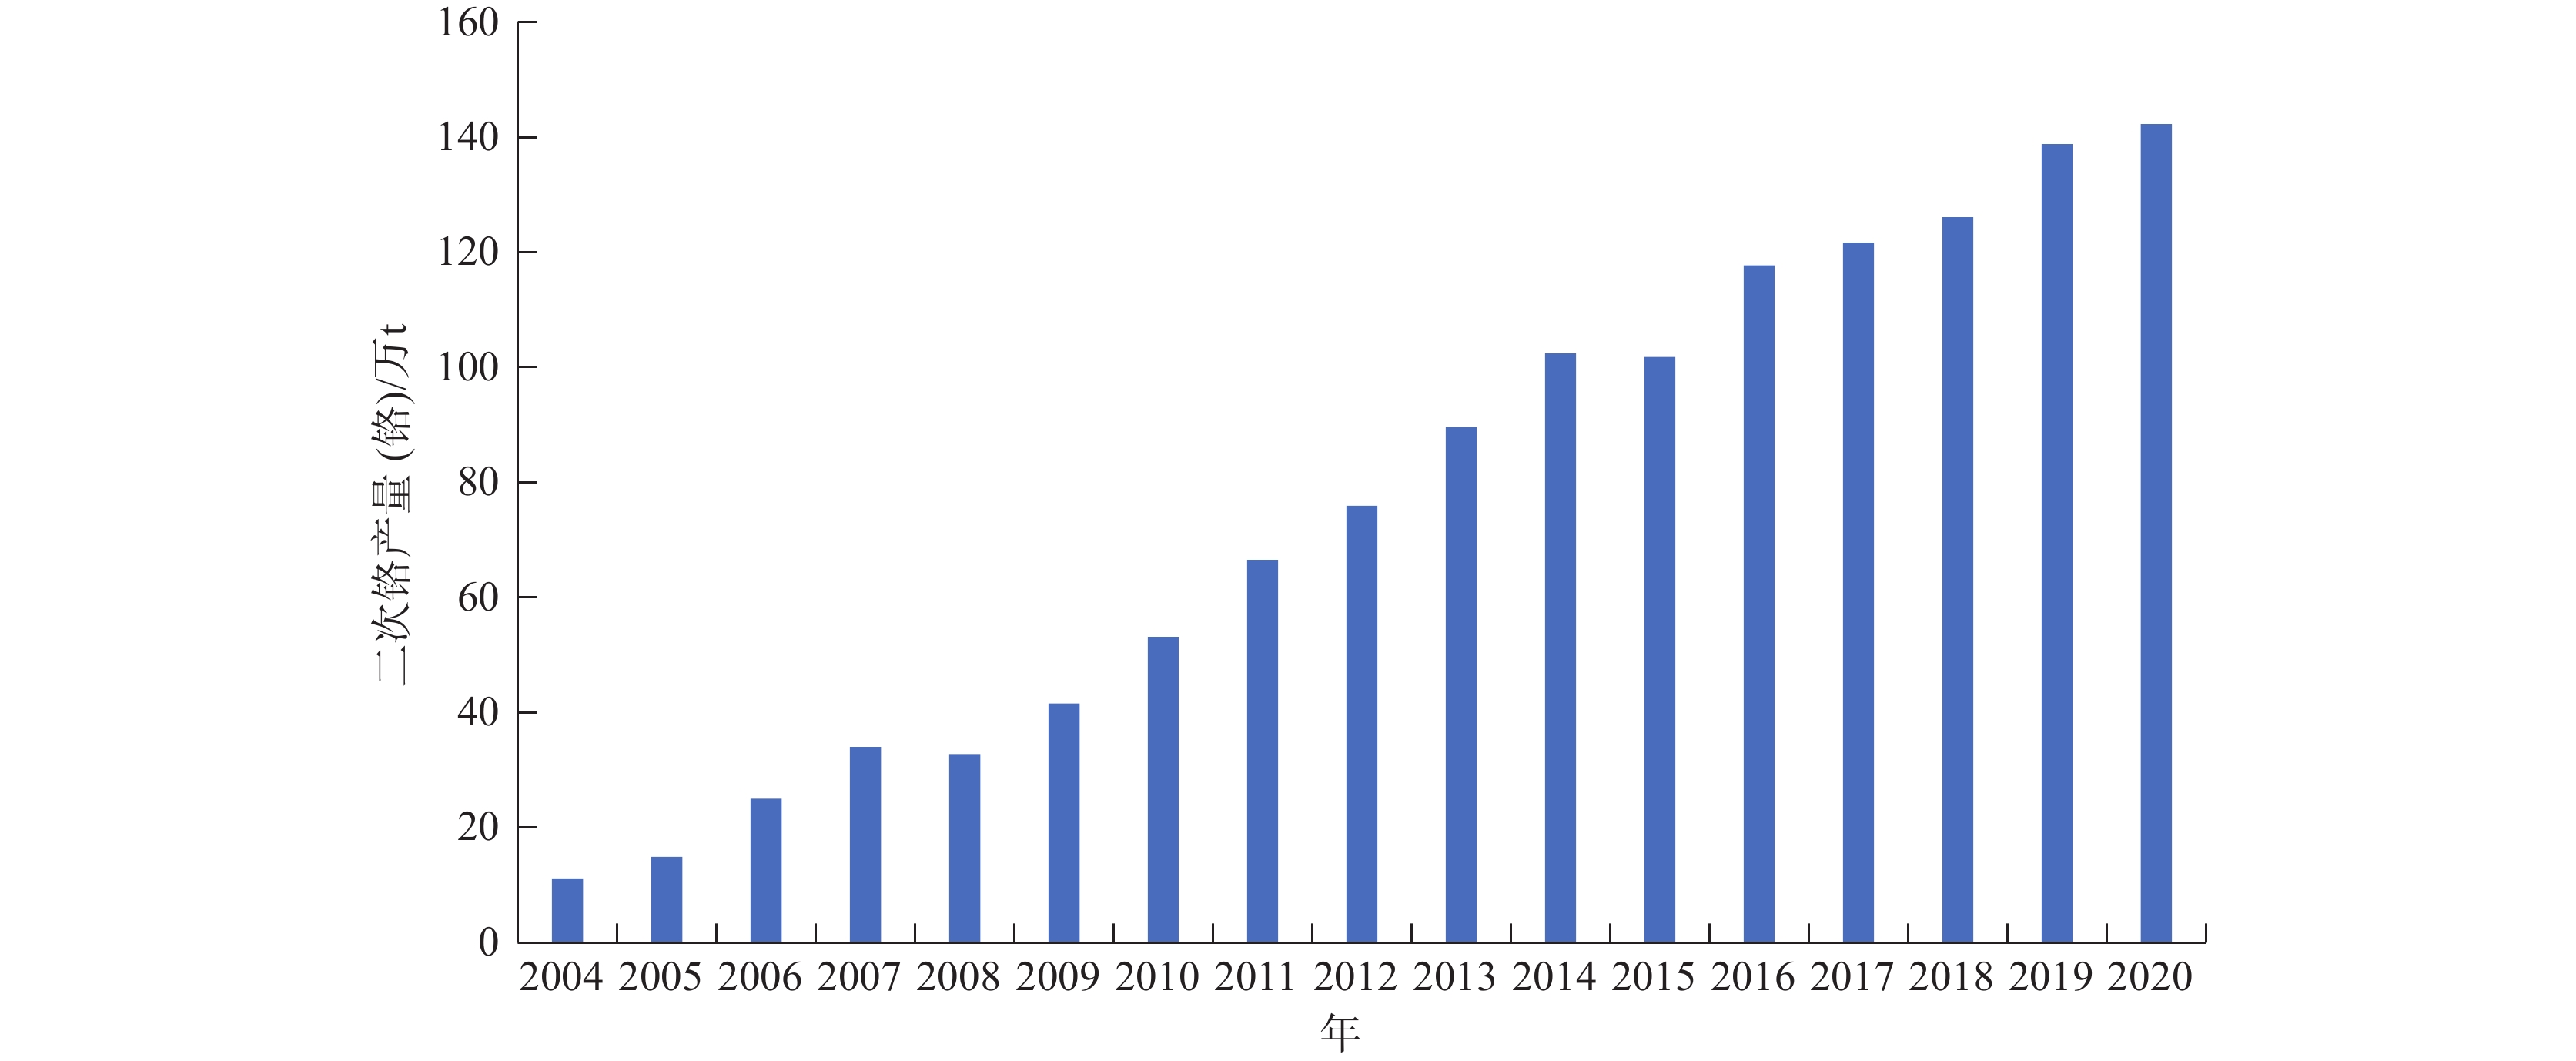
图 3 2021—2035年我国铬矿石(铬)产量预测(数据来源:USGS,2000—2020,https://www.usgs.gov/centers/national-minerals-information-center/chromium-statistics-and-information调研数据)
Figure 3.
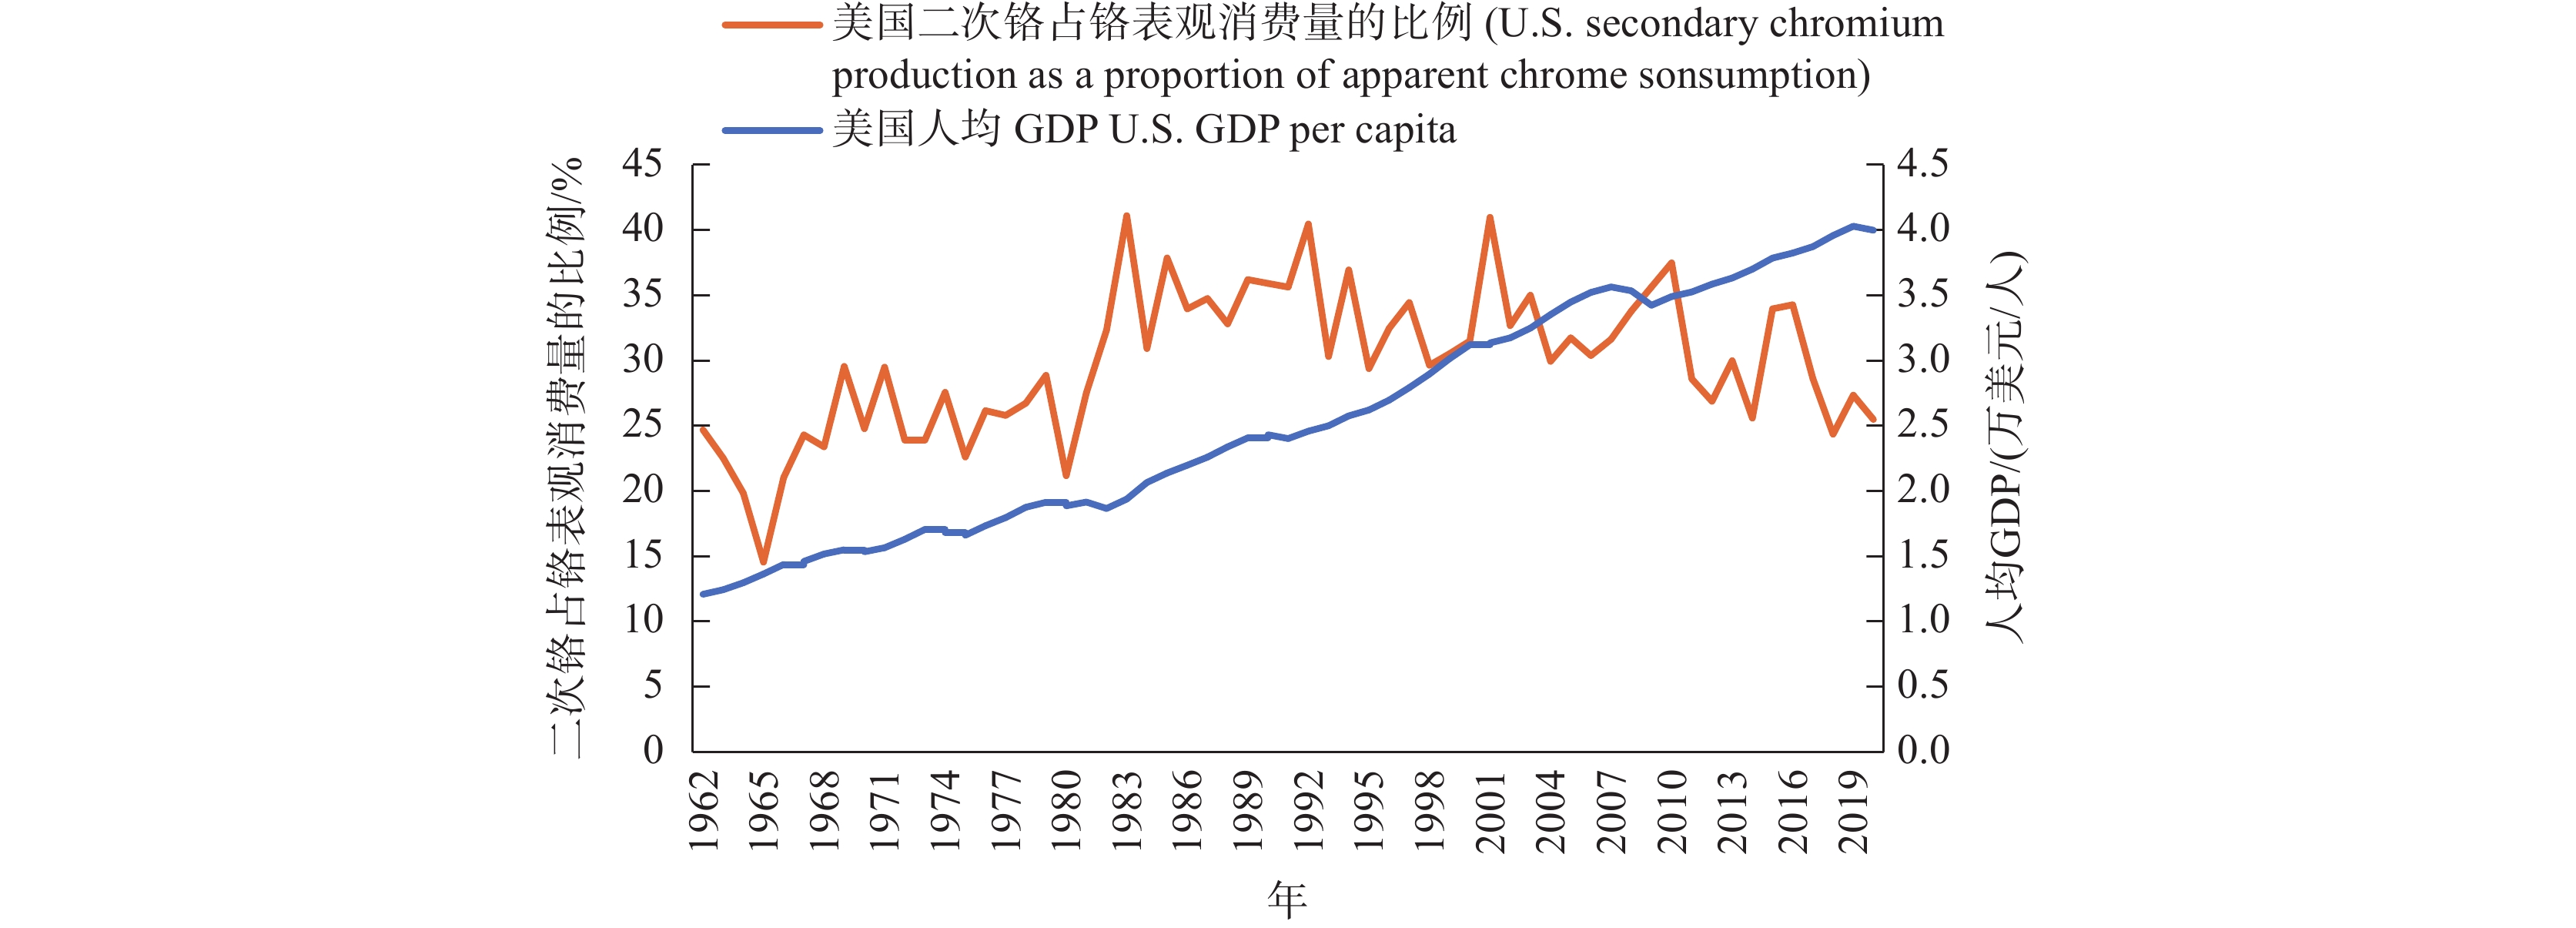
图 4 1962—2020年美国二次铬产量占铬表观消费量的比例与人均GDP(基础数据来源:二次铬USGS,https://www.usgs.gov/centers/national-minerals-information-center/chromium-statistics-and-information,人均GDP 世界银行)
Figure 4.
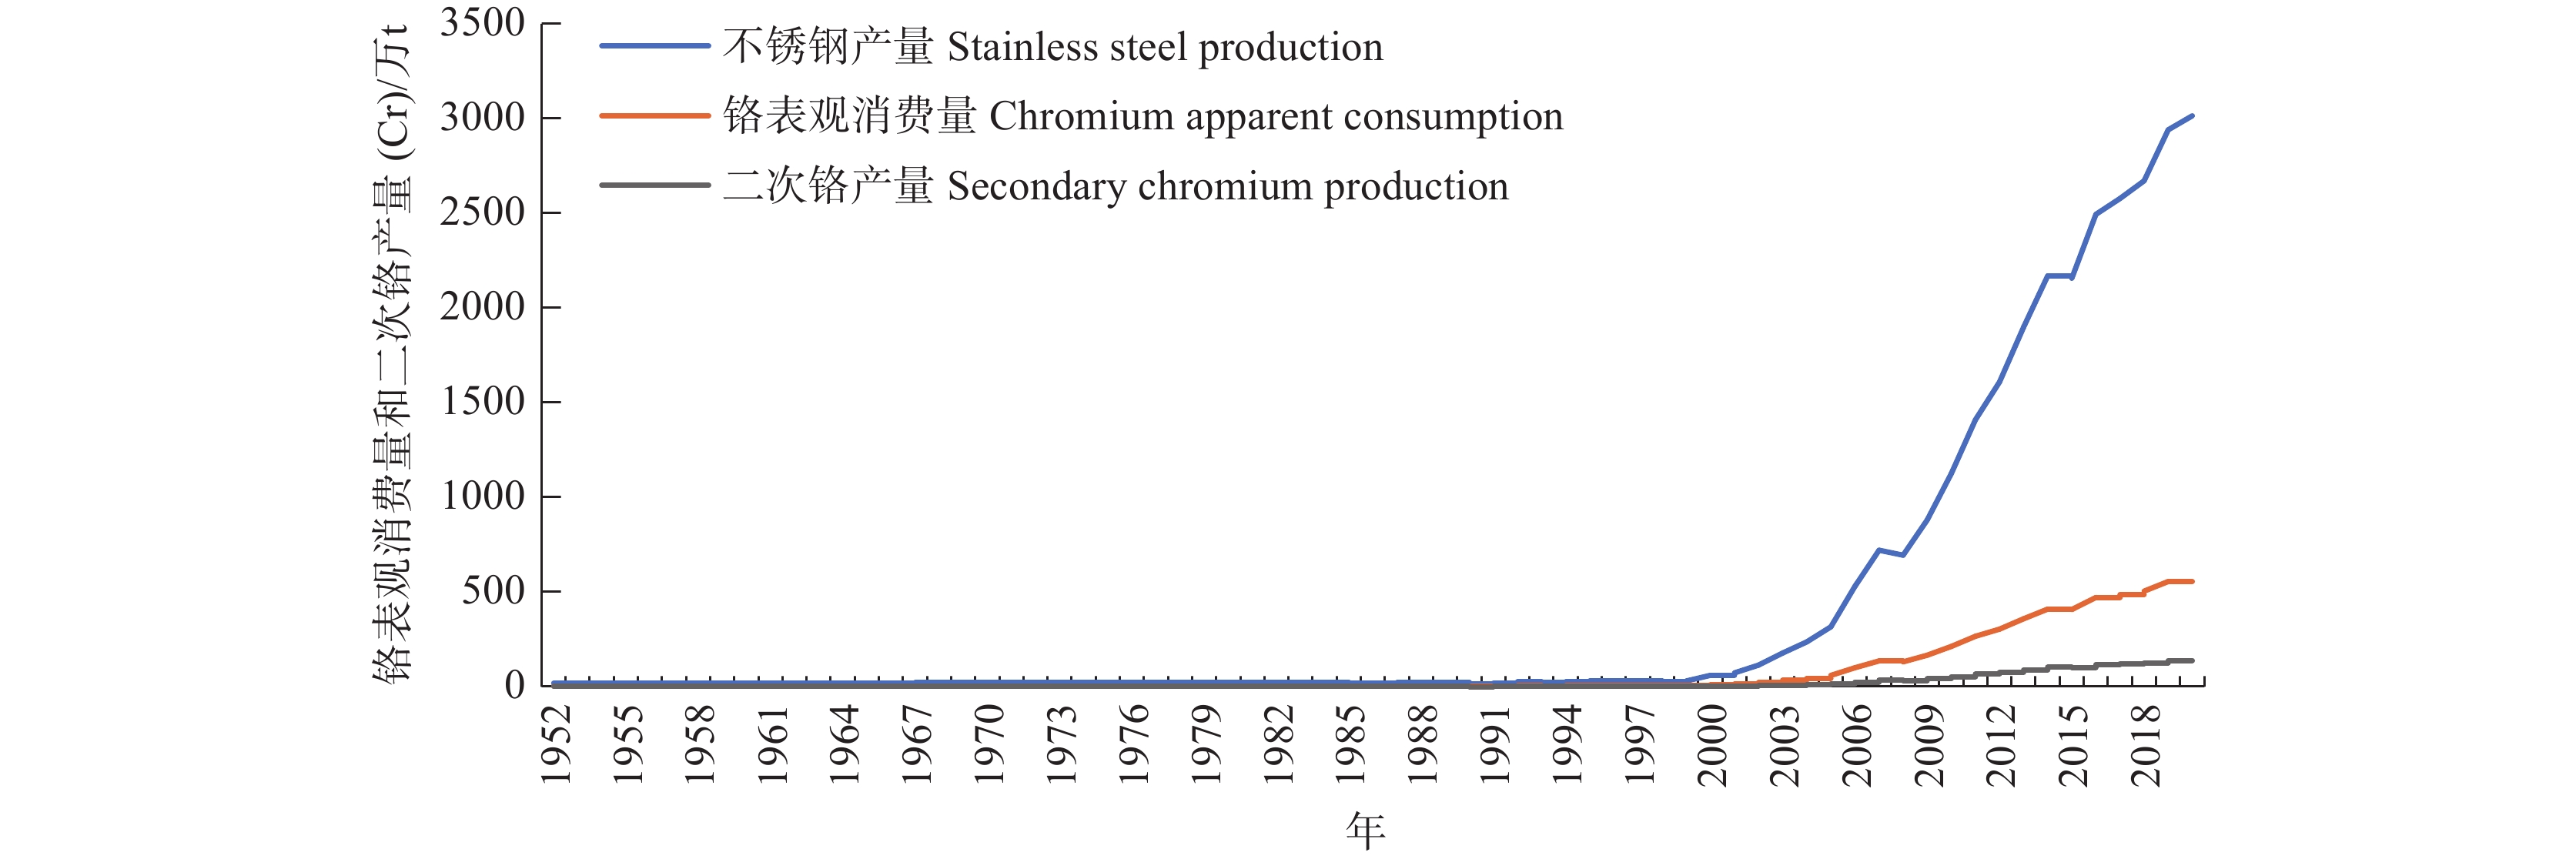
图 6 1952—2020年我国二次铬、铬表观消费量和不锈钢产量变化(不锈钢产量数据来源:World Bureau of Metal Statistics,1979—2021,https://world-bureau.co.uk/publications-services/metals-database/)
Figure 6.
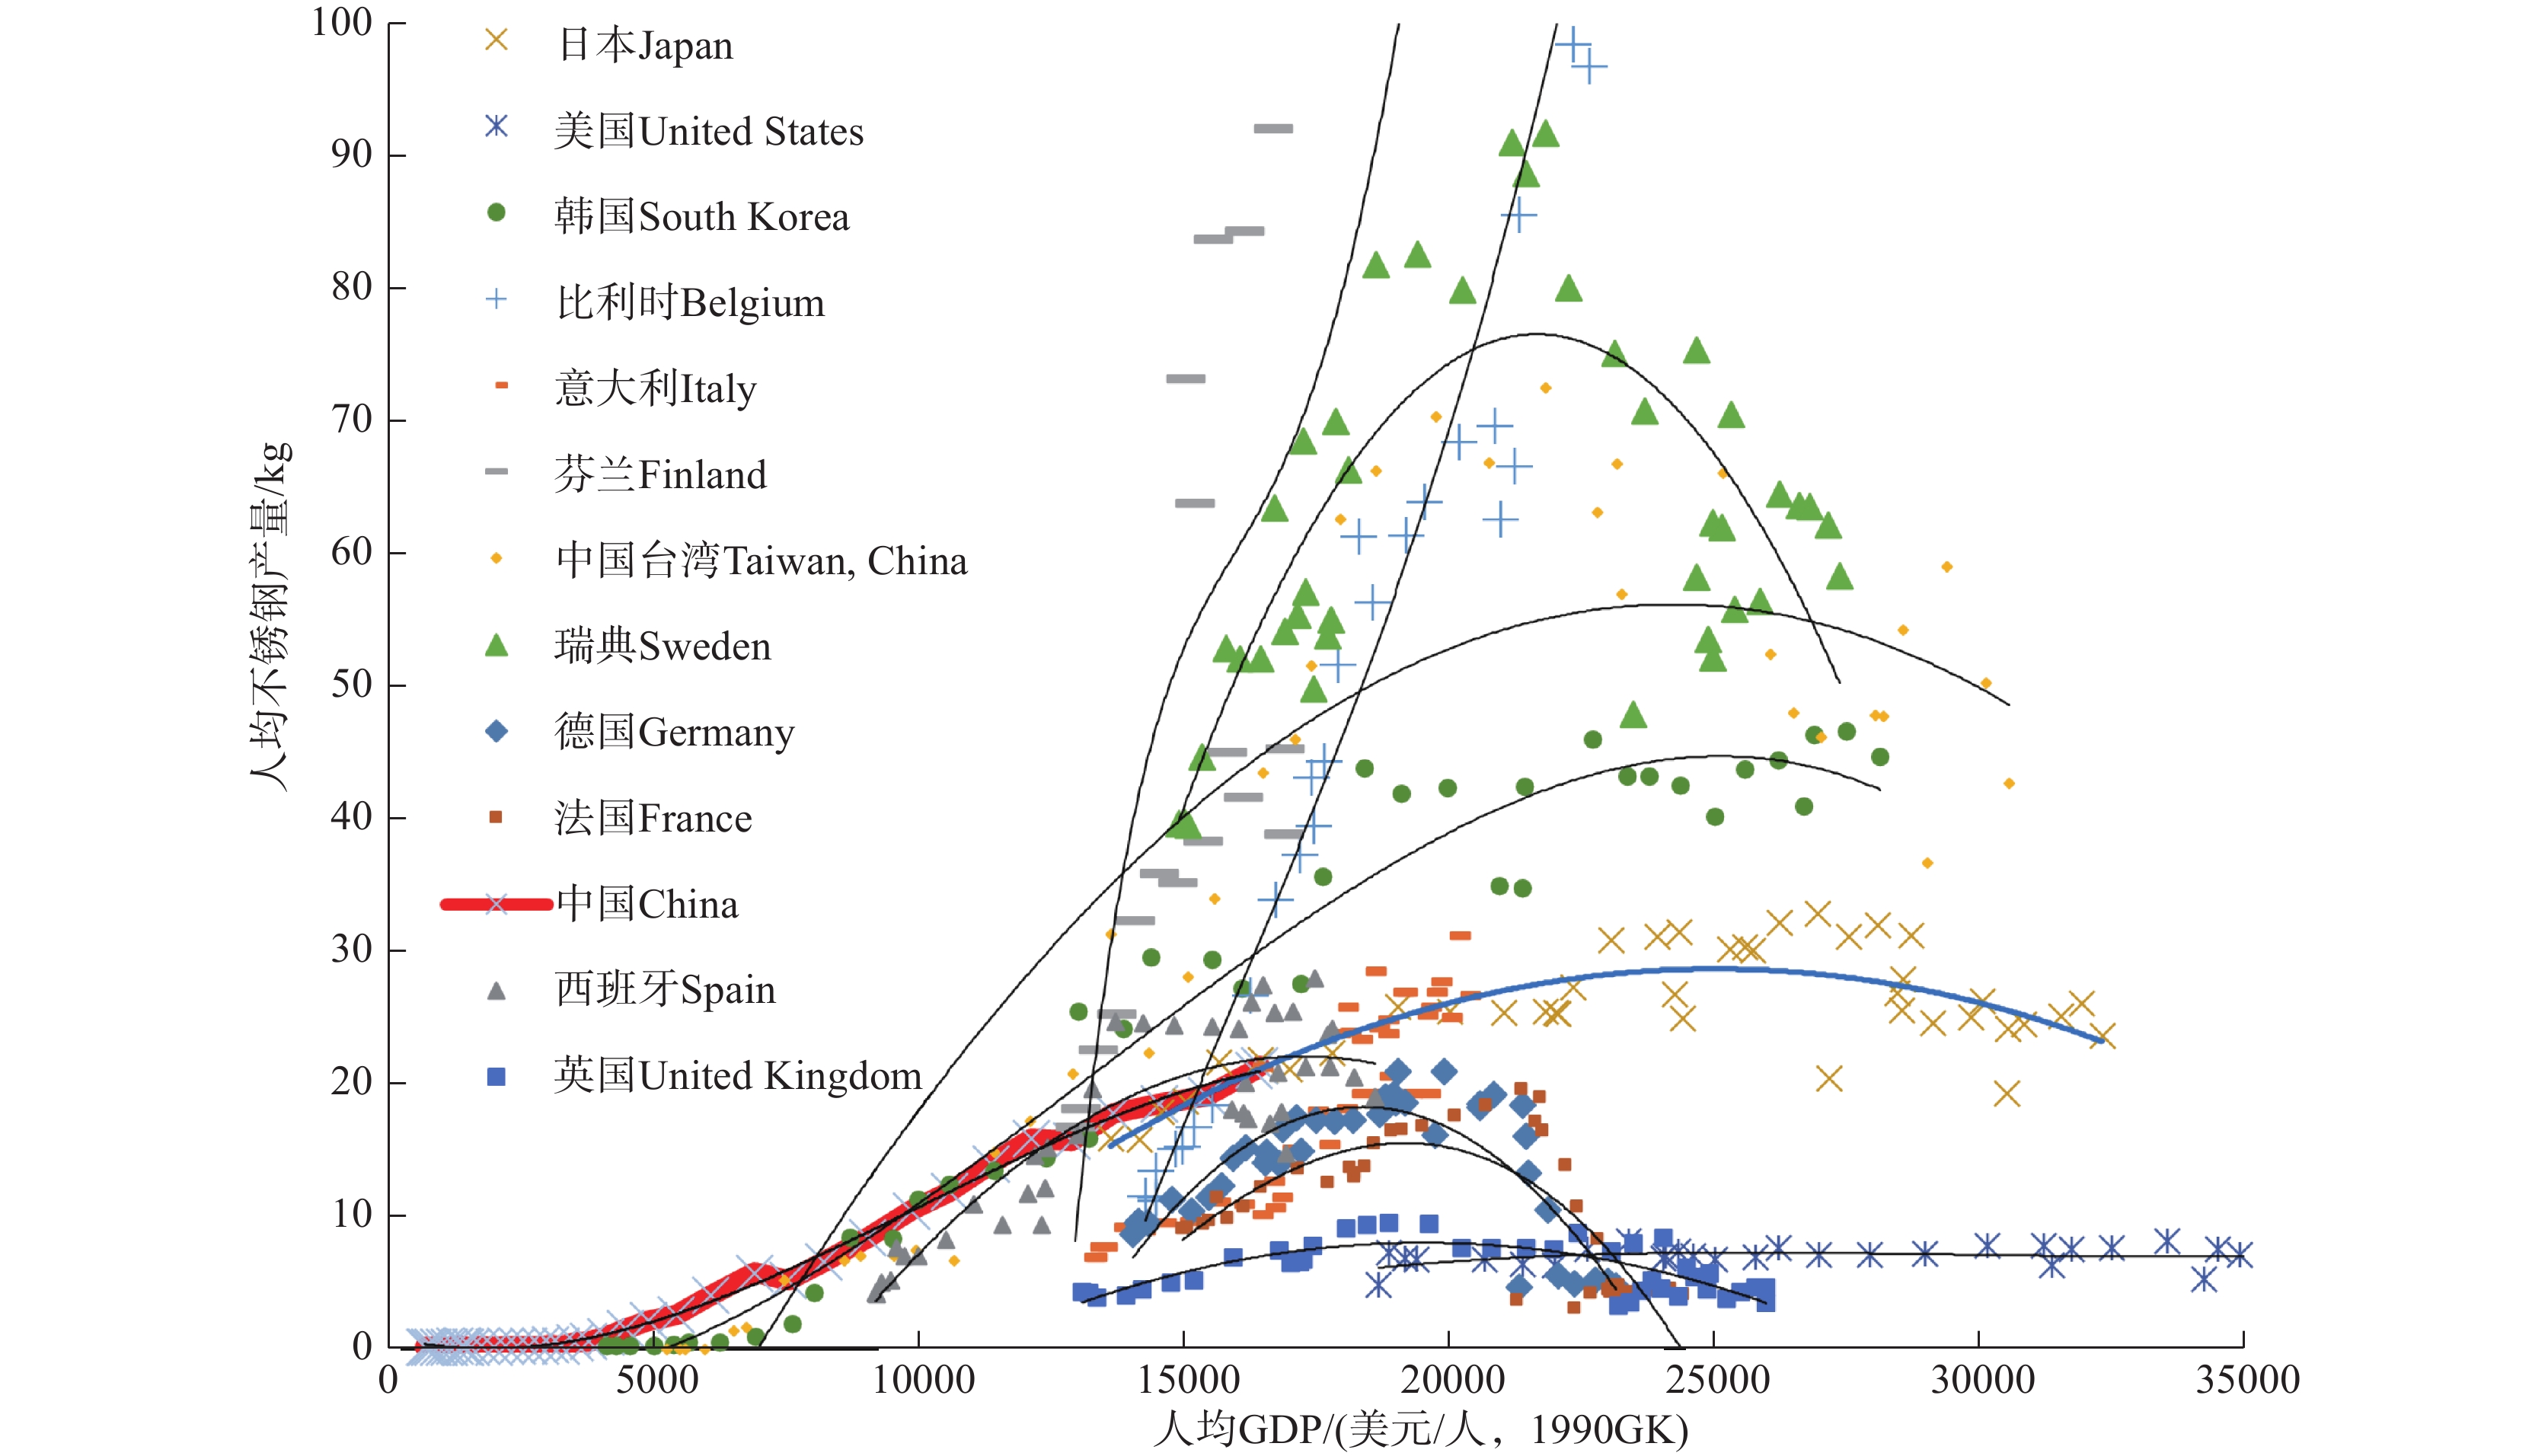
图 8 世界主要国家或地区不同发展阶段人均GDP与人均不锈钢产量“S”形曲线图(红色粗线为中国未来人均不锈钢产量演进趋势线,其他线条为不同国家人均不锈钢产量演进的趋势线)
Figure 8.

图 9 典型国家或地区不锈钢产量强度和人均GDP的关系图(倒“U”形曲线)(红色粗线为中国未来不锈钢产量强度演进趋势线,其他线条为不同国家不锈钢产量强度演进的趋势线)
Figure 9.
表 1 2021年世界铬铁矿分布
Table 1. Distribution of chromium reserves in the world in 2021
国家 储量*/万t 储量分布/% 南非 20000 35.1% 哈萨克斯坦 23000 40.4% 印度 10000 17.5% 芬兰 2600 4.6% 土耳其 1300 2.3% 世界总量 57000 100.0% 注:*储量为商品级铬矿石量(保有量);除美国铬矿石品位Cr2O3归一化为7%、芬兰铬矿石品位Cr2O3归一化为26%,其他国家的铬矿石品位Cr2O3一律归一化为45%;数据来源:USGS,Mineral Commodity Summaries, January 2022, Chromium。  下载: 导出CSV
表 2 三种“S”形情景下典型国家和地区人均不锈钢产量、人均GDP及人均铬需求量
Table 2. Per capita stainless steel production, per capita GDP and per capita chromium demand in typical countries and regions under three scenarios
情 景 参考国家或地区 峰值点/年 人均GDP/
(万美元/人,1990 GK 美元)*人均不锈钢产量/kg 人均铬需求量/kg 高情景(高“S”形) 瑞典
中国台湾
韩国2001
2007
20152.12~2.18
2.1~2.3
2.56~2.7575~78
55~58
43~4612.75~13.26
9.35~9.86
7.31~7.82中情景(中“S”形) 日本 2000 2.44~2.56 29~33 4.93~5.61 低情景(低“S”形) 德国
法国
英国2001
1994
19941.8~1.9
1.86~1.89
1.81~1.8819~21
15~17
8~93.23~3.57
2.55~2.89
1.36~1.53注:*1999盖凯美元,以1990年美元为标准,将各国GDP折算成统一化的货币标准——盖凯美元,便于对比研究分析。
下载: 导出CSV
表 3 中国不锈钢产量ARIMA模型法拟合统计量
Table 3. ARIMA model statistics of stainless steel production in China
模型 预测变量数 模型拟合统计量 平稳的 R2 R2 RMSE MAPE MAE MaxAPE MaxAE 正态化的BIC ssconsumption-模型_1 1 0.340 0.995 49.232 36.895 28.946 85.180 214.552 8.107 注:RMSE、MAPE、MAE和BIC分别表示均方根误差、平均绝对百分比误差、平均绝对误差和贝叶斯信息准则。
下载: 导出CSV
表 4 2021—2035年中国不锈钢产量预测结果(不锈钢产量/万t)
Table 4. Prediction results of stainless steel production in China from 2021 to 2035 (stainless steel production)
年份 拟合值(不锈钢产量) 置信下限** 置信上限** 2021 3126.06 3027.87 3224.25 2022 3383.07 3231.93 3534.2 2023 3646.11 3453.44 3838.78 2024 3919.96 3692.11 4147.81 2025 4205.72 3946.68 4464.75 2026 4503.78 4216.31 4791.26 2027 4814.44 4500.54 5128.33 2028 5137.92 4799.17 5476.67 2029 5474.49 5112.14 5836.84 2030 5824.38 5439.47 6209.3 2031 6187.84 5781.23 6594.45 2032 6565.11 6137.56 6992.65 2033 6956.43 6508.6 7404.26 2034 7362.05 6894.52 7829.58 2035 7782.21 7295.49 8268.93 注:**95%的置信水平。
下载: 导出CSV
表 5 2021—2035年中国不锈钢产量预测结果
Table 5. Prediction results of stainless steel production in China from 2021 to 2035
情景 年份 人均不锈钢产量“S”形法 ARIMA(2,2,1)模型法(不锈钢) 不锈钢综合预测结果 人均产量/
(kg/人)产量/
万t人均产量/
(kg/人)产量/万t
(拟合值)人均产量/
(kg/人)产量/
万t高情景方案
(参考高“S”形预测)2020 21.38 3004.79 21.38 3004.79 21.38 3004.79 2021 23.00 3244 25.06 3534.2 22.58 3185 2022 25.20 3564 27.14 3838.78 24.56 3474 2023 27.20 3857 29.25 4147.81 26.46 3751 2024 29.50 4192 31.42 4464.75 28.54 4056 2025 31.50 4484 33.65 4791.26 30.52 4345 2026 33.90 4833 35.97 5128.33 32.74 4669 2027 36.30 5181 38.37 5476.67 35.01 4998 2028 38.45 5493 40.85 5836.84 37.21 5316 2029 40.85 5839 43.44 6209.3 39.57 5657 2030 42.75 6113 46.12 6594.45 41.74 5969 2031 44.20 6320 48.90 6992.65 43.74 6254 2032(1) 45.00 6434 51.79 7404.26 45.46 6499 2033 44.95 6424 54.79 7829.58 44.95 6424 2034 44.75 6391 57.90 8268.93 44.75 6391 2035 44.30 6320 24.77 3534.2 44.30 6320 中情景方案
(参考中“S”形预测,利用了日本
人均不锈钢预测函数)2020 21.38 3004.79 21.38 3004.79 21.38 3004.79 2021 22.80 3215 22.17 3126.06 22.80 3215 2022 25.00 3536 23.92 3383.07 25.00 3536 2023 27.10 3843 25.71 3646.11 27.10 3843 2024 29.30 4164 27.59 3919.96 29.30 4164 2025 30.90 4399 29.54 4205.72 30.90 4399 2026 32.20 4591 31.59 4503.78 32.20 4591 2027 33.50 4782 33.73 4814.44 33.50 4782 2028 34.60 4943 35.96 5137.92 34.60 4943 2029 34.90 4989 38.30 5474.49 34.90 4989 2030(2) 35.00 5005 40.73 5824.38 35.00 5005 2031 34.60 4948 43.27 6187.84 34.60 4948 2032 33.70 4818 45.92 6565.11 33.70 4818 2033 32.80 4687 48.68 6956.43 32.80 4687 2034 31.50 4498 51.55 7362.05 31.50 4498 2035 30.00 4280 54.55 7782.21 30.00 4280 低情景方案
(参考低“S”形预测)2020(3) 21.38 3004.79 21.38 3004.79 21.38 3004.79 2021 21.36 3012 22.92 3231.93 21.36 3012 2022 21.35 3020 24.42 3453.44 21.35 3020 2023 21.34 3026 26.03 3692.11 21.34 3026 2024 21.33 3031 27.78 3946.68 21.33 3031 2025 21.32 3035 29.61 4216.31 21.32 3035 2026 21.22 3025 31.57 4500.54 21.22 3025 2027 21.20 3026 33.62 4799.17 21.20 3026 2028 21.00 3000 35.78 5112.14 21.00 3000 2029 20.88 2985 38.05 5439.47 20.88 2985 2030 20.77 2970 40.43 5781.23 20.77 2970 2031 20.55 2939 42.92 6137.56 20.55 2939 2032 20.35 2909 45.52 6508.6 20.35 2909 2033 20.00 2858 48.25 6894.52 20.00 2858 2034 19.88 2839 51.08 7295.49 19.88 2839 2035 19.55 2789 22.65 3231.93 19.55 2789 注:(1)高情景方案下的峰值点。(2)中情景方案下的峰值点。(3)低情景方案下的峰值点。2020年各指标为实际值。
下载: 导出CSV
表 6 2021—2035年中国铬矿供需形势综合分析表
Table 6. Comprehensive analysis of supply and demand situation of chromium ore in China from 2021 to 2035
项目(中情景) 铬预测结果 2021年 2025年 2030年 2035年 铬需求侧 不锈钢需求量(万t) 3215 4399 5005 4280 折铬需求量(万t)∗ 546.55 747.83 850.85 727.60 铬总需求量(万t)∗∗ 607.28 830.92 945.39 807.33 累计铬需求量(万t) 607.28 19157
(2021—2025)43467
(2021—2030)66698
(2021—2035)铬供给侧 矿山铬产量(铬 万t) 4.59 5.72 5.87 4.28 累计矿山铬产量(铬 万t) 4.59 25.87
(2021—2025)55.90
(2021—2030)80.92
(2021—2035)二次铬产量(万t)∗∗∗ 182.18 249.27 283.62 242.20 累计二次铬产量(万t) 182.18 1085.86
(2021—2025)2463.13
(2021—2030)3779.55
(2021—2035)综合 对外依存度(%)(不含二次铬产量) 99.24 99.31 99.38 99.47 对外依存度(%)(含二次铬产量) 69.24 69.31 69.38 69.47 供需缺口(不含二次铬产量) 602.69 825.20 939.52 804.16 供需缺口(含二次产量) 420.51 575.93 655.90 561.63 铬对需求的保障率(%)(不含二次铬产量) 0.76 0.69 0.62 0.53 铬对需求的保障率(%)(含二次铬产量) 30.76 30.69 30.62 30.53 注:∗不锈钢中的含铬量按17%测算;∗∗按铬在不锈钢中消费量占比90%测算;∗∗∗按二次铬产量占铬表观消费量比例的30%测算。需求的保障率=(国内供应量/总需求量)×100%,对外依存度=(1−国内供应量/总需求量)×100%。
下载: 导出CSV
-
[1] Bao Peisheng, Wang Xibin, Peng Genyong, Chen Fangyuan. 1999. Chromium Iron Deposits in China[M]. Beijing: Science Press (in Chinese with English abstract).
[2] Chen Qishen, Wang Gaoshang, Wang Anjian. 2010. An analysis of the three turning points in the “S−shape” rule of copper and aluminum demand[J]. Acta Geoscientica Sinica, 31(5): 659−665 (in Chinese with English abstract).
[3] Department of Mineral Resources Protection And Supervision, Ministry of Natural Resources, Mineral Resources Reserve Evaluation Center, Ministry of Natural Resources. 2021. Compilation of Technical Standards for Mineral Resources Reserves[M]. Beijing: Geological Publishing House, 1232−1233 (in Chinese).
[4] Editorial Committee, Chronicles of Chromium Mines in China. 1996. Chronicles of Chromium Mines in China [M]. Beijing: Metallurgical Industry Press (in Chinese).
[5] Editorial Committee, Handbook of Industrial Requirements for Mineral Resources. 2010. Handbook of Industrial Requirements for Mineral Resources[M]. Beijing: Geological Publishing House (in Chinese).
[6] Gao Xinrui, Wang Anjian. 2010. The prediction of China’s steel demand based on S−shaped regularity[J]. Acta Geoscientica Sinica, 31(5): 645−652 (in Chinese with English abstract).
[7] Gao X R, Wang A J, Liu G W, Liu C H, Yan K. 2018. Expanded S−curve model of a relationship between crude steel consumption and economic development: Empiricism from case studies of developed economies[J]. Natural Resources Research, 28: 547−562.
[8] Ju Jianhua, Zhang Zhaozhi, Pan Zhaoshuai, Che Dong, Li Houmin. 2022. Determination of mineral resources in China’s strategic emerging industries and analysis of the demand of the “14th five−year plan”[J]. China Mining Magazine, 31(9): 1−11 (in Chinese with English abstract).
[9] Lu Ning. 2018. Prediction and analysis of stainless steel production in 2020 and 2025, China[J]. Metallurgical Economy and Management, (3): 43−48 (in Chinese with English abstract).
[10] Höök M, Li J C, Oba N, Snowden S. 2011. Descriptive and predictive growth curves in energy system analysis[J]. Natural Resources Research, 20: 103−116. doi: 10.1007/s11053-011-9139-z
[11] Huang Darong, Huang Lifen. 2009. Present situation and development tendency of grey system theory in fault forecast application[J]. Journal of Gun Launch & Control, (3): 88−92 (in Chinese with English abstract).
[12] Liu Xuan, Chen Qishen, Zhang Yanfei, Gao Tianming. 2015. Chinese chromium demand forecasting and resource supply security[J]. Resources Science, 37(5): 933−943 (in Chinese with English abstract).
[13] Ministry of Natural Resources. 2021a. Statistical Table of National Mineral Resources Reserves [EB/OL]. http://www.mnr.gov.cn/(in Chinese).
[14] Ministry of Natural Resources. 2021b. China Mineral Resources (2020) [M]. Beijing: Geological Publishing House (in Chinese).
[15] Michael A K. 2022. Product innovation, diffusion and endogenous growth[J]. Review of Economic Dynamics, 48: 178−201.
[16] Wang A J, Wang G S, Chen Q S, Yu W J, Yan K, Yang H B. 2015. S−curve model of relationship between energy consumption and economic development[J]. Natural Resources Research, 24(1): 53−64. doi: 10.1007/s11053-014-9234-z
[17] Wang Anjian, Wang Gaoshang. 2002. Mineral Resources and National Economic Development [M]. Beijing: Seismological Press (in Chinese with English abstract).
[18] Wang Anjian, Wang Gaoshang, Chen Qishen, Yu Wenjia, Yan Qiang, Han Shuqin, Zhang Zhaozhi, Niu Jianying, Zhou Fengying, Geng Nuo, Wang Lili, Liu Sha, Na Danni. 2008. Energy and National Economic Development [M]. Beijing: Geological Publishing House (in Chinese with English abstract).
[19] Wang Denghong, Zhang Shaohua, Xiong Xianxiao. 2018. Geological Records of Mineral Resources in China[M]. Beijing: Geological Publishing House (in Chinese with English abstract).
[20] Wei Weiqiang. 2006. The reason of Japan’s development and stagnate in economy and its inspiration to that of China[J]. Aroud Southeast Asia, (11): 69−74 (in Chinese with English abstract).
[21] Zhang Wei. 2016. Demand analysis and prediction of world chrome resource[J]. Resources & Industries, 18(4): 87−91 (in Chinese with English abstract).
[22] Zhang Zenan, Zhang Zhaozhi, Pan Zhaoshuai, Wu Qing, Xu Hengyi. 2019. Analysis of China’ supply safety by global chromium ore resources countries[J]. Chinese Mining Magazine, 28(10): 69−76 (in Chinese with English abstract).
[23] Zheng Minggui, Yuan Xuemei. 2018. Demand forecasting of China’s chrome ore from 2020 to 2030 based on grey neural network[J]. Resources Development & Metal, 34(6): 747−752 (in Chinese with English abstract).
[24] Zhu Mingyu, Wang Chenghui, Wang Denghong, Li Lixing, Zhang Jian, Wang Guorui, Zhou Xiang. 2013. The major Chromiun concentration areas in China and a discussion on their resource potential[J]. Geology in China, 40(4): 995−1006 (in Chinese with English abstract).
[25] Zhu Xun. 1999. China Mining Situation (Volume 2 Metal Minerals) [M]. Beijing: Science Press, 1−665 (in Chinese).
[26] 鲍佩声, 王希斌, 彭根永, 陈方远. 1999. 中国铬铁矿床[M]. 北京: 科学出版社.
[27] 陈其慎, 王高尚, 王安建. 2010. 铜、铝需求“S”形规律的三个转变点剖析[J]. 地球学报, 31(5): 659−665.
[28] 高芯蕊, 王安建. 2010. 基于“S”规律的中国钢需求预测[J]. 地球学报, 31(5): 645−652.
[29] 国家统计局. 2018. 战略性新兴产业分类(2018)[EB/OL]. [2021−11−05] http://www.stats.gov.cn/tjgz/tzgb/201811/t20181126_1635848.html
[30] 《矿产资源工业要求手册》编委会. 2010. 矿产资源工业要求手册[M]. 北京: 地质出版社.
[31] 鞠建华, 张照志, 潘昭帅, 车东, 李厚民. 2022. 我国战略性新产业矿产厘定与“十四五”需求分析[J]. 中国矿业, 31(9): 1−11. doi: 10.12075/j.issn.1004-4051.2022.09.025
[32] 鹿宁. 2018. 2020年和2025年我国不锈钢产量预测分析[J]. 冶金经济与管理, (3): 43−48. doi: 10.3969/j.issn.1002-1779.2018.03.013
[33] 黄大荣, 黄丽芬. 2009. 灰色系统理论在故障预测中的应用现状及其发展趋势[J]. 火炮发射与控制学报, (3): 88−92. doi: 10.3969/j.issn.1673-6524.2009.03.023
[34] 刘璇, 陈其慎, 张艳飞, 高天明. 2015. 中国铬需求预测及资源供应安全态势分析[J]. 资源科学, 37(5): 0933−0943.
[35] 王安建, 王高尚. 2002. 矿产资源与国家经济发展[M]. 北京: 地震出版社.
[36] 王安建, 王高尚, 陈其慎, 于汶加, 闫强, 韩淑琴, 张照志, 牛建英, 周凤英, 耿诺, 汪莉丽, 刘莎, 那丹妮. 2008. 能源与国家经济发展[M]. 北京: 地质出版社.
[37] 王登红, 章少华, 熊先孝. 2018. 中国矿产地质志[M]. 北京: 地质出版社.
[38] 韦伟强. 2006. 日本经济发展、停滞原因及对中国经济的启示[J]. 东南亚纵横, (11): 69−74. doi: 10.3969/j.issn.1003-2479.2006.11.014
[39] 张炜. 2016. 世界铬矿资源需求分析及预测[J]. 资源与产业, 18(4): 87−91.
[40] 张泽南, 张照志, 潘昭帅, 吴晴, 徐恒逸. 2019. 全球铬矿石资源国对中国供应安全度分析[J]. 中国矿业, 28(10): 69−76.
[41] 郑明贵, 袁雪梅. 2018. 基于灰色神经网络的中国2020−2030年铬矿需求预测[J]. 资源开发与市场, 34(6): 747−752 doi: 10.3969/j.issn.1005-8141.2018.06.002
[42] 朱明玉, 王成辉, 王登红, 李立兴, 张建, 王国瑞, 周详. 2013. 中国铬矿主要矿集区及其资源潜力探讨[J]. 中国地质, 40(4): 995−1006. doi: 10.3969/j.issn.1000-3657.2013.04.001
[43] 朱训. 1999. 中国矿情(第二卷 金属矿产)[M]. 北京: 科学出版社, 1−665.
[44] 《中国铬矿志》编辑委员会. 1996. 中国铬矿志[M]. 北京: 冶金工业出版社.
[45] 自然资源部. 2021a. 全国矿产资源储量统计表[EB/OL]. [2021−12−01] http://www.mnr.gov.cn/.
[46] 自然资源部. 2021b. 中国矿产资源报告(2020)[M]. 北京: 地质出版社.
[47] 自然资源部矿产资源保护监督司, 自然资源部矿产资源储量评审中心. 2021. 矿产资源储量技术标准汇编 [M]. 北京: 地质出版社, 1232−1233.
-


图(14)
表(6)
计量
- 文章访问数: 1461
- PDF下载数: 96
- 施引文献: 0