

Evaluation of black soil quality in Sanjiang Plain based on minimum data set: Taking the plain area of Baoqing County in Heilongjiang Province as an example
-
摘要:
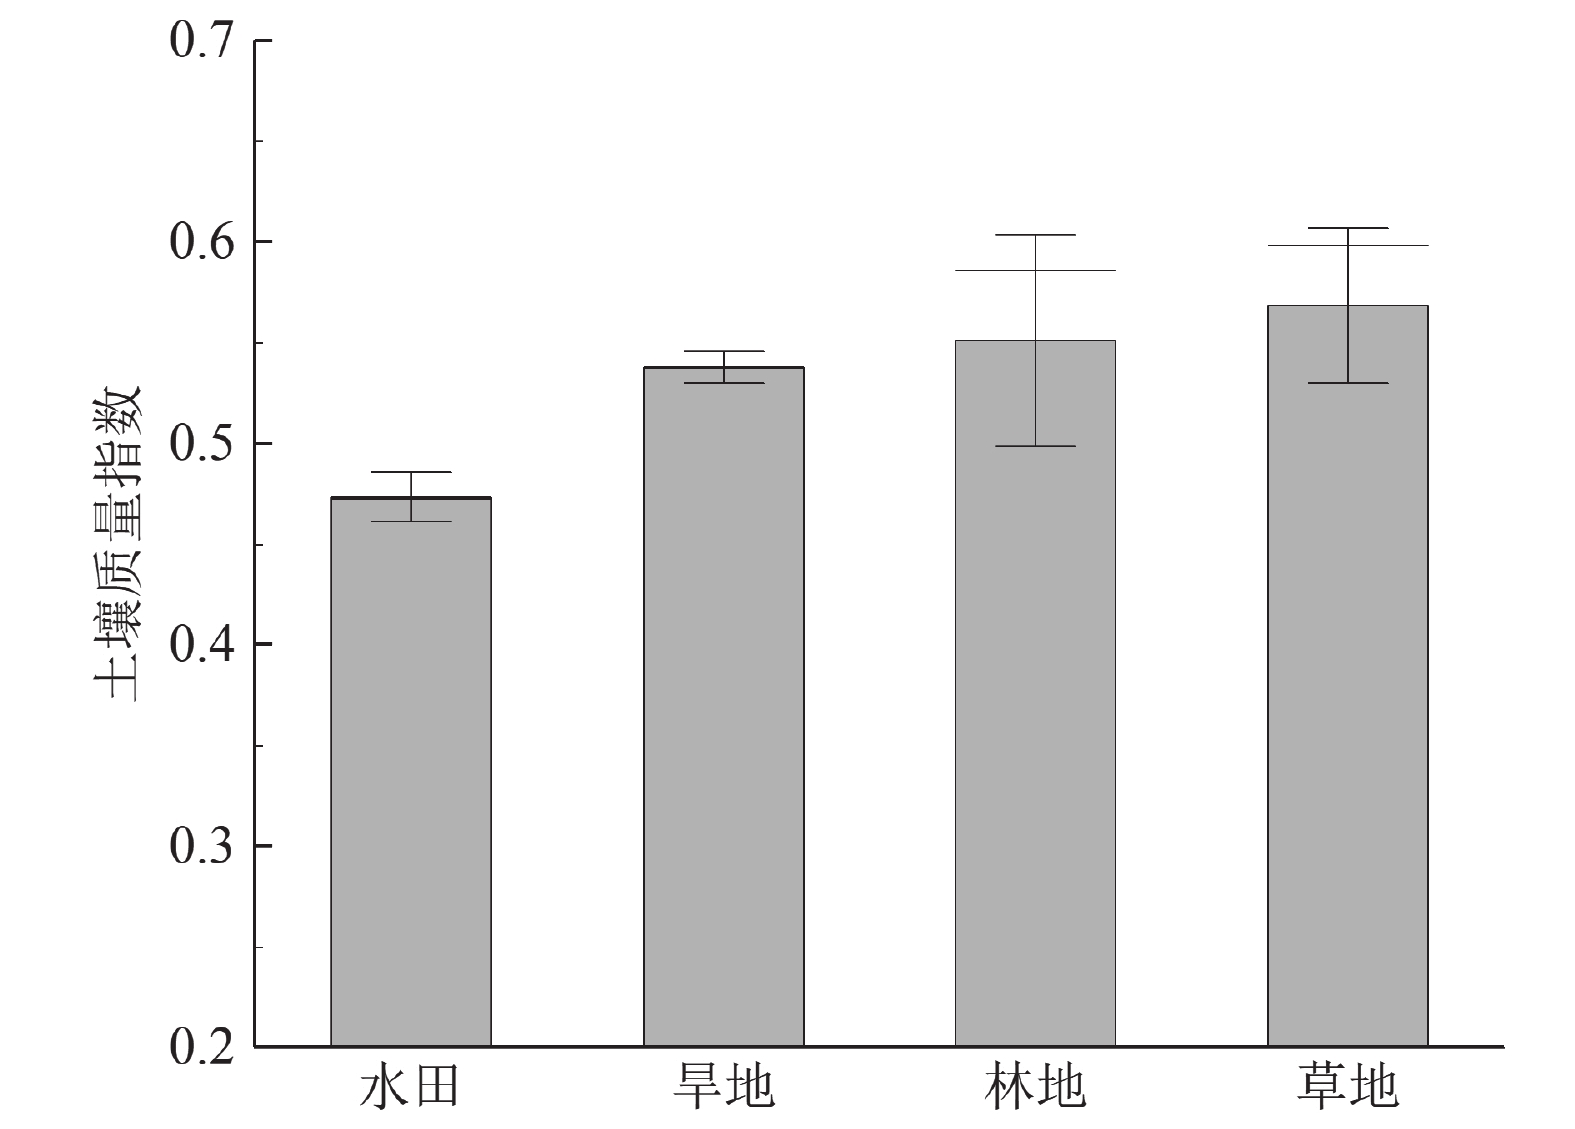
土壤质量评价是实施精细化农业生产和土地科学管理的关键。对不同土地利用方式下的土壤质量进行评估并对其空间分布进行绘制,可以为优化土地利用空间布局,客观准确评价土壤质量和科学管理土地资源提供依据。以黑龙江宝清县平原区黑土地土壤为研究对象,综合选取31项评价指标作为全数据集(TDS),采用主成分分析(PCA)和相关性分析方法,确定不同土地利用类型的土壤质量评价的最小数据集(MDS)。利用地统计学方法,基于普通克里格插值法绘制土壤质量的空间分布图。结果表明,不同土地利用方式下的土壤质量存在明显差异,土壤质量整体表现为,草地>林地>旱地>水田。半变异函数为高斯函数的模型最适合预测土壤质量的空间分布。土壤质量在空间分布上呈现一定的规律性,越靠近北部挠力河流域,质量越好,大部分土壤质量处于中上水平,生产潜力较大。
Abstract:Soil quality evaluation is the key to the implementation of fine agricultural production and land scientific management. Evaluating the soil quality under different land use patterns and mapping its spatial distribution can provide a basis for optimizing the spatial layout of land use, objectively and accurately evaluating soil quality and scientifically managing land resources. In this study, the black soil in Baoqing Plain was taken as the research object, and 31 evaluation indexes were selected as the total data set (TDS). Principal component analysis (PCA) and correlation analysis were used to determine the minimum data set (MDS) of soil quality evaluation for different land use types. By using geostatistical methods, the spatial distribution map of soil quality was drawn based on the ordinary Kriging interpolation method. The results showed that there were significant differences in soil quality under different land use patterns. The overall performance of soil quality was grassland > forest land > dry land > paddy field. The model with Gaussian semi−variogram function was most suitable for predicting the spatial distribution of soil quality. The spatial distribution of soil quality showed a certain regularity. The closer to the northern Naoli River Basin, the better the soil quality. Most of the soil quality was in the middle and upper level, and the production potential was large.
-
Key words:
- black land /
- land use type /
- minimum data set /
- geostatistics /
- semi-variogram
-

-
表 1 适宜型隶属函数上、下界限取值
Table 1. The upper and lower bounds of the appropriate membership function
指标 粘粒含量/% 粉粒含量/% 砂粒含量/% 容重/(g·cm−3) pH 下限值 40 40 20 1.2 6.5 上限值 55 55 50 1.4 7.5  下载: 导出CSV
表 2 土壤质量评价指标描述性统计特征
Table 2. Descriptive statistical characteristics of soil quality evaluation indexes
指标 平均值 中位数 标准差 最小值 最大值 变异系数 偏度 峰度 粘粒/% 31.46 31.00 8.76 4.00 52.00 0.28 0.05 −0.26 粉粒/% 41.90 43.00 8.45 3.00 59.00 0.20 −1.07 1.99 砂粒/% 26.64 24.00 12.45 5.00 93.00 0.47 1.77 4.85 毛管孔隙/% 41.47 41.64 5.60 26.15 62.95 0.14 0.44 0.95 非毛管孔隙/% 8.73 7.83 4.42 2.11 26.03 0.51 1.01 1.04 黑土层厚度/cm 52.48 50.00 30.17 0.00 175.00 0.57 1.02 1.22 含水率/% 31.67 29.86 9.14 15.24 80.82 0.29 1.54 3.88 比重 2.54 2.54 0.08 2.32 2.73 0.03 0.02 −0.23 容重/(g·cm−3) 1.18 1.19 0.17 0.76 1.57 0.15 −0.13 −0.55 高程/m 83.09 73.54 24.27 53.99 250.08 0.29 1.78 6.60 坡度/° 1.08 0.40 1.55 0.05 10.82 1.43 3.20 13.47 全碳/(mg·kg−1) 2.93 2.69 1.31 0.85 11.30 0.45 2.83 13.28 有机质/(g·kg−1) 47.57 43.79 22.22 13.96 192.74 0.47 2.99 14.64 全氮/(g·kg−1) 2.23 1.97 0.99 0.62 7.80 0.45 2.41 8.95 全磷/(g·kg−1) 0.83 0.78 0.25 0.40 1.95 0.30 1.50 3.13 全钾/(g·kg−1) 19.20 19.20 1.44 14.20 24.00 0.07 −0.07 1.57 碱解氮/(mg·kg−1) 205.41 196.10 81.29 52.00 618.10 0.40 1.89 6.33 速效钾/(mg·kg−1) 231.33 218.00 87.67 73.00 566.00 0.38 0.66 0.15 有效磷/(mg·kg−1) 20.73 17.50 16.70 0.40 146.80 0.81 2.18 10.82 含盐量/(g·kg−1) 0.43 0.41 0.17 0.14 0.90 0.39 0.49 −0.24 阳离子交换量/
(cmol·kg−1)31.01 30.60 8.18 11.00 53.50 0.26 0.26 −0.43 pH 6.33 6.22 0.59 5.30 8.38 0.09 1.35 1.78 As/(mg·kg−1) 10.72 10.46 2.92 4.72 18.97 0.27 0.37 −0.44 Cr/(mg·kg−1) 67.68 67.30 10.71 35.80 115.40 0.16 0.63 2.81 Cu/(mg·kg−1) 24.59 24.70 4.74 11.10 47.00 0.19 0.53 1.85 Cd/(mg·kg−1) 0.08 0.08 0.03 0.03 0.18 0.34 1.08 1.38 Hg/(mg·kg−1) 0.04 0.04 0.01 0.02 0.13 0.29 3.12 21.03 Mn/(mg·kg−1) 859.49 851.00 418.01 153.00 1784.00 0.49 0.13 −0.96 Ni/(mg·kg−1) 30.21 29.90 6.00 15.10 58.10 0.20 0.91 3.06 Pb/(mg·kg−1) 25.33 24.80 3.30 13.60 38.30 0.13 0.44 0.98 Zn/(mg·kg−1) 63.96 64.20 12.33 23.70 100.80 0.19 −0.16 0.11
下载: 导出CSV
表 3 水田土壤指标主成分分析结果及因子
Table 3. Principal component analysis results and factors of paddy soil index
指标 PC1 PC2 PC3 PC4 PC5 PC6 Norm值 全碳 0.871 0.363 0.178 −0.042 −0.088 −0.056 2.110 有机质 0.858 0.357 0.178 −0.050 −0.107 −0.068 2.082 阳离子交换量 0.604 0.143 0.620 0.183 0.127 0.133 1.788 全钾 −0.806 −0.146 0.139 −0.262 −0.027 −0.024 1.901 全氮 0.868 0.340 0.211 −0.065 −0.107 −0.021 2.103 全磷 0.755 −0.017 −0.041 −0.160 −0.016 0.145 1.735 含盐量 0.081 −0.117 0.814 0.109 0.023 −0.010 1.438 碱解氮 0.875 0.361 0.144 −0.054 −0.103 0.000 2.112 速效钾 0.223 −0.110 0.755 0.175 −0.182 0.122 1.456 有效磷 0.140 −0.103 0.180 0.176 0.056 0.621 0.900 pH −0.236 0.177 0.627 −0.005 0.401 −0.057 1.348 粘粒 0.131 0.132 0.530 0.509 −0.336 0.040 1.305 粉粒 −0.030 0.051 0.200 0.833 0.045 −0.068 1.265 砂粒 −0.063 −0.114 −0.453 −0.835 0.181 0.017 1.479 含水率 0.324 0.890 −0.068 0.087 −0.166 −0.014 1.824 比重 −0.331 −0.719 −0.068 0.015 −0.073 −0.048 1.535 容重 −0.268 −0.872 0.021 −0.085 −0.279 0.072 1.766 毛管孔隙 0.198 0.834 −0.066 0.045 −0.421 −0.015 1.696 黑土层厚度 0.077 −0.082 −0.041 0.279 0.264 −0.735 1.021 非毛管孔隙 −0.078 −0.072 −0.026 −0.041 0.850 −0.011 1.092 高程 −0.033 0.014 −0.413 −0.147 0.302 0.554 1.051 坡度 −0.199 −0.032 −0.236 0.349 0.051 −0.041 0.795 特征值 5.130 3.425 2.960 2.102 1.577 1.314 贡献率/% 23.320 15.568 13.455 9.553 7.166 5.973 累计贡献率/% 23.320 38.888 52.342 61.895 69.061 75.034
下载: 导出CSV
表 6 草地土壤指标主成分分析结果及因子
Table 6. Principal component analysis results and factors of grassland soil index
指标 PC1 PC2 PC3 PC4 PC5 PC6 PC7 Norm值 全碳 0.964 0.096 0.133 −0.020 −0.113 −0.069 0.049 2.223 有机质 0.960 0.082 0.147 −0.108 −0.093 −0.025 0.041 2.217 全钾 −0.640 0.108 0.350 −0.499 0.410 −0.040 −0.035 1.898 全氮 0.947 0.000 −0.138 −0.160 −0.124 −0.087 0.024 2.194 全磷 0.618 0.117 −0.475 0.312 −0.290 0.147 0.088 1.820 含盐量 −0.197 −0.244 0.864 0.076 0.032 0.105 −0.307 1.813 碱解氮 0.890 0.167 −0.079 0.399 −0.032 −0.013 0.033 2.152 速效钾 0.056 −0.002 −0.235 −0.908 0.046 0.167 −0.122 1.553 有效磷 −0.069 0.079 0.225 0.016 0.124 0.928 0.087 1.355 pH 0.017 0.083 0.981 0.039 0.016 0.021 0.108 1.866 粘粒 −0.034 −0.806 0.073 0.102 0.131 0.359 0.392 1.739 粉粒 −0.143 −0.048 −0.087 −0.104 0.211 −0.062 −0.948 1.371 砂粒 0.137 0.816 −0.007 −0.023 −0.280 −0.303 0.310 1.759 含水率 −0.005 0.928 −0.053 0.180 0.008 0.191 0.236 1.864 比重 −0.451 −0.172 −0.026 0.187 0.846 0.011 −0.058 1.676 容重 −0.182 −0.692 −0.290 0.367 0.369 −0.146 0.153 1.726 毛管孔隙 0.080 0.821 −0.425 0.208 −0.006 0.124 −0.026 1.824 黑土层厚度 0.061 0.196 0.330 0.286 0.414 −0.751 0.031 1.469 非毛管孔隙 0.530 −0.225 0.280 −0.521 −0.141 −0.042 −0.519 1.772 高程 0.111 0.327 0.032 0.326 −0.807 0.015 0.243 1.500 坡度 0.247 0.109 −0.586 0.681 −0.003 0.090 −0.011 1.669 阳离子交换量 0.378 −0.139 0.722 −0.045 −0.134 0.042 0.284 1.689 特征值 5.164 3.732 3.561 2.569 2.161 1.812 1.786 贡献率/% 23.472 16.964 16.184 11.677 9.824 8.236 8.116 累计贡献率/% 23.472 40.436 56.621 68.298 78.122 86.358 94.474
下载: 导出CSV
表 4 旱地土壤指标主成分分析结果及因子
Table 4. Principal component analysis results and factors of dryland soil index
指标 PC1 PC2 PC3 PC4 PC5 PC6 PC7 Norm值 全碳 0.915 0.190 0.105 0.171 −0.062 0.032 0.120 2.104 有机质 0.917 0.197 0.085 0.154 −0.071 0.033 0.076 2.103 阳离子交换量 0.528 0.567 0.228 0.161 −0.137 0.130 0.188 1.587 全钾 −0.490 0.405 −0.268 −0.016 0.152 −0.211 0.013 1.379 全氮 0.921 0.125 0.065 0.123 −0.172 0.032 0.022 2.102 全磷 0.782 −0.025 −0.019 0.072 0.025 −0.174 −0.003 1.772 含盐量 0.076 0.804 0.029 −0.059 −0.133 −0.096 0.030 1.338 碱解氮 0.895 0.056 0.121 0.107 −0.044 0.004 −0.064 2.028 速效钾 0.297 0.778 0.021 0.053 −0.085 0.033 0.007 1.437 有效磷 0.064 −0.042 0.153 0.045 −0.080 0.757 0.032 0.924 pH −0.158 0.576 −0.039 0.036 −0.196 0.095 0.395 1.129 粘粒 0.316 0.461 0.355 0.097 −0.462 0.015 −0.191 1.339 粉粒 0.007 −0.083 0.832 0.005 0.268 0.069 0.025 1.291 砂粒 −0.246 −0.296 −0.842 −0.078 0.170 −0.059 0.129 1.474 含水率 0.107 −0.003 0.265 0.589 −0.107 −0.371 −0.139 1.073 比重 −0.278 −0.231 −0.077 −0.602 0.173 −0.013 −0.166 1.172 容重 −0.250 0.093 0.001 −0.883 0.005 −0.105 −0.058 1.400 毛管孔隙 0.306 −0.221 0.474 0.176 −0.115 −0.476 0.316 1.264 黑土层厚度 0.093 0.128 −0.030 0.012 −0.047 −0.026 0.841 0.969 非毛管孔隙 −0.070 −0.007 −0.400 0.607 0.137 0.503 −0.203 1.245 高程 −0.198 −0.165 0.060 0.060 0.806 −0.059 −0.155 1.230 坡度 0.008 −0.114 0.040 −0.157 0.806 0.019 0.004 1.134 特征值 5.041 2.639 2.180 2.053 1.841 1.329 1.195 贡献率/% 22.914 11.996 9.910 9.330 8.370 6.040 5.432 累计贡献率/% 22.914 34.910 44.820 54.150 62.520 68.560 73.992
下载: 导出CSV
表 5 林地土壤指标主成分分析结果及因子
Table 5. Principal component analysis results and factors of forest soil index
指标 PC1 PC2 PC3 PC4 PC5 Norm值 全碳 0.954 0.040 −0.004 0.224 0.089 2.380 有机质 0.947 0.000 −0.004 0.253 0.109 2.372 阳离子交换量 0.493 0.730 0.184 0.156 0.177 2.120 全钾 0.005 −0.204 −0.948 −0.059 −0.099 1.785 全氮 0.900 0.103 −0.120 0.335 −0.005 2.302 全磷 0.485 0.447 0.567 −0.266 −0.015 1.924 含盐量 0.405 0.799 0.301 0.113 0.126 2.166 碱解氮 0.964 −0.124 −0.011 −0.010 0.030 2.392 速效钾 0.391 0.891 0.122 0.010 −0.031 2.266 有效磷 0.086 −0.075 −0.017 −0.056 0.863 1.239 pH −0.157 0.746 0.009 0.092 −0.281 1.799 粘粒 0.043 0.757 −0.210 0.353 0.349 1.924 粉粒 0.447 0.141 −0.798 0.142 0.278 1.896 砂粒 −0.234 −0.597 0.511 −0.313 −0.372 1.887 含水率 0.445 −0.005 0.212 0.779 −0.032 1.692 比重 −0.751 −0.327 0.072 −0.257 −0.126 2.047 容重 −0.447 0.113 −0.463 −0.442 0.551 1.749 毛管孔隙 0.473 0.246 −0.069 0.789 0.043 1.802 黑土层厚度 −0.108 0.792 −0.086 −0.040 0.054 1.841 非毛管孔隙 −0.412 −0.360 0.094 −0.348 −0.610 1.663 高程 0.263 −0.689 0.219 0.320 0.009 1.820 坡度 0.020 −0.267 0.786 0.434 −0.095 1.698 特征值 6.065 5.230 3.269 2.496 1.949 贡献率/% 27.568 23.774 14.859 11.347 8.858 累计贡献率/% 27.568 51.342 66.200 77.548 86.405
下载: 导出CSV
表 7 最小数据集中土壤指标的公因子方差及权重
Table 7. Common factor variance and weight of soil index in minimum data set
土地利用类型 土壤指标 公因子方差 权重 水田 高程 0.579 0.196 非毛管孔隙 0.512 0.173 碱解氮 0.422 0.143 黑土层厚度 0.395 0.134 pH 0.469 0.159 砂粒 0.576 0.195 旱地 高程 0.511 0.162 全碳 0.692 0.220 速效钾 0.513 0.163 黑土层厚度 0.412 0.131 砂粒 0.413 0.131 容重 0.610 0.194 林地 碱解氮 0.611 0.172 速效钾 0.355 0.100 毛管孔隙 0.731 0.205 粉砂粒 0.922 0.259 容重 0.940 0.264 草地 全碳 0.904 0.327 速效钾 0.635 0.230 黑土层厚度 0.625 0.226 含水率 0.088 0.032 pH 0.508 0.184
下载: 导出CSV
表 8 土壤质量半变异函数参数
Table 8. Semi-variogram parameters of soil quality
函数类型 平均误差 均方根误差 标准化平均误差 平均标准误差 标准化均方根误差 指数 −4.589E-05 0.072 0.006 0.084 0.882 高斯 −6.024E-04 0.072 −0.003 0.082 0.899 球面 −4.558E-04 0.072 −0.005 0.083 0.895 三角 −5.543E-04 0.072 −0.006 0.083 0.897
下载: 导出CSV
-
[1] Armenise E, Redmile−Gordon M A, Stellacci A M, et al. 2013. Developing a soil quality index to compare soil fitness for agricultural use under different managements in the Mediterranean environment[J]. Soil and Tillage Research, 130: 91−98. doi: 10.1016/j.still.2013.02.013
[2] Abdel−Fattah M K, Mohamed E S, Wagdi E M, et al. 2021. Quantitative evaluation of soil quality using Principal Component Analysis: The case study of El−Fayoum depression Egypt[J]. Sustainability, 13(4): 1824. doi: 10.3390/su13041824
[3] Bünemann E K, Bongiorno G, Bai Z, et al. 2018. Soil quality–A critical review[J]. Soil Biology and Biochemistry, 120: 105−125. doi: 10.1016/j.soilbio.2018.01.030
[4] Chandel S, Hadda M S, Mahal A K. 2018. Soil quality assessment through minimum data set under different land uses of submontane Punjab[J]. Communications in Soil Science and Plant Analysis, 49(6): 658−674. doi: 10.1080/00103624.2018.1425424
[5] Deng S H, Zeng L T, Guan Q, et al. 2016. Minimum dataset−based soil quality assessment of waterlogged paddy field in South China[J]. Acta Pedologica Sinica, 53(5): 1326−1333 (in Chinese with English abstract).
[6] Gong L, Zhang X N, Ran Q Y. 2015. Quality assessment of oasis soil in the upper reaches of Tarim River based on minimum data set[J]. Acta Pedologica Sinica, 52(3): 682−689 (in Chinese with English abstract).
[7] Hani A, Pazira E, Manshouri M, et al. 2010. Spatial distribution and mapping of risk elements pollution in agricultural soils of southern Tehran, Iran[J]. Plant, Soil and Environment, 56(6): 288−296.
[8] Han X Z, Li N. 2018a. Research progress of black soil in Northeast China[J]. Scientia Geographica Sinica, 38(7): 1032−1041 (in Chinese with English abstract).
[9] Han X Z, Zhou W X. 2018b. Effects and suggestions of black soil protection and soil fertility increase in Northeast China[J]. Bulletin of Chinese Academy of Sciences, 33(2): 206−212 (in Chinese with English abstract).
[10] Jiang M, Xu L, Chen X, et al. 2020. Soil quality assessment based on a minimum data set: a case study of a county in the typical river delta wetlands[J]. Sustainability, 12(21): 9033. doi: 10.3390/su12219033
[11] Li G L, Chen J, Tan M Z, et al. 2008. Establishment of a minimum dataset for soil quality assessment based on land use change[J]. Acta Pedologica Sinica, (1): 16−25 (in Chinese with English abstract).
[12] Li X, Li H, Yang L, et al. 2018. Assessment of soil quality of croplands in the Corn Belt of Northeast China[J]. Sustainability, 10(1): 248. doi: 10.3390/su10010248
[13] Lou Y B, Shi D M, Jiang G Y, et al. 2019. Evaluation of soil quality in the cultivated−layer of sloping farmland in purple hilly area based on minimum data set[J]. Science of Soil and Water Conservation, 17(5): 75−85 (in Chinese with English abstract).
[14] Liao C, Wang D W, Tang L, et al. 2021. Construction of soil nutrient comprehensive evaluation system based on minimum data set in Chengdu Plain[J]. Earth and Environment, 49(2): 189−197 (in Chinese with English abstract).
[15] Li B Y, Li H, Guo X N, et al. 2021. Evaluation of soil quality of cultivated land in Ningxia area based on minimum data set[J]. Jiangsu Agricultural Sciences, 49(9): 195−201 (in Chinese with English abstract).
[16] Ministry of Ecology and Environment. 2018. Soil environmental quality risk control standard for soil contamination of agricultural land (Trial)(GB 15618-2018)[S]. Beijing: China Environment Press (in Chinese).
[17] Mei N, Gu Y, Li D Z, et al. 2021. Soil quality evaluation in topsoil layer of black soil in Jilin Province based on minimum data set[J]. Transactions of the Chinese Society of Agricultural Engineering, 37(12): 91−98 (in Chinese with English abstract).
[18] Miao S J, Zhao H F, Qiao Y F, et al. 2019. Assessment of tillage effects on soil quality for aeolian sandy soil in northeast China with tilth index[J]. Soil and Fertilizer Sciences in China, (4): 9−15 (in Chinese with English abstract).
[19] Mulat Y, Kibret K, Bedadi B, et al. 2021. Soil quality evaluation under different land use types in Kersa sub−watershed, eastern Ethiopia[J]. Environmental Systems Research, 10: 1−11. doi: 10.1186/s40068-020-00196-z
[20] National Soil Survey Office. 1998. Chinese Soil[M]. Beijing: China Agricultural Press (in Chinese).
[21] Song Y H, Yang F C, Liu K, et al. 2022. A multivariate statistical analysis of the distribution and influencing factors of heavy metal elements in the cultivated land of the Sanjiang Plain[J]. Geophysical and Geochemical Exploration, 46(5): 1064−1075 (in Chinese with English abstract).
[22] Tan M Z, Mi S X, Li K L, et al. 2011. Influence of elevation factor on soil profile texture configuration: a case study of the alluvial plain of Fengqiu County[J]. Acta Ecologica Sinica, 31(8): 2060−2067 (in Chinese with English abstract).
[23] Tan Y, Chen H, Lian K, et al. 2020. Comprehensive evaluation of cultivated land quality at county scale: A case study of Shengzhou, Zhejiang Province, China[J]. International Journal of Environmental Research and Public Health, 17(4): 1169. doi: 10.3390/ijerph17041169
[24] Wang X, Gong Z. 1998. Assessment and analysis of soil quality changes after eleven years of reclamation in subtropical China[J]. Geoderma, 81(3/4): 339−355. doi: 10.1016/S0016-7061(97)00109-2
[25] Wang S H, Tian Y. 2003. Preliminary research on groundwater table change and causes in San−jiang Plain[J]. Journal of Irrigation and Drainage, (2): 61−64 (in Chinese with English abstract).
[26] Wang Y Y, Yang Z F, Yu T. 2011. Research progress of soil quality evaluation[J]. Journal of Anhui Agricultural Sciences, 39(36): 22617−22622, 22657 (in Chinese with English abstract).
[27] Wu H Y, Jin R D, Fan Z W, et al. 2018. Assessment of fertility quality of black soil based on principal component and cluster analysis[J]. Journal of Plant Nutrition and Fertilizers, 24(2): 325−334 (in Chinese with English abstract).
[28] Wang W W, Zhu W Z, Li X, et al. 2021. Soil quality assessment of typical vegetation in dry and warm valley of Dadu River based on minimum data set[J]. Science of Soil and Water Conservation, 19(6): 54−59 (in Chinese with English abstract).
[29] Xi X H, Chen G G, Zhang D C, et al. 2014. Specification of Multi-Purpose Regional Geochemical Survey (1:
250000 ) (DZ/T0258-2014)[S]. Beijing: Standards Press of China (in Chinese).[30] Xu M X. 2003. Soil quality evolvement mechanism in the process of ecosystem restoration and its management in Loess hilly−gully region[D]. PhD Thesis of Northwest A&F University: 60−72. (in Chinese with English abstract).
[31] Yang Z F, Yu T, Li M, et al. 2016. Specification of land quality geochemical assessment(DZ/T0295-2016)[S]. Beijing: Geological Press (in Chinese).
[32] Yang L M, Li X Y, Ren Y X, et al. 2019. Soil quality evaluation of cultivated land in Changchun City based on minimum dataset[J]. Jiangsu Agricultural Sciences, 47(20): 305−310 (in Chinese with English abstract).
[33] Yang Z Q, Qin F C, Yu X J, et al. 2019. Construction of artificial forest soil quality evaluation indices in the feldspathic sandstone region based on minimum data set[J]. Chinese Journal of Soil Science, 50(5): 1072−1078 (in Chinese with English abstract).
[34] Yin M, Wang S M, Ye J Y, et al. 2006. The specification of testing quality management for geological laboratories(DZ/T 0130-2006)[S]. Beijing: Standards Press of China (in Chinese).
[35] Zhang J, He C, Chen L, et al. 2018. Improving food security in China by taking advantage of marginal and degraded lands[J]. Journal of Cleaner Production, 171: 1020−1030. doi: 10.1016/j.jclepro.2017.10.110
[36] Zhang F P, Gao Z, Li X J, et al. 2019. Soil quality assessment of kiwifruit field using MDS method in Zhouzhi County[J]. Journal of Ecology and Rural Environment, 35(1): 69−75 (in Chinese with English abstract).
[37] Zhao Q G, Sun B, Zhang T L. 1997. Soil quality and sustainable environment I. Definition and evaluation method of soil quality[J]. Soils, (3): 113−120 (in Chinese).
[38] Zhuo Z Q, Li Y, Gou Y X, et al. 2021. Quality evaluation and obstacle diagnosis of plough horizon based on minimum data set in dry farming region of Northeast China[J]. Transactions of the Chinese Society for Agricultural Machinery, 52(9): 321−330 (in Chinese with English abstract).
[39] 邓绍欢, 曾令涛, 关强, 等. 2016. 基于最小数据集的南方地区冷浸田土壤质量评价[J]. 土壤学报, 53(5): 1326−1333.
[40] 贡璐, 张雪妮, 冉启洋. 2015. 基于最小数据集的塔里木河上游绿洲土壤质量评价[J]. 土壤学报, 52(3): 682−689.
[41] 韩晓增, 李娜. 2018a. 中国东北黑土地研究进展与展望[J]. 地理科学, 38(7): 1032−1041.
[42] 韩晓增, 邹文秀. 2018b. 我国东北黑土地保护与肥力提升的成效与建议[J]. 中国科学院院刊, 33(2): 206−212.
[43] 李桂林, 陈杰, 檀满枝, 等. 2008. 基于土地利用变化建立土壤质量评价最小数据集[J]. 土壤学报, (1): 16−25. doi: 10.3321/j.issn:0564-3929.2008.01.003
[44] 娄义宝, 史东梅, 蒋光毅, 等. 2019. 基于最小数据集的紫色丘陵区坡耕地耕层土壤质量评价[J]. 中国水土保持科学, 17(5): 75−85.
[45] 廖程, 王德伟, 唐亮, 等. 2021. 基于最小数据集的成都平原某区土壤养分综合评价体系的构建[J]. 地球与环境, 49(2): 189−197.
[46] 李百云, 李慧, 郭鑫年, 等. 2021. 基于最小数据集的宁夏耕地土壤质量评价[J]. 江苏农业科学, 49(9): 195−201.
[47] 苗淑杰, 赵红飞, 乔云发, 等. 2019. 基于耕作指数评价耕作措施对东北风沙土耕层土壤质量的影响[J]. 中国土壤与肥料, (4): 9−15.
[48] 梅楠, 谷岩, 李德忠, 等. 2021. 基于最小数据集的吉林省黑土耕层土壤质量评价[J]. 农业工程学报, 37(12): 91−98.
[49] 全国土壤普查办公室. 1998. 中国土壤[M]. 北京: 中国农业出版社.
[50] 生态环境部. 2018.《土壤环境质量 农用地土壤污染风险管控标准(试行)》(GB 15618—2018)[S]. 北京: 中国环境出版社.
[51] 宋运红, 杨凤超, 刘凯, 等. 2022. 三江平原耕地土壤重金属元素分布特征及影响因素的多元统计分析[J]. 物探与化探, 46(5): 1064−1075.
[52] 檀满枝, 密术晓, 李开丽, 等. 2011. 冲积平原区高程因子对土壤剖面质地构型的影响——以封丘县为例[J]. 生态学报, 31(8): 2060−2067.
[53] 王韶华, 田园. 2003. 三江平原地下水埋深变化及成因的初步分析[J]. 灌溉排水学报, (2): 61−64. doi: 10.3969/j.issn.1672-3317.2003.02.016
[54] 汪媛媛, 杨忠芳, 余涛. 2011. 土壤质量评价研究进展[J]. 安徽农业科学, 39(36): 22617−22622, 22657. doi: 10.3969/j.issn.0517-6611.2011.36.154
[55] 吴海燕, 金荣德, 范作伟, 等. 2018. 基于主成分和聚类分析的黑土肥力质量评价[J]. 植物营养与肥料学报, 24(2): 325−334. doi: 10.11674/zwyf.17225
[56] 王文武, 朱万泽, 李霞, 等. 2021. 基于最小数据集的大渡河干暖河谷典型植被土壤质量评价[J]. 中国水土保持科学, 19(6): 54−59.
[57] 许明祥. 2003. 黄土丘陵区生态恢复过程中土壤质量演变及调控[D]. 西北农林科技大学博士学位论文: 60−72.
[58] 奚小环, 陈国光, 张德存, 等. 2014. 《多目标区域地球化学调查规范(1∶250 000)》(DZ/T0258—2014)[S]. 北京: 中国标准出版社.
[59] 尹明, 王苏明, 叶家喻, 等. 2006. 《地质矿产实验室测试质量管理规范》(DZ/T 0130—2006)[S]. 北京: 中国标准出版社.
[60] 杨忠芳, 余涛, 李敏, 等. 2016. 《土地质量地球化学评价规范》(DZ/T0295—2016)[S]. 北京: 地质出版社.
[61] 杨黎敏, 李晓燕, 任永星, 等. 2019. 基于最小数据集的长春市耕地土壤质量评价[J]. 江苏农业科学, 47(20): 305−310.
[62] 杨振奇, 秦富仓, 于晓杰, 等. 2019. 基于最小数据集的砒砂岩区人工林地土壤质量评价指标体系构建[J]. 土壤通报, 50(5): 1072−1078.
[63] 赵其国, 孙波, 张桃林. 1997. 土壤质量与持续环境Ⅰ. 土壤质量的定义及评价方法[J]. 土壤, (3): 113−120. doi: 10.3321/j.issn:0253-9829.1997.03.001
[64] 张福平, 高张, 李肖娟, 等. 2019. 基于最小数据集的周至县猕猴桃园地土壤质量评价[J]. 生态与农村环境学报, 35(1): 69−75.
[65] 卓志清, 李勇, 勾宇轩, 等. 2021. 基于最小数据集的东北旱作区耕层质量评价与障碍诊断[J]. 农业机械学报, 52(9): 321−330. doi: 10.6041/j.issn.1000-1298.2021.09.036
-


图(6)
表(8)
计量
- 文章访问数: 251
- PDF下载数: 60
- 施引文献: 0