

-
摘要:
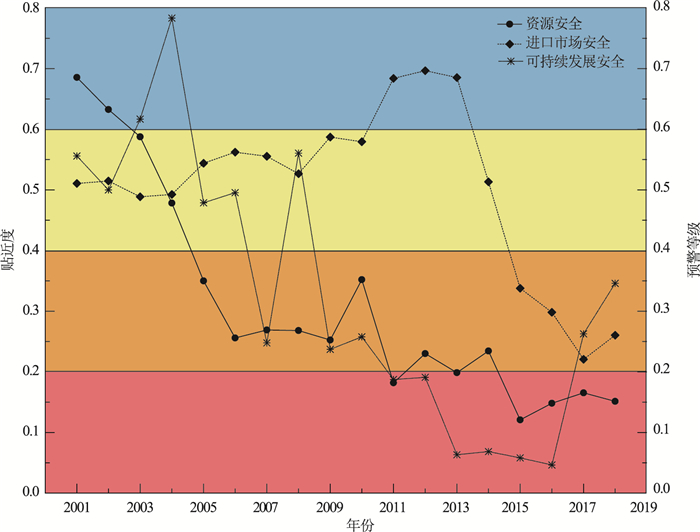
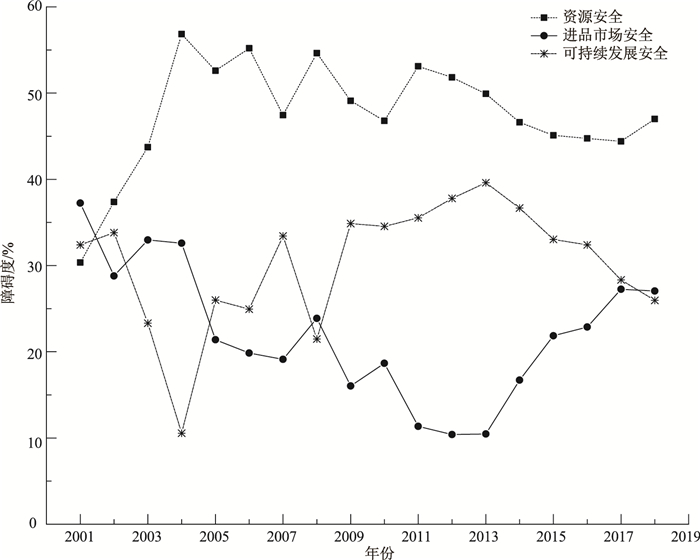
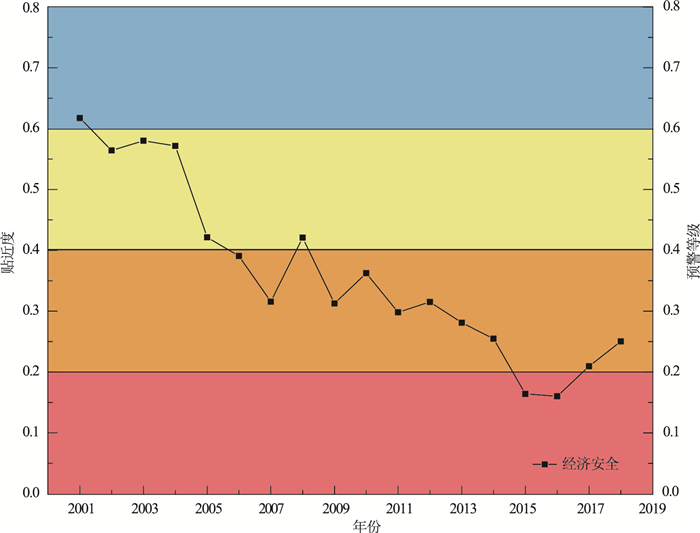
铁矿是中国重要的战略矿产资源,其经济安全关乎国民经济社会发展全局。为深入研究中国铁矿资源经济安全,从资源、进口市场、可持续发展3个层面出发,构建了中国铁矿资源经济安全评价指标体系,运用改进的TOPSIS法、障碍度模型和GM(1, 1)-BP组合模型实现对2001—2018年中国铁矿资源经济安全的评价、主要障碍因子分析及2020—2025年铁矿资源经济安全预警。结果表明:①2001—2018年,中国铁矿资源经济安全水平总体呈先降后升趋势,安全预警等级经历了蓝色预警—红色预警—橙色预警的变化过程; ②一级指标中,资源安全贴近度呈波动下降趋势,进口市场安全贴近度先升后降,可持续发展安全贴近度处于不断波动下降,但2016年之后又急剧上升趋势; ③影响铁矿资源经济安全的主要障碍因子为储采比、探明储量增量、勘查投入增长率、资源回收利用率和资源相对丰度; ④2020—2025年中国铁矿资源经济安全贴近度呈下降趋势,安全预警等级由橙色预警上升至红色预警。
Abstract:Iron ore is an important strategic mineral resource, and its economic security is related to the overall situation of national economic and social development.In order to further study the economic security of iron ore resources in China, the evaluation index system of economic security of iron ore resources in China is constructed from three aspects of resources, import market and sustainable development.The improved TOPSIS method, obstacle degree model and GM(1, 1)-BP combination model are respectively used to evaluate the economic security of iron ore resources in China from 2001 to 2018, analyze the main obstacle factors and give early warning of the economic security of iron ore resources in 2020-2025.The results show that: ①From 2001 to 2018, the economic security level of iron ore resources in China showed a general trend of first decreasing and then increasing, and the security warning level experienced a change from blue warning to red warning and to orange warning; ②Among the first level indicators, the resource security closeness showed a fluctuating downward trend, the import market security closeness first increased and then decreased, and the sustainable development security closeness was in a fluctuating downward trend, but increased sharply after 2016;③The main obstacles affecting the economic security of iron ore resources are the reserve production ratio, the increment of proven reserves, the growth rate of exploration investment, the utilization rate of resource recovery and the relative abundance of resources; ④From 2020 to 2025, the economic security closeness of iron ore resources in China will show a downward trend, and the security warning level will rise from orange warning to red warning.
-

-
表 1 铁矿资源经济安全评价指标体系
Table 1. Economic security evaluation index system of iron ore resources
目标层 一级指标 二级指标 指标计算 属性 铁矿资源经济安全 资源安全 储采比X1 铁矿石储量/铁矿石产量 + 探明储量增量X2 当年铁矿石探明储量-上年铁矿石探明储量 + 资源相对丰度X3 国内人均铁矿石储量/世界人均铁矿石储量 + 进口市场安全 进口集中度X4 铁矿石进口量最多的前四位国家(地区)进口量之和/铁矿石总进口量 - 对外依存度X5 铁矿石净进口量/铁矿石消费量 - 价格波动率X6 (当年进口均价-上年进口均价)/上年进口均价 - 地缘政治风险X7 ∑(各进口国来源国进口份额)2×对应国家风险指数 - 可持续发展安全 勘查投入增长率X8 (当年地质勘查投入-上年地质勘查投入)/上年地质勘查投入 + 资源回收利用率X9 废钢回收利用量/粗钢总产量 + 注:资源相对丰度指标中,中国及世界铁矿石储量按含铁量进行计算; 资源回收利用率的计算考虑了废钢作为钢铁工业再生资源、铁矿石良好替代原料的重要特性  下载: 导出CSV
表 2 预警等级划分标准
Table 2. Classification standard of early warning level
贴近度C 安全状态 预警等级 [0, 0.2] 不安全 红色预警 (0.2, 0.4] 较不安全 橙色预警 (0.4, 0.6] 临界安全 黄色预警 (0.6, 0.8] 较安全 蓝色预警 (0.8, 1.0] 安全 绿色预警
下载: 导出CSV
表 3 2001—2018年中国铁矿资源经济安全评价指标标准化
Table 3. Standardization of economic security evaluation index of iron ore resources in China from 2001 to 2018
年份 X1 X2 X3 X4 X5 X6 X7 X8 X9 2001 1.0000 0.0807 1.0000 0.0000 1.0000 0.6574 0.3830 0.2127 1.0000 2002 0.8845 0.0845 0.6204 0.0716 0.9525 0.7397 0.3494 0.1631 0.7899 2003 0.7613 0.0885 0.6527 0.1337 0.9074 0.4237 0.3452 0.4302 0.8682 2004 0.6176 0.2571 0.0583 0.3710 0.7749 0.0000 0.4849 1.0000 0.6594 2005 0.4302 0.1550 0.1428 0.3578 0.7885 0.6003 0.4274 0.4436 0.5164 2006 0.2687 0.2586 0.1747 0.3851 0.7992 0.7055 0.4171 0.6119 0.3691 2007 0.2082 0.1783 0.5798 0.4672 0.7832 0.3787 0.4655 0.2310 0.2648 2008 0.1790 0.2218 0.6157 0.4449 0.6541 0.2431 0.5891 0.9178 0.2348 2009 0.1235 0.3594 0.5282 0.4931 0.4442 1.0000 0.7171 0.2434 0.2302 2010 0.0839 1.0000 0.0000 0.6320 0.5181 0.1937 0.8213 0.3160 0.1831 2011 0.0152 0.2969 0.4117 0.8803 0.4916 0.4609 1.0000 0.2185 0.1483 2012 0.0179 0.4560 0.4442 0.9187 0.4383 0.8428 0.8904 0.2670 0.0643 2013 0.0000 0.3660 0.4177 1.0000 0.4545 0.6680 0.8172 0.0893 0.0036 2014 0.0050 0.6040 0.1192 0.6486 0.2166 0.8515 0.5991 0.0939 0.0214 2015 0.0218 0.1927 0.2546 0.2815 0.1362 0.9860 0.1438 0.0822 0.0000 2016 0.0307 0.0000 0.4494 0.3592 0.0464 0.7205 0.1863 0.0475 0.0452 2017 0.0329 0.2020 0.4205 0.3199 0.0000 0.4737 0.0857 0.0000 0.4236 2018 0.1417 0.1479 0.2006 0.2627 0.1486 0.6820 0.0000 0.0626 0.5616
下载: 导出CSV
表 4 指标权重计算结果
Table 4. Index weight calculation results
评价指标 主观权重 客观权重 组合权重 X1 0.1964 0.2427 0.2190 X2 0.1309 0.1080 0.1193 X3 0.1091 0.0827 0.0953 X4 0.0698 0.0759 0.0730 X5 0.0803 0.0803 0.0806 X6 0.0496 0.0479 0.0489 X7 0.0731 0.0714 0.0725 X8 0.1552 0.1415 0.1486 X9 0.1358 0.1496 0.1429
下载: 导出CSV
表 5 2001—2018年中国铁矿资源经济安全二级指标主要障碍因子障碍度
Table 5. Obstacle degree of main obstacle factors for second-level indicators of economic security of iron ore resources in China from 2001 to 2018
% 年份 指标排序 1 2 3 4 5 2001 X8(32.40) X2(30.36) X4(20.22) X7(12.38) X6(4.64) 2002 X8(27.24) X2(23.92) X4(14.25) X7(10.33) X3(7.92) 2003 X2(24.49) X8(19.08) X4(14.25) X1(11.78) X7(10.69) 2004 X3(19.46) X2(19.22) X1(18.16) X6(10.60) X9(10.56) 2005 X1(21.36) X2(17.26) X8(14.16) X3(13.98) X9(11.84) 2006 X1(27.02) X9(15.21) X2(14.92) X3(13.26) X8(9.73) 2007 X1(26.42) X8(17.41) X9(16.01) X2(14.93) X3(6.10) 2008 X1(31.76) X9(19.33) X2(16.40) X4(7.16) X6(6.54) 2009 X1(30.08) X8(17.62) X9(17.25) X2(11.97) X3(7.04) 2010 X1(31.72) X9(18.47) X8(16.07) X3(15.06) X6(6.23) 2011 X1(32.21) X9(18.19) X8(17.35) X2(12.53) X3(8.37) 2012 X1(33.48) X9(20.82) X8(16.96) X2(10.10) X3(8.24) 2013 X1(31.23) X9(20.31) X8(19.30) X2(10.78) X3(7.91) 2014 X1(29.10) X9(18.69) X8(17.99) X3(11.21) X5(8.43) 2015 X1(25.33) X9(16.90) X8(16.13) X2(11.39) X3(8.40) 2016 X1(24.73) X8(16.49) X9(15.90) X2(13.90) X5(8.95) 2017 X1(25.97) X8(18.23) X2(11.67) X9(10.11) X5(9.88) 2018 X1(24.15) X8(17.90) X2(13.06) X3(9.79) X9(8.05) 注:括号内数值表示障碍度
下载: 导出CSV
表 6 GM(1, 1)模型与GM(1, 1)-BP组合模型预测结果对比
Table 6. Comparison of prediction results between GM(1, 1)model and GM(1, 1)-BP combination model
年份 经济安全贴近度 GM(1, 1)模型 BP神经网络模型残差预测 GM(1, 1)- BP组合模型预测值 GM(1, 1)模型预测相对误差/% GM(1, 1)-BP组合模型预测相对误差/% 预测值 残差 2001 0.6175 0.6175 0.0000 0.00 2002 0.5640 0.5785 -0.0145 2.57 2003 0.5800 0.5380 0.0420 7.24 2004 0.5716 0.5004 0.0712 12.46 2005 0.4212 0.4654 -0.0442 10.49 2006 0.3908 0.4329 -0.0421 -0.0422 0.3907 10.77 0.02 2007 0.3157 0.4026 -0.0869 -0.0861 0.3165 27.53 0.24 2008 0.4209 0.3745 0.0464 0.0464 0.4209 11.02 0.00 2009 0.3127 0.3483 -0.0356 -0.0356 0.3127 11.38 0.02 2010 0.3624 0.3240 0.0384 0.0385 0.3625 10.60 0.02 2011 0.2981 0.3013 -0.0032 -0.0032 0.2981 1.07 0.00 2012 0.3151 0.2803 0.0348 0.0347 0.3150 11.04 0.02 2013 0.2809 0.2607 0.0202 0.0202 0.2809 7.19 0.01 2014 0.2548 0.2425 0.0123 0.0123 0.2548 4.83 0.01 2015 0.1641 0.2255 -0.0614 -0.0614 0.1641 37.42 0.00 2016 0.1602 0.2097 -0.0495 -0.0495 0.1602 30.90 0.03 2017 0.2096 0.1951 0.0145 0.0145 0.2096 6.92 0.01 2018 0.2503 0.1815 0.0688 0.0672 0.2487 27.49 0.64 平均相对误差 12.83 0.08
下载: 导出CSV
表 7 2020—2025年中国铁矿资源经济安全预警结果
Table 7. Early warning results of economic security of iron ore resources in China from 2020 to 2025
年份 经济安全贴近度 预警等级 2020 0.2255 橙色预警 2021 0.1693 红色预警 2022 0.1580 红色预警 2023 0.1336 红色预警 2024 0.1254 红色预警 2025 0.1219 红色预警
下载: 导出CSV
-
[1] 赵文报, 李英. "走出去"化解钢铁行业产能过剩问题研究[J]. 河北经贸大学学报, 2018, 39(2) : 78-86. https://www.cnki.com.cn/Article/CJFDTOTAL-HBJM201802012.htm
[2] 王勋, 韩跃新, 李艳军, 等. 钒钛磁铁矿综合利用研究现状[J]. 金属矿山, 2019, (6) : 33-37. https://www.cnki.com.cn/Article/CJFDTOTAL-JSKS201906006.htm
[3] 张泾生. 我国铁矿资源开发利用现状及发展趋势[J]. 钢铁, 2007, (2) : 1-6. https://www.cnki.com.cn/Article/CJFDTOTAL-GANT200702000.htm
[4] 张艳飞, 陈其慎, 于汶加, 等. 2015—2040年全球铁矿石供需趋势分析[J]. 资源科学, 2015, 37(5) : 921-932. https://www.cnki.com.cn/Article/CJFDTOTAL-ZRZY201505009.htm
[5] Ma Y. Iron ore spot price volatility and change in forward pricing mechanism[J]. Resources Policy, 2013, 38(4) : 621-627. doi: 10.1016/j.resourpol.2013.10.002
[6] Wårell L. The effect of a change in pricing regime on iron ore prices[J]. Resources Policy, 2014, 41: 16-22. doi: 10.1016/j.resourpol.2014.02.002
[7] 朱永光, 徐德义, 成金华, 等. 国际铁矿石贸易空间互动过程及中国进口策略分析[J]. 资源科学, 2017, 39(4) : 664-677. https://www.cnki.com.cn/Article/CJFDTOTAL-ZRZY201704008.htm
[8] Hao X, An H, Sun X, et al. The import competition relationship and intensity in the international iron ore trade: from network perspective[J]. Resources Policy, 2018, 57: 45-54. doi: 10.1016/j.resourpol.2018.01.005
[9] Zhang L, Bai W, Yu J, et al. Critical mineral security in China: an evaluation based on hybrid MCDM methods[J]. Sustainability, 2018, 10(11) : 4114. doi: 10.3390/su10114114
[10] 吴新春. 中国铁矿石资源供应安全研究[D]. 武汉理工大学博士学位论文, 2011.
[11] Huang J, Liu J, Zhang H, et al. Sustainable risk analysis of China's overseas investment in iron ore[J]. Resources Policy, 2020, 68: 101771. doi: 10.1016/j.resourpol.2020.101771
[12] 贺喜, 张举钢, 周吉光, 等. 河北省铁矿资源保障能力分析[J]. 地球学报, 2013, 34(6) : 731-737. https://www.cnki.com.cn/Article/CJFDTOTAL-DQXB201306012.htm
[13] 刘贤信. 基于SPSS的我国铁矿石供应安全评价[J]. 金属矿山, 2010(10) : 34-37. https://www.cnki.com.cn/Article/CJFDTOTAL-JSKS201010013.htm
[14] 王贵成. 我国铁矿资源安全现状综合评价[J]. 矿业研究与开发, 2011, 31(5) : 121-124. https://www.cnki.com.cn/Article/CJFDTOTAL-KYYK201105035.htm
[15] 范松梅, 沙景华, 闫晶晶, 等. 中国铁矿石资源供应风险评价与治理研究[J]. 资源科学, 2018, 40(3) : 507-515. https://www.cnki.com.cn/Article/CJFDTOTAL-ZRZY201803006.htm
[16] Hou Y B, Yang J. Application of rough fuzzy neural network in iron ore import risk early-warning[C]//Berlin Heidelberg: Advances in Neural Networks - ISNN 2010, 2010: 432-438.
[17] 闫军印, 齐阔. 区域矿产资源可供性评价及风险分析——以河北省铁矿资源为例[J]. 地质与勘探, 2018, 54(2) : 426-434. https://www.cnki.com.cn/Article/CJFDTOTAL-DZKT201802022.htm
[18] 王伯安, 张德胜. 中国石油经济安全评价指标体系设计[J]. 科学学与科学技术管理, 2010, (1) : 141-144. https://www.cnki.com.cn/Article/CJFDTOTAL-KXXG201001029.htm
[19] 张吉军. 论我国矿产资源经济安全[J]. 科技进步与对策, 2005, (3) : 44-46. https://www.cnki.com.cn/Article/CJFDTOTAL-KJJB200503014.htm
[20] 李宪海, 王丹, 吴尚昆. 我国战略性矿产资源评价指标选择: 基于美国、欧盟等关键矿产名录的思考[J]. 中国矿业, 2014, 23(4) : 30-33. https://www.cnki.com.cn/Article/CJFDTOTAL-ZGKA201404010.htm
[21] Gong C, Gong N, Qi R, et al. Assessment of natural gas supply security in Asia Pacific: composite indicators with compromise benefit- of-the-doubt weights[J]. Resources Policy, 2020, 67: 101671.
[22] 任晓娟, 范凤岩, 柳群义, 等. 中国铝土矿的供应安全评价[J]. 中国矿业, 2019, 28(7) : 52-59. https://www.cnki.com.cn/Article/CJFDTOTAL-ZGKA201907010.htm
[23] 蒋佐斌, 贺瑞, 张欢. 中国铁矿资源循环经济政策矩阵研究[J]. 生态经济, 2010, (6) : 78-81. https://www.cnki.com.cn/Article/CJFDTOTAL-STJJ201006021.htm
[24] 张会清. 中国铁矿石进口风险的量化评估——兼评进口多元化策略的成效[J]. 国际经贸探索, 2014, 30(1) : 44-56. https://www.cnki.com.cn/Article/CJFDTOTAL-GJTS201401004.htm
[25] 邵安林. 铁矿资源战略与矿冶工程管理——"五品联动"模式的工程哲学思考[J]. 科研管理, 2013, 34(8) : 158-164. https://www.cnki.com.cn/Article/CJFDTOTAL-KYGL201308019.htm
[26] 姚震, 黎江峰, 吴巧生, 等. 中国天然气资源安全态势分析[J]. 地质通报, 2018, 37(7) : 1374-1378. http://dzhtb.cgs.cn/gbc/ch/reader/view_abstract.aspx?file_no=20180721&flag=1
[27] 国土资源部矿产资源储量司. 2018年全国矿产资源储量通报[M]. 北京: 中华人民共和国国土资源部, 2019.
[28] 《中国钢铁工业年鉴》编辑委员会. 中国钢铁工业年鉴2002-2019[M]. 北京: 《中国钢铁工业年鉴》编辑部, 2002-2019.
[29] UNComtrade Database. Trade Statistics[EB/OL]. (2020-10-04)[2020-12-10]. https://comtrade.un.org/data.
[30] 中华人民共和国国家统计局. 国家数据[EB/OL]. (2020-10-15)[2020-11-20]. http://data.stats.gov.cn/easyquery.htm?cn=C01.
[31] 中华人民共和国国土资源部. 中国国土资源年鉴2001-2016[M]. 北京: 中国国土资源年鉴编辑部, 2001-2016.
[32] 中华人民共和国自然资源部. 中国矿产资源报告[EB/OL]. (2020-10-20)[2020-12-15]. http://www.mnr.gov.cn/sj/sjfw/kc_19263/zgkczybg/.
[33] 中华人民共和国国土资源部. 中国矿产资源年报[M]. 北京: 中华人民共和国国土资源部, 2016.
[34] BIR.Ferrous Metals[EB/OL].(2020-10-11)[2020-12-18]. https://www.bir.org/the-industry/ferrous-metals.
[35] U.S.Geological Survey.Mineral Commodity Summaries[EB/OL].(2020-10-17)[2020-12-20]. https://www.usgs.gov/centers/nmic/mineral-commodity-summaries.
[36] World Bank.World Population[EB/OL].(2020-10-15)[2020-11-30].https://data.worldbank.org.cn/indicator/SP.POP.TOTL.
[37] World Bank.Worldwide Governance Indicators[EB/OL].(2020- 10-15)[2020-11-30].https://databank.worldbank.org/reports.aspx?source=worldwide-governance-indicators.
[38] Hwang C L, Yoon K P. Multiple attribute decision making: methods and applications[M]. Berlin, Germany: Sprinter-Verlag, 1981.
[39] 徐美, 刘春腊, 李丹, 等. 基于改进TOPSIS-灰色GM(1, 1) 模型的张家界市旅游生态安全动态预警[J]. 应用生态学报, 2017, 28(11) : 3731-3739. https://www.cnki.com.cn/Article/CJFDTOTAL-YYSB201711032.htm
[40] 孙涵, 聂飞飞, 胡雪原. 基于熵权TOPSIS法的中国区域能源安全评价及差异分析[J]. 资源科学, 2018, 40(3) : 477-485. https://www.cnki.com.cn/Article/CJFDTOTAL-ZRZY201803003.htm
[41] 赵宏波, 马延吉. 东北粮食主产区耕地生态安全的时空格局及障碍因子——以吉林省为例[J]. 应用生态学报, 2014, 25(2) : 515-524. https://www.cnki.com.cn/Article/CJFDTOTAL-YYSB201402029.htm
[42] 韩锦辉, 赵文晋, 杨天通, 等. 基于改进TOPSIS法的东北农牧交错区土地可持续利用评价及障碍因子诊断[J]. 水土保持研究, 2018, 25(3) : 279-284, 291. https://www.cnki.com.cn/Article/CJFDTOTAL-STBY201803044.htm
[43] 陈福集, 史蕊. 基于残差修正的多因素灰色模型的网络舆情预测研究[J]. 情报科学, 2017, 35(9) : 131-135. https://www.cnki.com.cn/Article/CJFDTOTAL-QBKX201709021.htm
[44] 范中洲, 赵羿, 周宁, 等. 基于灰色BP神经网络组合模型的水上交通事故数预测[J]. 安全与环境学报, 2020, 20(3) : 857-861. https://www.cnki.com.cn/Article/CJFDTOTAL-AQHJ202003009.htm
[45] 徐美, 朱翔, 刘春腊. 基于RBF的湖南省土地生态安全动态预警[J]. 地理学报, 2012, 67(10) : 1411-1422. https://www.cnki.com.cn/Article/CJFDTOTAL-DLXB201210014.htm
[46] 闫金凯, 赵银鑫, 王志恒, 等. 银川市地下空间资源综合质量评价[J]. 地质通报, 2021, 40(10) : 1636-1643. http://dzhtb.cgs.cn/gbc/ch/reader/view_abstract.aspx?file_no=20211005&flag=1
-
图(3)
表(7)
计量
- 文章访问数: 2553
- PDF下载数: 134
- 施引文献: 0