

Investigation on the characteristics nutrient content and prediction of available nutrients content in the soil of Longhai, Fujian Province
-
摘要:
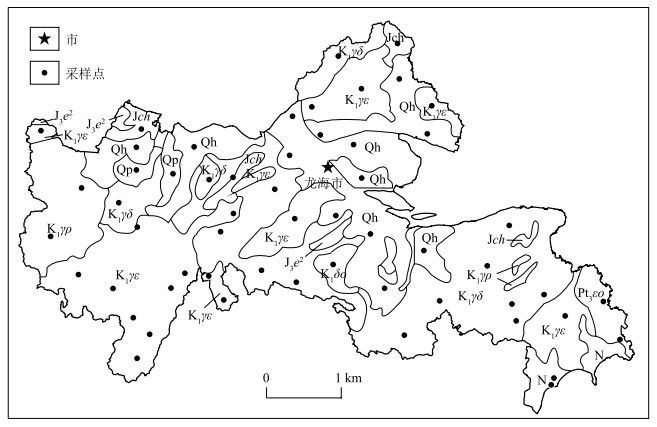
以福建龙海市为研究区,在不同地质背景、土地利用方式、土壤类型和土壤成因类型条件下进行样品采集,共采集56件土壤样品,测定pH值、有机质含量(SOM)、阳离子交换量(CEC)、营养元素全量及有效量。利用相关分析、线性回归分析等统计手段,探究土壤中营养元素有效量的影响因素,建立并验证了研究区土壤中营养元素有效量的预测模型,以此深入了解区内土壤养分状况,为该区土地的合理利用及治理提供科学依据。结果表明:龙海市土壤呈酸性—强酸性,有机质含量较低,阳离子交换量偏低;土壤中N、P、K、Mo、Zn元素全量相对富集;元素全量、有效量及其有效度变异性较强;土壤中B、Cu、K、Mn等营养元素全量与有效量相关性较好,土壤pH值对K、Mo、Si的有效度有一定影响,CEC与Si的有效度呈显著正相关,SOM增加有利于提高Cu、Fe、Mn、P、Zn等元素有效量。通过土壤全量分析数据及土壤理化指标建立的线性模型,可以预测表层土壤中Cu、Fe、Mo、Mo、P、S、Si等营养元素的有效量,若引入更多影响因子,将有利于进一步提高模型的拟合效果,使得预测更准确。
Abstract:In this study, samples were collected in Longhai City, Fujian, under different geological backgrounds, land use types, soil types, and soil formation conditions.A total of 56 soil samples were collected and analyzed for pH value, organic matter content(SOM), cation exchange capacity(CEC), total and available nutrient content.Statistical methods such as correlation analysis and linear regression analysis were used to explore the factors influencing the available nutrient content in the soil.A prediction model for the available nutrient content in the soil of the study area was established and validated.This study aims to gain a comprehensive understanding of the nutrient status of the soil in the area and provide scientific basis for the rational utilization and management of land in the region.The results show that in the study area, the soil in Longhai City is characterized by acidity to strong acidity, low organic matter content, and a relatively low cation exchange capacity.The soil shows relative enrichment of elements such as N, P, K, Mo, and Zn in terms of total quantity.There is also significant variability in the total quantity, available quantity, and effectiveness of these elements.The soil analysis data reveals good correlations between the total and available quantities of nutrients such as B, Cu, K, and Mn.The pH of the soil has a certain influence on the effectiveness of K, Mo, and Si, while the cation exchange capacity(CEC) shows a significant positive correlation with the effectiveness of Si.Increasing soil organic matter(SOM) is beneficial for improving the available quantities of elements such as Cu, Fe, Mn, P, and Zn.Linear models based on soil analysis data and soil physicochemical indicators can be used to predict the available quantities of nutrients such as Cu, Fe, Mo, P, S, and Si in the surface soil.Introducing more influencing factors would further improve the fitting effect of the models and enhance the accuracy of predictions.
-
Key words:
- Longhai, Fujian /
- soil /
- nutrient elements /
- geochemistry
-

-
表 1 土壤样品分类统计
Table 1. Classification statistics of soil samples
地质背景 样品数量 土地利用 样品数量 土壤类型 样品数量 成因 样品数量 第四系冲洪积 14 果园 16 红壤 37 残积土 30 第四系全新统玄武岩 1 旱地 22 水稻土 16 冲洪积 13 燕山期中酸性岩 34 林地 16 滨海沙泥 1 冲积 3 侏罗系火山岩 7 水田 2 潮土 1 坡-冲积 3 / / / / 黄壤 1 坡积物 7  下载: 导出CSV
表 2 表层土壤pH分布情况(n=56)
Table 2. Distribution characteristics of pH in surface soil(n=56)
指标 平均值 中位数 最大值 最小值 标准差 变异系数 各级样本数所占比例/% 强酸性 酸性 中性 碱性 pH 5.49 5.47 7.80 4.18 0.64 0.12 25.00 67.86 5.36 1.79
下载: 导出CSV
表 3 表层土壤有机质含量及分级统计(n=56)
Table 3. organic matter content and grading statistics in surface soil(n=56)
指标 平均值 中位数 最大值 最小值 标准差 变异系数 各级样本数所占比例/% 较丰富 中等 较缺乏 缺乏 SOM 1.89 1.69 3.98 0.27 0.83 0.44 10.71 26.79 50.00 12.50
下载: 导出CSV
表 4 表层土壤阳离子交换量含量及分级统计(n=56)
Table 4. Cation exchange content and grading statistics in surface soil(n=56)
指标 平均值 中位数 最大值 最小值 标准差 变异系数 各级样本数所占比例/% 丰富 较丰富 中等 较缺乏 缺乏 CEC 8.47 6.09 36.71 1.96 6.43 0.76 3.57 1.79 5.36 14.29 75.00 注:阳离子交换量含量单位为cmol/kg
下载: 导出CSV
表 5 表层土壤营养元素含量及变异系数(n=56)
Table 5. Nutrient content and coefficient of variation in surface soils(n=56)
元素 平均值 标准差 变异系数 中国土壤* 元素 平均值 标准差 变异系数 中国土壤* B 10.9 12.6 1.16 48.0 Mo 1.97 1.52 0.77 0.80 Ca 0.30 0.45 1.52 1.57 N 995 529 0.53 640 Cu 17.4 15.2 0.88 24.0 P 936 666 0.71 520 Fe 2.53 1.50 0.59 2.94 S 267 134 0.50 / K 2.23 1.09 0.49 1.91 Si 29.1 3.72 0.13 / Mg 0.26 0.29 1.12 0.78 Zn 78.4 46.6 0.59 68 Mn 475 268 0.56 600 / / / / / 注:常量元素Si、Al、Fe、Mg、Ca、Na、K含量单位为10-2,其他为10-6;*据《应用地球化学元素丰度数据手册》(迟清华等,2007)中国土壤化学元素含量(A层)算术均值
下载: 导出CSV
表 6 表层土壤元素有效量(n=56)
Table 6. Effective amount of surface soil elements(n=56)
有效态 平均值 最大值 最小值 标准差 变异系数 有效B 0.60 2.40 0.20 0.43 0.72 有效Cu 5.04 40.68 0.30 7.04 1.40 有效Fe 250 996 25 259 1.03 有效K 0.57 2.64 0.07 0.43 0.75 有效Mn 77 200 8 42.47 0.55 有效Mo 0.32 1.07 0.06 0.22 0.69 有效N 69.0 293 17.3 58.4 0.85 有效P 93.05 572 1.53 114 1.22 有效S 35.27 141.90 7.70 31.03 0.88 有效Si 0.13 0.54 0.03 0.10 0.75 有效Zn 13.19 122.02 1.60 21.40 1.62 注:有效K、有效Si含量系统为10-3,其他为10-6
下载: 导出CSV
表 7 表层土壤营养元素有效度平均值(n=56)
Table 7. Mean nutrient availability of nutrients in surface soil(n=56)
% 指标 B Cu Fe K Mn Mo N P S Si Zn 平均值 12.0 25.8 1.23 3.08 17.0 17.8 7.53 13.6 12.09 0.05 15.0 标准差 17.0 16.4 1.41 2.40 6.92 7.96 4.91 36.1 6.81 0.04 12.7 变异系数 1.42 0.64 1.14 0.78 0.41 0.45 0.65 2.65 0.56 0.86 0.85
下载: 导出CSV
表 8 表层土壤营养元素有效量与全量相关系数
Table 8. Correlation coefficients between the effective and full amounts of nutrient elements in surface soils
指标 全部样本 剔除离散点后 指标 全部样本 剔除离散点后 样本 R值 样本 R值 样本 R值 样本 R值 有效硼 56 0.333* 48 0.426** 有效氮 56 0.392** 48 0.416** 有效铜 56 0.759** 51 0.688** 有效磷 56 0.405** 50 0.559** 有效铁 56 0.018 50 0.175 有效硫 56 0.791** 52 0.713** 有效钾 56 0.252 53 0.414** 有效硅 56 -0.414** 53 -0.342* 有效锰 56 0.544** 52 0.637** 有效锌 56 0.674** 54 0.335* 有效钼 56 0.657** 51 0.603** / / / / / 注:**在0.01水平(双侧)上显著相关;*在0.05水平(双侧)上显著相关
下载: 导出CSV
表 9 元素有效度与土壤理化指标参数相关系数
Table 9. Correlation coefficients between elemental effectiveness and soil physical and chemical index parameters
指标 pH CEC SOM 指标 pH CEC SOM 有效B -0.245 -0.103 -0.207 有效N -0.130 0.179 -0.301* 有效Cu 0.051 -0.123 0.284* 有效P -0.256 0.225 0.277* 有效Fe 0.065 -0.084 0.297* 有效S -0.226 0.239 0.203 有效K 0.349** 0.148 0.056 有效Si 0.420** 0.741** 0.109 有效Mn 0.137 -0.021 0.330* 有效Zn 0.206 -0.165 0.393** 有效Mo 0.265* 0.071 0.219 / / / / 注:**在0.01水平(双侧)上显著相关;*在0.05水平(双侧)上显著相关
下载: 导出CSV
表 10 表层土壤营养元素有效态与全量及理化指标的线性关系
Table 10. Linear relationship between the effective state of nutrient elements in the surface soil and the full amount and physicochemical indexes
指标 线性回归方程 R* 有效B y=0.003x1 + 0.512 0.306 有效Cu y=4.327+0.340x1 +0.218x2+0.111x3+0.004x4 0.896 有效Fe y=-0.045-0.02x1+0.008x2+0.017x3 0.519 有效K y=-0.936+0.013x1+0.222x2+0.011x3-0.45x4 0.470 有效Mn y=-54.152+0.075x1+11.734x2-0.262x3+15.669x4 0.617 有效Mo y=-0.677+0.101x1+0.112x2+0.095x4 0.755 有效N y=127.948+0.067x1-18.046x2+3.154x3-28.105x4 0.572 有效P y=436.4+0.065x1-74.738x2-0.670x3+6.783x4 0.557 有效S y=2.792+0.193x1-3.104x2+0.667x3-4.185x4 0.799 有效Si y=-0.028+0.009x2+0.001x3-0.001x4 0.924 有效Zn y=-40.956+0.274x1+3.065x2-0.842x3+11.521x4 0.802 注:元素有效量单位为10-6;x1为指标对应的元素全量(Fe、K、Si为%,其余为10-6);x2为pH值(无量纲);x3为阳离子交换量(10-6);x4为有机质含量(%)
下载: 导出CSV
表 11 预测模型误差统计
Table 11. Statistics of prediction model errors
预测模型参数 误差范围/% 误差均值/% 有效B 19.09~47.76 32.39 有效Cu 10.78~25.95 18.25 有效Fe 13.06~45.87 31.39 有效K 21.09~38.35 30.63 有效Mn 22.46~35.68 29.31 有效Mo 15.16~28.62 23.74 有效N 21.36~32.95 26.78 有效P 19.36~30.48 25.43 有效S 12.38~27.66 19.73 有效Si 9.34~21.58 14.36 有效Zn 14.33~26.94 19.69
下载: 导出CSV
-
[1] 迟清华, 鄢明才. 应用地球化学元素丰度数据手册[M]. 北京: 地质出版社, 2007: 1-148.
[2] 丁文广, 魏银丽, 杨军梅, 等. 甘肃省中部干旱区植被恢复对土壤养分变化的影响研究[J]. 干旱区资源与环境, 2012, 26(1): 159-163. https://www.cnki.com.cn/Article/CJFDTOTAL-GHZH201201029.htm
[3] 董岩翔, 郑文. 浙江省北部地区土壤元素有效量研究[J]. 贵州地质, 2005, (3): 23-28. https://www.cnki.com.cn/Article/CJFDTOTAL-GZDZ200503003.htm
[4] 范宏迪, 付文进, 对三汗, 等. 博乐垦区土壤阳离子交换量水平分析与施肥建议[J]. 新疆农业科技, 2011, (3): 53. doi: 10.3969/j.issn.1007-3574.2011.03.054
[5] 姜冰, 王松涛, 孙增兵, 等. 山东省青州市土壤养分元素有效量及其影响因素[J]. 土壤, 2021, 53(6): 1221-1227. https://www.cnki.com.cn/Article/CJFDTOTAL-TURA202106016.htm
[6] 姜冰, 王松涛, 孙增兵, 等. 潍坊市土壤大量营养元素有效量及其影响因素[J]. 土壤, 2023, 55(1): 218-223. https://www.cnki.com.cn/Article/CJFDTOTAL-TURA202301027.htm
[7] 李学垣. 土壤化学[M]. 北京: 高等教学出版社, 2001.
[8] 李杨, 李明辉. 岳西-太湖地区土壤酸碱度分布特征及变化趋势[J]. 资源环境与工程, 2020, 34(3): 363-365, 431. https://www.cnki.com.cn/Article/CJFDTOTAL-HBDK202003010.htm
[9] 刘蓉, 邓茂, 李莹莹, 等. 不同酸碱度土壤阳离子交换量的测定研究[J]. 中国环境监测, 2020, 36(1): 125-130. https://www.cnki.com.cn/Article/CJFDTOTAL-IAOB202001022.htm
[10] 刘银飞, 孙彬彬, 贺灵, 等. 福建龙海土壤垂向剖面元素分布特征[J]. 物探与化探, 2016, 40(4): 713-721. https://www.cnki.com.cn/Article/CJFDTOTAL-WTYH201604013.htm
[11] 骆珊, 张德明, 卢定彪, 等. 乌蒙山区毕节市耕地土壤微量元素丰缺评价及其影响因素[J]. 地质通报, 2021, 40(9): 1570-1583. http://dzhtb.cgs.cn/gbc/ch/reader/view_abstract.aspx?file_no=20210916&flag=1
[12] 全国土壤普查办公室. 中国土壤普查技术[M]. 北京: 农业出版社, 1992: 1-243.
[13] 陶睿. 重庆市丰都县紫色土养分空间变异及土壤肥力评价[J]. 土壤通报, 2017, 49(1): 155-161. https://www.cnki.com.cn/Article/CJFDTOTAL-TURA201701023.htm
[14] 韦世勇. 广西桂平市土壤中元素的有效态研究[J]. 矿产与地质, 2017, 31(3): 564-569, 579. https://www.cnki.com.cn/Article/CJFDTOTAL-KCYD201703022.htm
[15] 武钦萍, 张廷元, 张洋, 等. 神府矿区复垦土地土壤微量元素有效性影响因素研究[J]. 水土保持研究, 2012, 19(5): 153-157. https://www.cnki.com.cn/Article/CJFDTOTAL-STBY201205030.htm
[16] 谢国雄, 胡康赢, 王忠, 等. 耕地土壤有机质提升的几点思考[J]. 江西农业学报, 2020, 32(4): 78-83. https://www.cnki.com.cn/Article/CJFDTOTAL-JXNY202004014.htm
[17] 徐宏林, 付豪, 叶岛, 等. 仙桃市西南部耕层土壤中养分元素有效量和有效度研究[J]. 资源环境与工程, 2017, 31(3): 278-283. https://www.cnki.com.cn/Article/CJFDTOTAL-HBDK201703009.htm
[18] 严明书, 吴春梅, 蒙丽, 等. 重庆市黔江猕猴桃果园土壤养分状况分析[J]. 物探与化探, 2019, 43(5): 1123-1130. https://www.cnki.com.cn/Article/CJFDTOTAL-WTYH201905024.htm
[19] 杨秀珍, 吴迪, 秦樊鑫, 等. 贵州典型铅锌矿区土壤阳离子交换量水平分析与施肥建议[J]. 贵州师范大学学报(自然科学版), 2012, 30(6): 29-32. https://www.cnki.com.cn/Article/CJFDTOTAL-NATR201206008.htm
[20] 叶家瑜, 江宝林. 区域地球化学勘查样品分析方法[M]. 北京: 地质出版社, 2004: 1-416.
[21] 尹春艳, 李彬, 黄斌, 等. 鄂尔多斯高原农田土壤类型与养分组成对微量元素的影响——以鄂托克旗为例[J]. 中国水土保持, 2020, (5): 40-43. https://www.cnki.com.cn/Article/CJFDTOTAL-ZGSB202005018.htm
[22] 臧惠林, 张效朴, 何电源. 我国南方水稻土供硅能力的研究[J]. 土壤学报, 1982, (2): 131-140. https://www.cnki.com.cn/Article/CJFDTOTAL-TRXB198202003.htm
[23] 张华国. 西藏青稞粮食主产区土壤养分状况分析评价研究[J]. 肥料与健康, 2020, 47(1): 17-20, 71. https://www.cnki.com.cn/Article/CJFDTOTAL-KDHL202001006.htm
[24] 赵送来, 宋照亮, 姜培坤, 等. 西天目集约经营雷竹林土壤硅存在形态与植物有效性研究[J]. 土壤学报, 2012, 49(2): 331-338. https://www.cnki.com.cn/Article/CJFDTOTAL-TRXB201202017.htm
[25] 中国地质调查局. 生态地球化学评价样品分析技术要求(DD2005-03)[S]. 2005.
[26] 中国地质调查局. 多目标区域地球化学调查规范(DD2005-01)[S]. 2005.
[27] 中华人民共和国国土资源部. 土地质量地球化学评价规范(DZ/T 0295-2016)[M]. 北京: 地质出版社, 2016.
[28] 周国华, 孙彬彬, 方金梅. 福建龙海生态地球化学研究[M]. 北京: 地质出版社, 2018: 169.
-
图(1)
表(11)
计量
- 文章访问数: 663
- PDF下载数: 169
- 施引文献: 0