

SPATIOTEMPORAL DYNAMIC CHANGE ANALYSIS OF LAND USE IN EASTERN SONGNEN PLAIN
-
摘要:
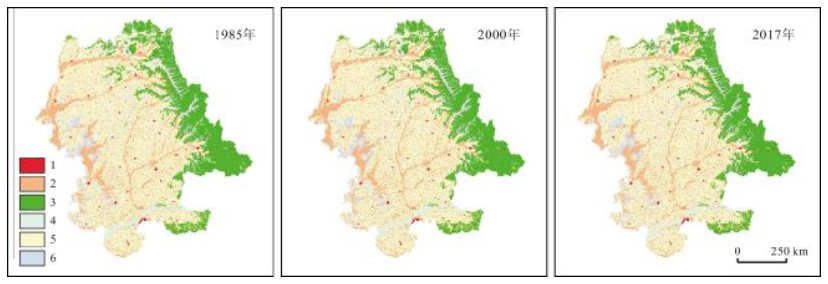
基于1985、2000、2017年3期土地利用遥感监测数据,利用土地利用转移矩阵、重心模型、生态环境质量指数等方法,对松嫩平原东部30年间土地利用转型时空变化特征及生态环境效应进行分析.结果表明:1985~2015年,松嫩平原东部地区土地利用以耕地和林地为主,分布界线清晰.土地利用强度持续增加,前期增加较快,后期趋缓.土地利用转型主要表现为农业生产用地持续增加,生态用地持续减少,建设用地小幅增加,前期变化剧烈,后期趋缓.土地利用转型方向较为稳定.重心转移轨迹变化较大,其中变化最大的是1985~2000年,水域的转移轨迹向西北方向偏移76.34 km.松嫩平原区域生态环境质量指数从1985年的0.395持续下降至2017年的0.361,生态环境质量持续恶化.2017年空间分布以中质量区和中低质量区为主,农业生产用地与草地、未利用地之间的相互转变是影响生态环境质量变化的主要因素.
Abstract:Based on the remote sensing monitoring data of land use in 1985, 2000 and 2017, the spatiotemporal variation characteristics and eco-environmental effects of land use transition in eastern Songnen Plain in the past 30 years are analyzed by means of land use transfer matrix, gravity center model and eco-environment quality index. The results show that the land use is mainly cultivated land and forest land with clear distribution boundary during 1985-2015. The land use intensity continues to increase, fast in early stage and slow in later. The main performances of land use transition involve continuous increase of agricultural land, continuous decrease of ecological land and slight increase of construction land, changing drastically in early stage and slowing down in later. The direction of land use transition is generally stable. The shift trajectory of transfer barycenter varies greatly, of which the largest change is during 1985-2000, with the transfer trajectory of water area shifting 76.34 km northwestward. The regional eco-environmental quality index of Songnen Plain continued to decline from 0.395 in 1985 to 0.361 in 2017, indicating the continuous deterioration of eco-environmental quality. In 2017, the spatial distribution is dominated by medium and low-medium quality areas. The mutual transition between agricultural land, grassland and unused land is the main influencing factor of ecological environment quality.
-
Key words:
- land use /
- spatiotemporal analysis /
- satellite remote sensing /
- land ecology /
- Songnen Plain
-

-
表 1 松嫩平原研究区3期土地利用情况统计及结构变化表
Table 1. Land use statistics and structural changes of the study area in 3 periods
土地类型 面积/km2 占研究区比例 变化面积/km2 1985年 2000年 2017年 1985年 2000年 2017年 1985~2000年 2000~2017年 1985~2017年 耕地 55 720.92 63 168.45 66 211 55.42% 62.82% 65.85% 7 447.53 3 042.55 10 490.08 林地 19 793.95 18 059.78 17 938.82 19.69% 17.96% 17.84% -1 734.17 -120.97 -1 855.13 草地 8 466.82 7 479.59 5 521.96 8.42% 7.44% 5.49% -987.23 -1 957.63 -2 944.86 水域 2 304.30 1 064.17 1 700.02 2.29% 1.06% 1.69% -1 240.13 635.85 -604.28 建设用地 3 846.37 4 074.84 4 760.22 3.83% 4.05% 4.73% 228.48 685.38 913.85 未利用地 10 414.90 6 700.49 4 415.28 10.36% 6.66% 4.39% -3 714.41 -2 285.22 -5 999.62  下载: 导出CSV
表 2 松嫩平原研究区单一土地利用动态度
Table 2. Dynamic degrees of land use in Songnen Plain by types
土地利用类型 1985~2000年 2000~2017年 1985~2017年 草地 -0.78% -1.54% -1.09% 耕地 0.89% 0.28% 0.59% 建设用地 0.40% 0.99% 0.74% 林地 -0.58% -0.04% -0.29% 水域 -3.59% 3.51% -0.82% 未利用地 -2.38% -2.01% -1.80%
下载: 导出CSV
表 3 土地利用强度分级赋值
Table 3. Grading and assignment of land use intensity
分级 未利用地级 林地/草地/水用地级 农业用地级 城镇聚落用地级 分级指数 1 2 3 4 土地利用类型 未利用地/特殊用地 林地/草地/水域 耕地 建设/交通用地
下载: 导出CSV
表 4 松嫩平原研究区土地利用综合指数及土地利用程度变化量
Table 4. Land use composite index and land use degree changes in Songnen Plain
时间 1985年 2000年 2017年 土地利用综合指数 252.71 264.27 270.93 时段 1985~2000年 2000~2017年 1985~2017年 土地利用程度变化量 11.56 6.66 18.22
下载: 导出CSV
表 5 1985~2017年松嫩平原研究区土地利用转移矩阵
Table 5. Land use transfer matrix of Songnen Plain during 1985-2017

草地 耕地 建设用地 林地 水域 未利用地 总面积 变化率 草地 4116.19 2943.06 23.35 574.25 54.18 694.11 8405.15 51.03% 耕地 421.06 54102.81 351.94 155.27 39.47 243.30 55313.85 2.19% 建设用地 18.39 151.44 3629.74 4.66 0.53 13.45 3818.22 4.94% 林地 886.56 1511.99 10.93 17124.58 19.39 96.76 19650.21 12.85% 水域 122.31 674.03 10.33 3.01 729.76 748.28 2287.73 68.10% 未利用地 1860.63 3323.57 18.76 66.48 213.14 4855.61 10338.19 53.03% 总面积 7425.15 62706.90 4045.05 17928.26 1056.47 6651.52 99813.34 0% 
草地 耕地 建设用地 林地 水域 未利用地 总面积 变化率 草地 3418.81 2625.63 71.34 414.58 110.49 784.30 7425.15 53.96% 耕地 952.82 60125.05 607.85 393.01 241.05 387.12 62706.90 4.12% 建设用地 7.00 109.35 3915.93 2.98 5.90 3.88 4045.05 3.19% 林地 193.42 766.75 26.39 16924.76 7.35 9.58 17928.26 5.60% 水域 27.11 90.00 1.15 4.19 889.33 44.69 1056.47 15.82% 未利用地 882.36 2010.78 102.79 68.62 433.62 3153.34 6651.52 52.59% 总面积 5481.53 65727.56 4725.45 17808.15 1687.75 4382.90 99813.34 0% 
草地 耕地 建设用地 林地 水域 未利用地 总面积 变化率 草地 2525.28 4358.79 100.40 661.20 94.77 664.72 8405.15 69.96% 耕地 311.92 53577.26 851.35 294.52 142.78 136.03 55313.85 3.14% 建设用地 11.47 201.84 3586.22 6.30 5.65 6.74 3818.22 6.08% 林地 474.16 2343.42 39.81 16700.57 28.14 64.11 19650.21 15.01% 水域 103.94 874.20 39.13 10.65 1056.28 203.54 2287.73 53.83% 未利用地 2054.77 4372.06 108.55 134.91 360.14 3307.77 10338.19 68.00% 总面积 5481.53 65727.56 4725.45 17808.15 1687.75 4382.90 99813.34 0% 面积单位: km2.
下载: 导出CSV
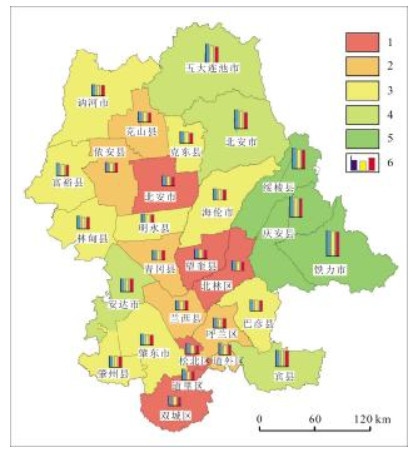
表 6 1985~2017年研究区生态环境质量等级占比变化(按行政区)
Table 6. Percentage changes of eco-environment quality grade in the study area during 1985-2017 (by administrative region)
等级 高质量区 中高质量区 中质量区 中低质量区 低质量区 1985年 18% 21% 39% 21% 0% 2000年 18% 7% 36% 29% 11% 2017年 11% 14% 36% 21% 18%
下载: 导出CSV
-
[1] 王静.土地资源遥感监测与评价方法[M].北京:科学出版社, 2006:49-59.
[2] 路昌, 张傲.东北地区土地利用转型及其生态环境效应[J].中国农业大学学报, 2020, 25(4):123-133. https://www.cnki.com.cn/Article/CJFDTOTAL-NYDX202004011.htm
[3] 赵丽, 张贵军, 朱永明, 等.基于土地利用转型的土地多功能转变与特征分析——以河北省唐县为例[J].中国土地科学, 2017, 31(6):42-50. https://www.cnki.com.cn/Article/CJFDTOTAL-ZTKX201706006.htm
[4] 张蕾. "三生用地"转型的生态系统服务价值效应——以营口市为例[J].生态学杂志, 2019, 38(3):838-846. https://www.cnki.com.cn/Article/CJFDTOTAL-STXZ201903027.htm
[5] 黄金亭, 曹艳萍, 秦奋.基于土地利用/覆盖变化模拟的黄河流域生态环境质量分析[J].河南大学学报(自然科学版), 2020, 50(2):127-138. https://www.cnki.com.cn/Article/CJFDTOTAL-HDZR202002001.htm
[6] 杨丹.土地利用变化的时空特征及驱动力分析——以黄河下游开封段背河洼地区为例[D].开封: 河南大学, 2019.
[7] 王雪梅, 柴仲平, 毛东雷, 等.不同土地利用方式下渭-库绿洲土壤质量评价[J].水土保持通报, 2015, 35(4):319-323. https://www.cnki.com.cn/Article/CJFDTOTAL-STTB201504062.htm
[8] 吴尚.近30年江苏省土地利用时空格局演变[J].资源开发与市场, 2020, 36(3):246-251. doi: 10.3969/j.issn.1005-8141.2020.03.004
[9] 傅家仪, 臧传富, 吴铭婉. 1990-2015年海河流域土地利用时空变化特征及驱动机制研究[J].中国农业资源与区划, 2020, 41(5):131-139. https://www.cnki.com.cn/Article/CJFDTOTAL-ZGNZ202005021.htm
[10] 马梓策, 于红博, 张巧凤, 等.基于CA-Markov模型的锡林河流域土地利用变化及预测分析[J].西北林学院学报, 2020, 35(2):169-177. https://www.cnki.com.cn/Article/CJFDTOTAL-XBLX202002026.htm
[11] 吕晓, 史洋洋, 黄贤金, 等.江苏省土地利用变化的图谱特征[J].应用生态学报, 2016, 27(4):1077-1084. https://www.cnki.com.cn/Article/CJFDTOTAL-YYSB201604010.htm
[12] 冯雨林, 杨佳佳, 吴梦红.基于景观转移矩阵的黑龙江双河自然保护区土地覆被转移研究[J].地质与资源, 2016, 25(5):500-504. doi: 10.3969/j.issn.1671-1947.2016.05.014 http://manu25.magtech.com.cn/Jweb_dzyzy/CN/abstract/abstract8680.shtml
[13] 张新乐, 窦欣, 谢雅慧, 等.引入时相信息的耕地土壤有机质遥感反演模型[J].农业工程学报, 2018, 34(4):143-150. https://www.cnki.com.cn/Article/CJFDTOTAL-NYGU201804017.htm
[14] 吴才武, 张月丛, 夏建新.基于地统计与遥感反演相结合的有机质预测制图研究[J].土壤学报, 2016, 53(6):1568-1575. https://www.cnki.com.cn/Article/CJFDTOTAL-TRXB201606022.htm
[15] 陆访仪, 赵永存, 黄标, 等.海伦市耕层土壤有机质含量空间预测方法研究[J].土壤通报, 2012, 43(3):662-667. https://www.cnki.com.cn/Article/CJFDTOTAL-TRTB201203027.htm
[16] 陶培峰, 王建华, 李志忠, 等.基于高光谱的土壤养分含量反演模型研究[J].地质与资源, 2020, 29(1):68-75, 84. http://manu25.magtech.com.cn/Jweb_dzyzy/CN/abstract/abstract10151.shtml
[17] 张凤荣, 张小京, 周建.都市区设施农业用地空间变化及其政策启示[J].资源科学, 2015, 37(4):637-644. https://www.cnki.com.cn/Article/CJFDTOTAL-ZRZY201504001.htm
[18] 庄大方, 刘纪远.中国土地利用程度的区域分异模型研究[J].自然资源学报, 1997, 12(2):105-111. doi: 10.3321/j.issn:1000-3037.1997.02.002
[19] 吕立刚, 周生路, 周兵兵, 等.区域发展过程中土地利用转型及其生态环境响应研究——以江苏省为例[J].地理科学, 2013, 33(12):1442-1449. https://www.cnki.com.cn/Article/CJFDTOTAL-DLKX201312005.htm
[20] 崔佳, 臧淑英.哈大齐工业走廊土地利用变化的生态环境效应[J].地理研究, 2013, 32(5):848-856. https://www.cnki.com.cn/Article/CJFDTOTAL-DLYJ201305009.htm
-

图(4)
表(6)
计量
- 文章访问数: 935
- PDF下载数: 226
- 施引文献: 0