

QUANTITATIVE PREDICTION TECHNIQUE FOR GAS CONTENT AND ITS APPLICATION TO JIAOSHIBA AREA OF FULING SHALE GASFIELD, SICHUAN BASIN
-
摘要:
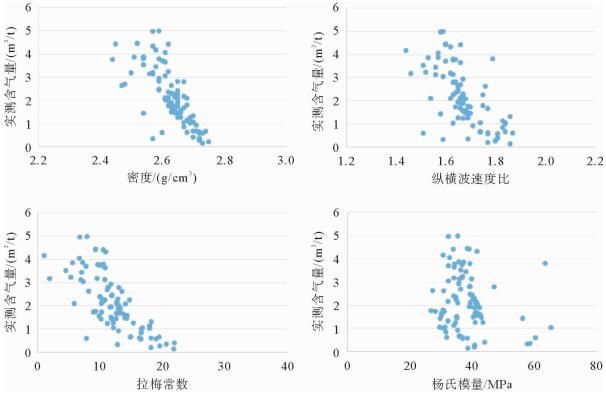
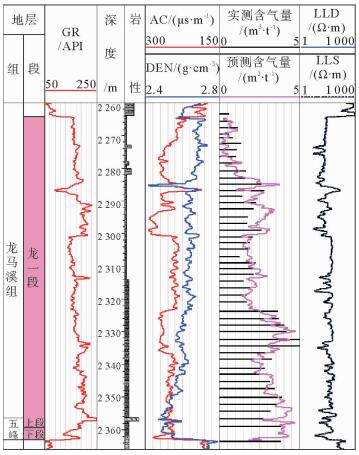
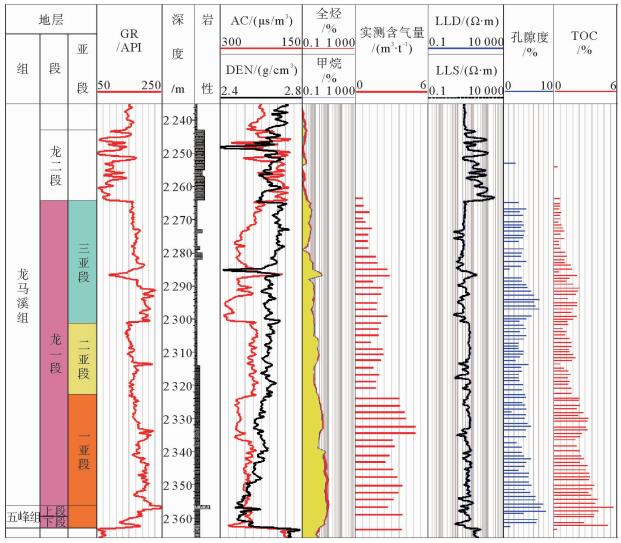
页岩含气量是页岩气勘探选区和储层评价的一项重要指标。目前,利用地震资料对页岩含气性评价多停留在定性预测阶段,定量化表征方法尚不成熟。从已钻井的实测含气量出发,利用横波测井资料,分析实测含气量与地球物理参数之间的关系,利用数理统计学的思想,优选出密度、纵波阻抗、纵横波速度比、λρ 4个参数变量,建立了适合焦石坝页岩气田的含气量多元线性回归预测模型;通过叠前同时反演获得的密度、纵波阻抗等相关数据体,实现页岩含气量的定量预测,结果表明,预测的含气量与实钻结果吻合度较高,相对误差小,预测方法可靠;同时指出,焦石坝地区五峰组—龙马溪组一亚段含气量较高,为有利开发层段。
Abstract:Gas content is an important index for evaluating resource potential of shale gas. Up to date, the seismic method has been adopted as the main tool for shale gas evaluation. However, it is mostly qualitative. There is so far no matured method for quantitative prediction of shale gas based on seismic data. Through the mathematical statistics of the core-measured gas content and other geophysical parameters, we selected 4 elastic parameters, namely the density, P-wave impedance, P-S wave velocity ratio and λρand established a multiple linear regression model suitable for the Jianshiba shale gas field. The density, P-wave impedance and other relevant elastic parameters are obtained through pre-stack simultaneous inversion. And quantitative prediction of gas content is made upon the results. The predicted and the measured values of gas content match well and have little errors. It is found out in this paper that the 1st Submember at the bottom of the Longmaxi Formation-Wufeng Fomation has higher gas content, and is the most favorable producing layer in the region.
-

-
表 1 参数相关性矩阵分析
Table 1. Correlation matrix analysis of parameters
AI Vp/Vs SI μ σ λ E λρ μρ ρ GAS AI 1 0.299 0.842 0.791 0.31 0.737 0.895 0.734 0.846 0.432 -0.457 Vp/Vs 0.299 1 -0.261 -0.329 0.976 0.848 -0.138 0.849 -0.245 0.661 -0.628 SI 0.842 -0.261 1 0.991 -0.238 0.26 0.985 0.255 0.997 0.057 -0.125 μ 0.791 -0.329 0.991 1 -0.306 0.183 0.978 0.174 0.992 -0.056 -0.061 σ 0.31 0.976 -0.238 -0.306 1 0.841 -0.106 0.838 -0.225 0.637 -0.602 λ 0.737 0.848 0.26 0.183 0.841 1 0.376 0.999 0.272 0.682 -0.613 E 0.895 -0.138 0.985 0.978 -0.106 0.376 1 0.267 0.711 0.082 -0.177 λρ 0.734 0.849 0.255 0.174 0.838 0.999 0.267 1 0.067 0.711 -0.622 μρ 0.846 -0.245 0.997 0.992 -0.225 0.272 0.711 0.067 1 0.067 -0.139 ρ 0.432 0.661 0.057 -0.056 0.637 0.682 0.082 0.711 0.067 1 -0.671 GAS -0.457 -0.628 -0.125 -0.061 -0.602 -0.613 -0.177 -0.622 -0.139 -0.671 1  下载: 导出CSV
表 2 模型变量输入
Table 2. Input of model variables
模型 输入变量 移除变量 方法 1 λ、λρ、ρ、σ、Vp/Vs、AI Enter 2 λ 向后(F≥0.1, remove) 3 σ 向后(F≥0.1, remove)
下载: 导出CSV
表 3 模型摘要
Table 3. Summary of model parameters
模型 R R2 调整后R2 标准误差限 1 0.839a 0.703 0.682 0.693 8 2 0.839b 0.703 0.686 0.689 68 3 0.839c 0.703 0.689 0.685 75 注:1.预测值:常数,λ、λρ、ρ、σ、Vp/Vs、AI;2.预测值:常数,λ、λρ、ρ、σ、Vp/Vs、AI;3.预测值:常数,λ、ρ、Vp/Vs、AI
下载: 导出CSV
表 4 变量分析
Table 4. Analysis of variances
模型 平方和 df 平均值平方 F 显著性 1 回归 94.788 6 15.798 32.820 0.000 残差 39.953 83 0.481 统计 134.741 89 2 回归 94.786 5 18.957 39.855 0.000 残差 39.955 84 0.476 统计 134.71 89 3 回归 94.770 4 23.692 50.382 0.000 残差 39.972 85 0.470 统计 134.741 89
下载: 导出CSV
表 5 回归系数及显著性检验
Table 5. Regression coefficient and test of significance
模型 非标准系数 标准系数 T 显著性 共线性诊断 B 标准误差 Beta 允差 VIFWW 1 (常数) 80.549 15.057 5.350 0.000 ρ -6.802 5.129 -0.371 -1.326 0.188 0.046 21.853 λρ 0.623 1.296 2.280 0.481 0.632 0.000 6 283.966 Vp/Vs -29.561 5.198 -2.171 -5.678 0.000 0.026 40.787 σ 1.821 10.870 0.074 0.168 0.867 0.018 54.626 AI -0.002 0.000 -1.571 -5.823 0.000 0.049 20.370 λ 0.029 0.450 0.297 0.065 0.948 0.000 5 864.715 2 (常数) 79.753 8.703 9.163 0.000 ρ -6.484 1.544 -0.353 -4.201 0.000 0.499 2.003 λρ 0.707 0.106 2.586 6.669 0.000 0.023 42.602 Vp/Vs -29.482 5.024 -2.165 -5.868 0.000 0.026 38.562 σ 1.271 6.769 0.052 0.188 0.852 0.047 21.438 AI -0.002 0.000 -1.581 -7.304 0.000 0.075 13.273 3 (常数) 79.062 7.841 10.083 0.000 ρ -6.507 1.530 -0.355 -4.253 0.000 0.502 1.991 λρ 0.709 0.105 2.594 6.767 0.000 0.024 42.107 Vp/Vs -28.864 3.773 -2.120 -7.650 0.000 0.045 21.998 AI -0.002 0.000 -1.584 -7.376 0.000 0.076 13.211
下载: 导出CSV
表 6 单井预测含气量与测井解释成果对比
Table 6. Comparison table between the predicted values and the measured values of gas content
区块 井名 测井解释含气量/(m3/t) 预测含气量/(m3/t) 绝对误差 相对误差/% 一期产建区 Well1 6.57 6.45 -0.12 1.82 Well2 6.51 6.4 -0.11 1.68 Well3 5.32 5.4 0.08 1.5 Well4 5.65 5.75 0.1 1.76 一期周缘 Well5 5.1 5.2 0.1 1.96 Well6 5.99 6 0.01 0.17 Well7 4.72 4.8 0.08 1.69 Well8 4.83 4.9 0.07 1.44 Well9 4.73 4.75 0.02 0.42 Well10 4.54 4.7 0.16 3.52
下载: 导出CSV
-
[1] 董谦, 刘小平, 李武广, 等.关于页岩含气量确定方法的探讨[J].天然气与石油, 2012, 35(5):34-37. http://www.wanfangdata.com.cn/details/detail.do?_type=perio&id=trqysy201205011
[2] 李郭琴, 李宜真, 吴斌.页岩含气量研究方法:以川东南地区龙马溪组为例[J].石油化工应用, 2014, 33(3):6-8. doi: 10.3969/j.issn.1673-5285.2014.03.002
[3] 唐颖, 张金川, 刘珠江, 等.解吸法测量页岩含气量及其方法的改进[J].天然气工业, 2011, 31(10):108-128. doi: 10.3787/j.issn.1000-0976.2011.10.026
[4] 李玉喜, 乔德武, 姜文利, 等.页岩气含气量和页岩气地质评价综述[J].地质通报, 2011, 30(2-3):308-317. doi: 10.3969/j.issn.1671-2552.2011.02.016
[5] 肖开华, 李双建, 汪新伟, 等.中、上扬子区志留系油气成藏特点与勘探前景[J].石油与天然气地质, 2008, 29(5):589-596. doi: 10.3321/j.issn:0253-9985.2008.05.007
[6] 张士万, 孟志勇, 郭战峰, 等.涪陵地区龙马溪组页岩储层特征及其发育主控因素[J].天然气工业, 2014, 34(12):16-24. doi: 10.3787/j.issn.1000-0976.2014.12.002
[7] 聂海宽, 张金川.页岩气聚集条件及含气量计算——以四川盆地及其周缘下古生界为例[J].地质学报, 2012, 86(2):349-361. doi: 10.3969/j.issn.0001-5717.2012.02.013
[8] 宛利红, 刘波涛, 王新海, 等.致密油藏多元回归产能预测方法研究与应用[J].油气井测试, 2015, 24(1):17-26. doi: 10.3969/j.issn.1004-4388.2015.01.005
[9] 毕建武, 贾进章, 刘丹.基于SPSS多元回归分析的回采工作面瓦斯涌出量预测[J].安全与环境学报, 2013, 13(5):183-186. http://www.wanfangdata.com.cn/details/detail.do?_type=perio&id=aqyhjxb201305038
[10] 张雅晨, 刘彩, 范晓敏.多元回归分析方法在火山碎屑岩储层孔隙度计算中应用[J].世界地质, 2012, 31(2):377-382. doi: 10.3969/j.issn.1004-5589.2012.02.020
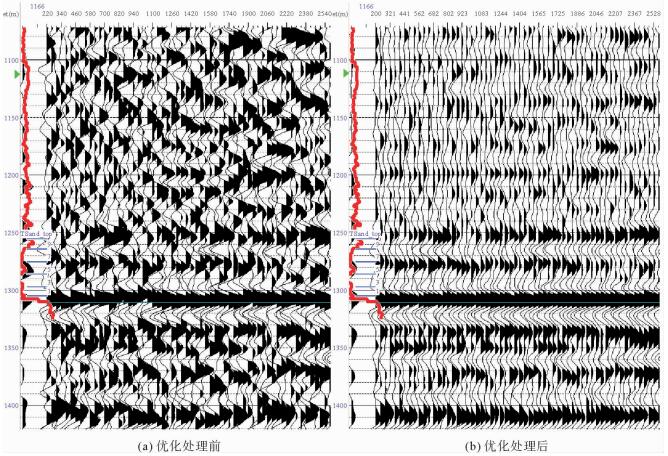
[11] 邹贤军. JSB地区叠前反演道集优化处理[J].内蒙古石油化工, 2015(7):32-35. doi: 10.3969/j.issn.1006-7981.2015.07.013
[12] 霍风斌, 徐发, 张涛, 等.叠前同时反演在储层识别和流体预测中的应用——以A油气田B构造C组为例[J].油气地球物理, 2014, 12(1):9-13. http://www.cqvip.com/QK/87845X/201401/48359119.html
-

图(8)
表(6)
计量
- 文章访问数: 627
- PDF下载数: 42
- 施引文献: 0