

VARIATION IN CHEMICAL ELEMENTS OF GROUNDWATER ALONG THE SOUTH COAST OF HAINAN ISLAND AND SIGNIFICANCE TO SEAWATER INTRUSION
-
摘要:
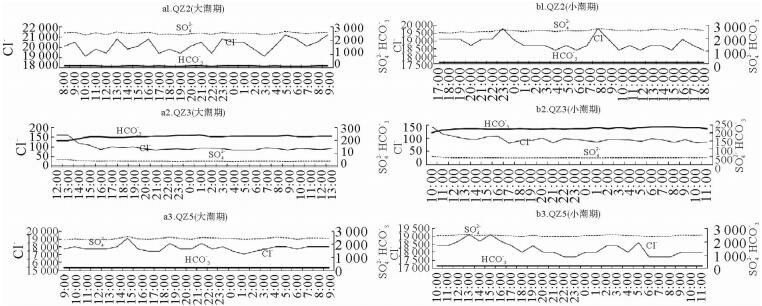
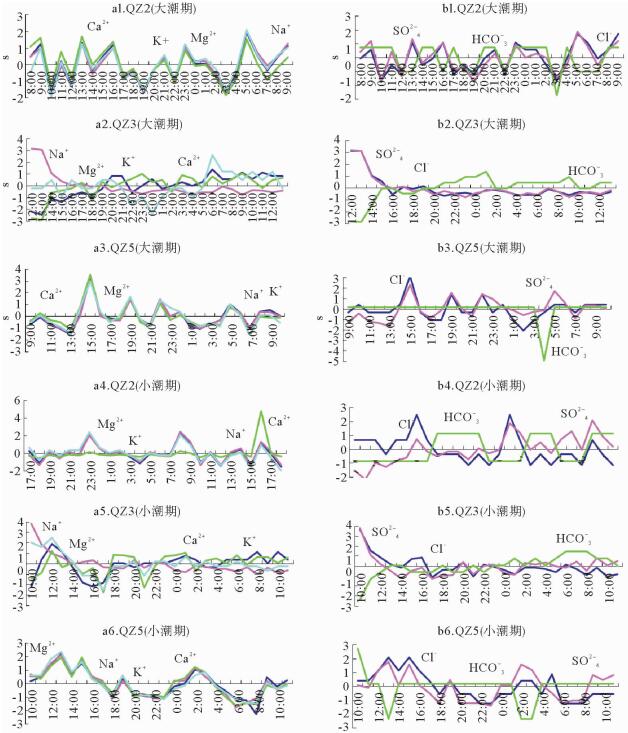
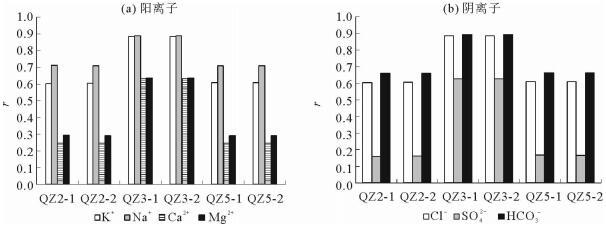
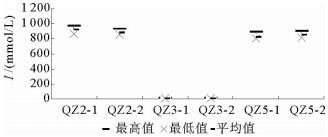
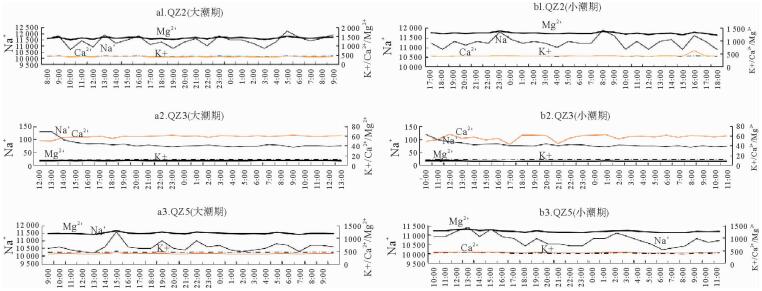
对位于海南岛南部滨岸测井地下水进行了大小潮周日取样及其化学测试。结果显示,化学要素含量及变化特征随潮期、测井位置而变化,由于所处环境的不同,QZ2和QZ5监测井的K+、Na+、Ca2+含量相近,而Mg2+的差异较明显,前者平均高出后者18.82%,表明QZ2监测井受到海水入侵。QZ2、QZ5监测井阳离子以Na+、阴离子以Cl-占优,Na+所占平均比例为83%~85%、Cl-为87%~88%,显示出海水的影响;QZ3监测井以HCO3-占优,比例为62%~63%,Ca2+也占据较大优势,为淡水所控制。QZ2、QZ5监测井SAR依次为57.95~63.24、57.20~63.13,QZ3监测井为2.17~4.42,前两者明显要高很多。QZ2、QZ5监测井地下水盐碱化风险程度很高,QZ3为一般。
Abstract:The data of 2014 from monitoring wells in South Coast of Hainan Island was studied during the times of neap tide and spring tide. Variation in chemical elements of the groundwater is adopted for revealing its relation with seawater intrusion. Our results show that chemical element concentration varies with tidal cycles, location of wells and surrounding environment. In the wells of QZ2 and QZ5, the contents of K+, Na+, Ca2+ are quite close, but Mg2+ is obviously different. In the well QZ2, it is 18.82% higher than that in well QZ5, suggesting that the well QZ2 is more severely affected by seawater. Na+ and Cl- are the dominant ions in both the wells of QZ2 and QZ5. The average ratio of Na+ is 83%~85%, Cl- is 87%~88%, showing effects of seawater. In the well QZ3, HCO3- is the dominant, the content is 62%~63%, and Ca2+ also occupies a large proportion, showing the predominance of fresh water. The SAR of QZ2 and QZ5 wells are 57.95~ 63.24 and 57.20~63.13 respectively. However, it is 2.17~4.42 in well QZ3, obviously lower than those in QZ2 and QZ5. As the conclusion, wells QZ2 and QZ5 have higher risk of salinization.
-
Key words:
- South Hainan Island /
- groundwater /
- chemical element /
- seawater intrusion
-

-
表 1 地下水监测井25小时水位观测
Table 1. Observation of groundwater monitoring wells in 25 hours
井号 观测及取样时间(年/月/日时:分) 潮位 地下水取样(组) QZ2 2014/06/13 08:30-2014/06/14 09:30 大潮 26 2014/06/19 17:00-2014/06/20 18:00 小潮 26 QZ3 2014/06/13 12:00-2014/06/14 13:00 大潮 26 2014/06/19 10:00-2014/06/20 11:00 小潮 26 QZ5 2014/06/27 09:00-2014/06/28 10:00 大潮 26 2014/06/19 10:00-2014/06/20 11:00 小潮 26  下载: 导出CSV
表 2 监测井地下水潮周期阳离子含量统计
Table 2. The content of cations of groundwater monitoring wells in tide period
/(mg/L) 测量时段 监测井 统计项目 K+ Na+ Ca2+ Mg2+ QZ2 最小 406 10 700 384 1 330 大
潮
期最大 458 12 200 430 1 520 平均 430 11 415 408 1 422 偏态 -0.09 -0.13 0.09 -0.11 峰态 -0.69 -0.50 -0.80 -0.37 变异系数 0.03 0.03 0.03 0.03 QZ3 最小 9.8 68.7 49.8 8.3 最大 11.2 129.0 61.5 9.0 平均 10.7 80.3 58.4 8.6 偏态 -0.92 2.61 -1.88 0.12 峰态 0.46 6.48 3.66 1.07 变异系数 0.03 0.19 0.05 0.02 QZ5 最小 432 10 200 382 1 150 最大 492 11 600 432 1 290 平均 451 10 592 397 1 197 偏态 1.46 1.87 1.90 1.08 峰态 3.46 5.33 5.50 1.74 变异系数 0.03 0.03 0.02 0.03
小
潮
期QZ2 最小 385 10 900 390 1 230 最大 426 11 900 623 1 380 平均 401 11 254 413 1 298 偏态 0.69 0.66 4.80 0.34 峰态 0.74 0.53 23.88 0.87 变异系数 0.03 0.02 0.11 0.03 QZ3 最小 10.3 67.8 42.2 7.3 最大 11.4 119.0 63.6 8.4 平均 10.9 78.4 56.9 7.9 偏态 -0.84 2.63 -1.28 0.33 峰态 0.66 8.42 1.33 1.66 变异系数 0.03 0.14 0.10 0.03 QZ5 最小 362 10 200 398 1 210 最大 419 11 400 438 1 360 平均 391 10 735 416 1 266 偏态 0.07 0.33 0.23 0.64 峰态 0.09 -0.34 -0.62 -0.07 变异系数 0.03 0.03 0.03 0.03
下载: 导出CSV
表 3 监测井地下水潮周期阴离子含量统计
Table 3. The content of anions of groundwater monitoring wells in tide period
/(mg/L) 测量时段 监测井 统计项目 Cl- SO42- HCO3- QZ2 最低 19 100 2 390 118 大
潮
期最高 21 200 2 660 128 平均 20 138 2 519 126 偏态 -0.04 -0.11 -1.00 峰态 -0.93 -0.81 0.11 变异系数 0.03 0.03 0.02 QZ3 最低 83.3 35.0 197 最高 160.0 49.9 242 平均 96.8 37.9 227 偏态 2.64 2.71 -1.87 峰态 6.55 7.03 3.77 变异系数 0.21 0.10 0.05 QZ5 最低 17 000 2 320 158 最高 19 100 2 580 168 平均 17 827 2 427 168 偏态 1.04 0.56 -5.10 峰态 3.16 0.02 26.00 变异系数 0.02 0.03 0.01
小
潮
期QZ2 最低 18 400 2 400 123 最高 19 800 2 780 128 平均 18 838 2 594 125 偏态 1.04 0.15 0.33 峰态 1.08 0.18 -2.06 变异系数 0.02 0.03 0.02 QZ3 最低 80.5 39.3 202 最高 142.0 49.3 237 平均 95.0 41.8 226 偏态 2.18 2.20 -1.31 峰态 6.81 7.95 4.10 变异系数 0.13 0.05 0.03 QZ5 最低 17 700 2 370 153 最高 19 100 2 540 163 平均 18 223 2 445 158 偏态 0.56 0.20 -0.79 峰态 -0.46 -1.09 4.18 变异系数 0.02 0.02 0.01
下载: 导出CSV
表 4 监测井地下水潮周期内咸水类型
Table 4. Saline water type of ground water monitoring wells in tide cycle
测量时段 监测井 咸水类型 测量时段 监测井 咸水类型 大潮期 QZ2 盐水 小潮期 QZ2 盐水 QZ3 淡水 QZ3 淡水 QZ5 盐水 QZ5 盐水
下载: 导出CSV
表 5 监测井地下水潮周期内盐碱化程度
Table 5. Degree of salinization of groundwater monitoring wells in tide cycle
测量时段 监测井 咸水类型 测量时段 监测井 咸水类型 大潮期 QZ2 高 小潮期 QZ2 高 QZ3 一般 QZ3 一般 QZ5 高 QZ5 高
下载: 导出CSV
-
[1] 晁会霞, 韩孝辉, 杨志华, 等.对海南岛大地构造特征的新探索[J].地学前缘, 2016, 23(4):200-211. http://www.wanfangdata.com.cn/details/detail.do?_type=perio&id=dxqy201604017
[2] 唐少霞, 赵志忠, 毕华, 等.海南岛气候资源特征及其开发利用[J].海南师范大学学报:自然科学版, 2008, 21(3):343-346. http://www.wanfangdata.com.cn/details/detail.do?_type=perio&id=hainansfxyxb200803026
[3] 周祖光.海南岛地下水资源特征与开发利用[J].水资源保护, 2005, 21(3):48-51. doi: 10.3969/j.issn.1004-6933.2005.03.016
[4] 王道儒, 吴钟解, 陈春华, 等.海南岛海草资源分布现状及存在威胁[J].海洋环境科学, 2012, 31(1):34-38. doi: 10.3969/j.issn.1007-6336.2012.01.008
[5] 吴钟解, 吴瑞, 王道儒, 等.海南岛东、南部珊瑚礁生态健康状况初步分析[J].热带作物学报, 2011, 32(1):122-130. doi: 10.3969/j.issn.1000-2561.2011.01.025
[6] 郭占荣, 黄奕普.海水入侵问题研究综述[J].水文, 2003, 23(3):10-15. doi: 10.3969/j.issn.1000-0852.2003.03.003
[7] 黄向青, 林进清, 甘华阳, 等.雷州半岛东岸地下水化学要素变化以及海水入侵特征[J].地下水, 2013, 35(3):38-42. doi: 10.3969/j.issn.1004-1184.2013.03.013
[8] 姚锦梅, 周训, 谢朝海.广西北海市海城区西段含水层海水入侵地球化学过程研究[J].地质学报, 2011, 85(1):136-144. doi: 10.3969/j.issn.1006-7493.2011.01.018
[9] 丁玲, 李碧英, 张树深.海岸带海水入侵的研究进展[J].海洋通报, 2004, 23(2):82-87. doi: 10.3969/j.issn.1001-6392.2004.02.013
[10] 孙振宇, 宋献方, 卜红梅, 等.秦皇岛洋河-戴河流域浅层地下水咸化程度评价[J].安全与环境学报, 2015, 15(3):356-361. http://www.wanfangdata.com.cn/details/detail.do?_type=perio&id=aqyhjxb201503075
[11] 陈苑.硇洲岛地下水水质咸化和海水入侵主要成因及对策[J].大众科技, 2011(4):114-115. doi: 10.3969/j.issn.1008-1151.2011.04.052
[12] 黄栋声, 何军.广西北海市滨海地带咸化地下水化学特征[J].低碳世界, 2016(36):128-130. http://www.wanfangdata.com.cn/details/detail.do?_type=perio&id=dtsj201636083
[13] 杜中, 李占斌, 李鹏, 等.海水入侵区地下水氯值统计及其规律运用[J].水资源与水工程学报, 2008, 19(4):83-85. http://www.wanfangdata.com.cn/details/detail.do?_type=perio&id=xbszyysgc200804020
[14] 常艳娥, 黎广钊.北海市海水养殖区海水入侵特征及对地下水的影响——以南流江三角洲平原为例[J].安徽农业科学, 2011, 39(18):11057-11060. doi: 10.3969/j.issn.0517-6611.2011.18.122
[15] 王丹, 陶志刚, 李昌存.唐山沿海海水入侵地下水水质评价[J].海洋地质前沿, 2006, 22(6):10-14. http://www.wanfangdata.com.cn/details/detail.do?_type=perio&id=hydzdt200606003
[16] 赵建.海水入侵水化学指标及侵染程度评价研究[J].地理科学, 1998, 18(1):16-24. http://www.wanfangdata.com.cn/details/detail.do?_type=perio&id=QK199800046900
-
图(5)
表(5)
计量
- 文章访问数: 644
- PDF下载数: 64
- 施引文献: 0