

COASTLINE CHANGES AND THEIR ORIGIN IN THE SOUTHERN HAINAN ISLAND
-
摘要:
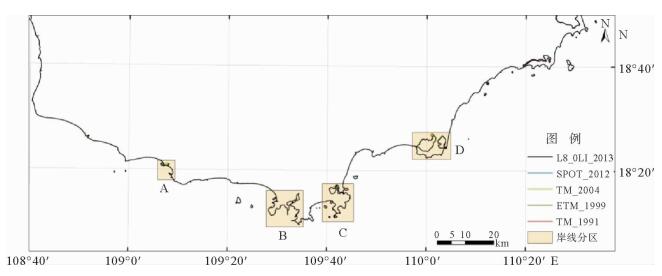
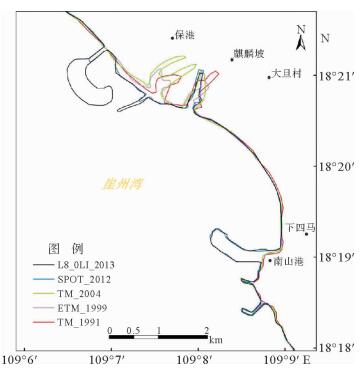
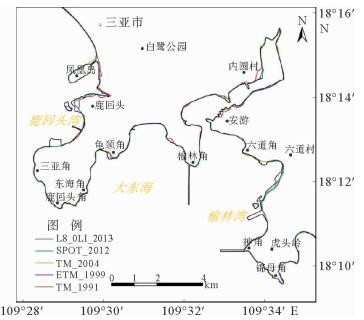
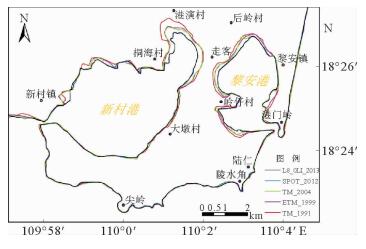
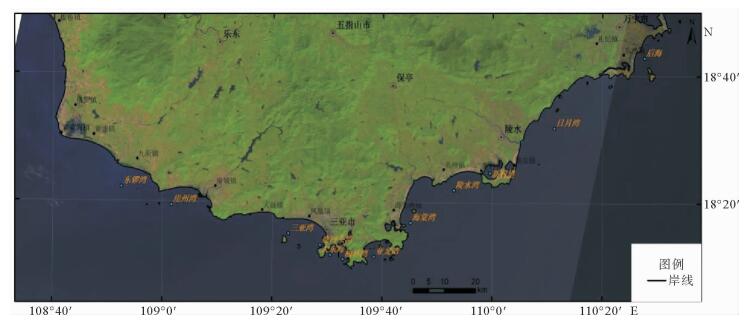
海岸带是陆地和海洋相互作用的地带,是人类活动最为活跃、经济相对发达的地区,同时也是自然生态环境相对脆弱、资源环境承载力相对有限的地区。海岸线的变化情况研究对海岸带资源开发与保护有着重要的意义, 而遥感技术对海岸线的动态监测具有独特的优势。通过对多源遥感影像数据进行挖掘,对1991—2013年岸线变化情况进行研究,解译出5个时相的海南岛南部海岸线,统计了岸线变化趋势,并分析了典型区岸线变化原因。研究表明:从总体上看,岸线总长度在1991—2013年间变化不大,在560~600 km之间,波动很小;但局部岸线变化比较大,主要是随着城市建设的发展而围海造地、码头建设以及鱼塘围垦所引起的。
Abstract:Coastal zone, the interaction zone between land and sea, is the most active and economically developed area on the earth. It, however, is also a region with fragile ecological environment and relatively limited carrying capacity of resources and environment. The study of the variation of the coastline is of great significance to the development and protection of coastal resources. Remote sensing technology, which is macroscopic and fast, has unique advantages for repetitive observation of an area. It does not need long-term investigations in waters and surface conditions; compared with the traditional methods. The remote sensing monitoring of coastline changes is cost saving, and may bring forward high economic and social benefits. According to the multi-source remote sensing image data, we discovered four periods of coastline around the Southern Hainan Island. The change trend and origin are also studied. It is found that little of the total length has been changed in the years from 1991 to 2013. It fluctuated between 560 km and 600 km, and in fact, is very small. However, from a local point of view, the change in coastline length may be relatively large due to land reclamation, coastal construction and urban growth.
-
Key words:
- Hainan Island /
- remote sensing /
-
/ - coastline changes
-

-
表 1 传感器信息
Table 1. Remote sensor information
卫星传感器 波段 波长范围 波长属性 空间分辨率 标准宽幅/km×km Landsat 5TM 1 0.45~0.53 蓝 30 185×185 2 0.52~0.60 绿 30 185×185 3 0.63~0.69 红 30 185×185 4 0.76~0.90 近红外 30 185×185 5 1.55~1.75 短红外 30 185×185 6 10.40~12.50 热红外 120 185×185 7 2.08~2.35 短波红外 30 185×185 SPOT-5 HRG 1 0.50~0.59 绿 10 60×60 2 0.61~0.68 红 10 60×60 3 0.78~0.89 近红外 10 60×60 4 1.58~1.75 短红外 20 60×60 Landsat ETM+ 1 0.45~0.53 蓝 30 185×185 2 0.52~0.60 绿 30 185×185 3 0.63~0.69 红 30 185×185 4 0.76~0.90 近红外 30 185×185 5 1.55~1.75 短红外 30 185×185 61、62 10.40~12.50 热红外 60 185×185 7 2.09~2.35 短波红外 30 185×185 8 0.52~0.90 全色 15 185×185  下载: 导出CSV
表 2 遥感影像数据信息
Table 2. Remote sensing image data
影像类型及 主要时相编号
景数 编号 成像时间 波段数 分辨率/m 备注 SPOT 8 1 2013-01-17 4 10 SPOT5多光谱10 m 2 2013-10-04 3 2011-03-21 5 10/20 SPOT4全色波段 10m
4 2012-12-15 5 2010-07-20 6 2010-07-20 多光谱20 m 7 2012-12-25 8 2012-11-03 Landsat8_OLI 2 P124R47 2013-10-26 11 30/15 全色波段15 m P123R47 2013-12-06 TM(2004) 2 P124R47 2004-12-20 7 30 P123R47 2004-02-13 ETM(2000) 2 P124R47 1999-12-31 8 30/15 全色波段15 m P123R47 1999-12-24 TM(1990) 2 P124R47 1991-10-30 7 30
下载: 导出CSV
表 3 遥感影像几何校正误差统计
Table 3. Geometric correction for remote sensing image errors
影像 分辨 率/m
编号 控制 点数
X误 差/m
Y误 差/m
总RMS 误差/
m
总像 元误
差/个
SPOT5 10 1 15 6.43 2.33 6.83 0.68 2 18 6.31 4.28 7.63 0.76 SPOT4 10/20 3 18 4.71 2.77 5.47 0.55 4 18 3.47 3.41 4.87 0.49 5 18 6.05 3.59 7.03 0.70 6 18 1.78 2.67 3.21 0.32 7 21 6.28 3.94 7.41 0.74 8 19 3.68 4.09 5.51 0.55
下载: 导出CSV
表 4 海岸线长度的变
Table 4. Comparison of coastline changes
影像时相 岸线总长度/km L8_OLI(2013) 597.93 SPOT(2012) 575.92 TM(2004) 568.77 ETM(1999) 565.02 TM(1991) 563.14
下载: 导出CSV
-
[1] 姜 义,李建芬,康 慧,等.渤海湾西岸近百年来海岸线变迁遥感分析[J]. 国土资源遥感,2003,58(4):54-58. doi: 10.3969/j.issn.1001-070X.2003.04.014
[2] 蔡则健, 吴曙亮. 江苏海岸线演变趋势遥感分析[J]. 国土资源遥感, 2002(3):19-23. doi: 10.3969/j.issn.1001-070X.2002.03.006
[3] 杨金中, 李志中, 赵玉灵. 杭州湾南北两岸岸线变迁遥感动态调查[J]. 国土资源遥感, 2002(1):23-28. doi: 10.3969/j.issn.1001-070X.2002.01.006
[4] 李 静, 张 鹰. 基于遥感测量的海岸线变化与分析[J].河海大学学报: 自然科学版, 2012,40(2):224-228. http://www.wanfangdata.com.cn/details/detail.do?_type=perio&id=hhdxxb201202019
[5] 赖国棣.泉州湾海岸线变迁遥感监测研究[J].福建地质, 2015 ,34(4):322-328. doi: 10.3969/j.issn.1001-3970.2015.04.008
[6] 肖 燚,陈圣宾,张 路,等. 基于生态系统服务的海南岛自然保护区体系规划[J]. 生态学报, 2011,31(24):7357-7369. http://www.wanfangdata.com.cn/details/detail.do?_type=perio&id=stxb201124004
[7] 袁建平,余龙师,邓广强,等.海南岛地貌分区和分类[J].海南大学学报:自然科学版,2006,24(4):364-370. http://www.wanfangdata.com.cn/details/detail.do?_type=perio&id=hainandxxb200604011
[8] Cui B L, Li X Y. Coastline change of the Yellow River estuary and its response to the sediment and run off(1976-2005)[J]. Geomorphology, 2011,127:32-40. doi: 10.1016/j.geomorph.2010.12.001
[9] 刘 雪,马妍妍,李广雪,等.基于卫星遥感的长江口岸线演化分析[J].海洋地质与第四纪地质,2013,33(2):17-23. http://www.wanfangdata.com.cn/details/detail.do?_type=perio&id=hydzydsjdz201302003
[10] 马宏伟,冯雨林,崔 健,等.基于遥感和 GIS技术的辽河三角洲岸线变迁与成因分析[J].地质通报,2014,33(10):1578-1581. doi: 10.3969/j.issn.1671-2552.2014.10.014
[11] 王 琎,吴志峰,李少英,等.珠江口湾区海岸线及沿岸土地利用变化遥感监测与分析[J].地理科学,2016,36(12):1903-1911. http://www.wanfangdata.com.cn/details/detail.do?_type=perio&id=dlkx201612016
[12] Li X J, Damen M C J.Coastline change detection with satelliteremote sensing for environmental management of the Pearl River Estuary, China[J].Journal Marine Systems,2010,82:S54-S61. doi: 10.1016/j.jmarsys.2010.02.005
[13] 张晓祥,王伟玮,严长清,等.南宋以来江苏海岸带历史海岸线时空演变研究[J].地理科学,2014,34(3):344-351. http://www.wanfangdata.com.cn/details/detail.do?_type=perio&id=dlkx201403013
[14] 高 义,王 辉,苏奋振,等.我国大陆海岸线近时空变化分析[J].海洋学报,2013,35(6):31-42. doi: 10.3969/j.issn.0253-4193.2013.06.004
[15] 孙钦帮,苏媛媛,马 军,等.长兴岛海岸线变化遥感动态监测及分形特征[J].海洋环境科学,2011,30(3):389-393. doi: 10.3969/j.issn.1007-6336.2011.03.019
[16] 王大鹏,邴智武,李艳斌,等.基于多源遥感数据的辽东湾北部海岸线变化监测与分析[J].地质与资源,2015,24(4):365-368. doi: 10.3969/j.issn.1671-1947.2015.04.013
[17] 王贵明, 董裕国. 珠江韩江三角洲海岸变迁遥感解译对比研究[J].海洋科学,1997(4):50-53. http://www.cqvip.com/qk/90010X/199704/2586222.html
[18] 王学平.遥感图像几何校正原理及效果分析[J].计算机应用与软件,2008,25(9):102-105. doi: 10.3969/j.issn.1000-386X.2008.09.038
[19] 许家琨,刘雁春,许希启,等. 平均大潮高潮面的科学定位和现实描述[J]. 海洋测绘,2007,27(6):19-24. http://www.wanfangdata.com.cn/details/detail.do?_type=perio&id=hych200706006
[20] Zhu X G. Remote sensing monitoring of coastline changes in Pearl River Estuary[J]. Marine Environ-Mental Science, 2002, 21(2): 19-22.
-
图(6)
表(4)
计量
- 文章访问数: 1100
- PDF下载数: 81
- 施引文献: 0