

Analysis of heavy metal content and ecological risk in surface seawater of Wuchuan coastal area, Guangdong Province
-
摘要:
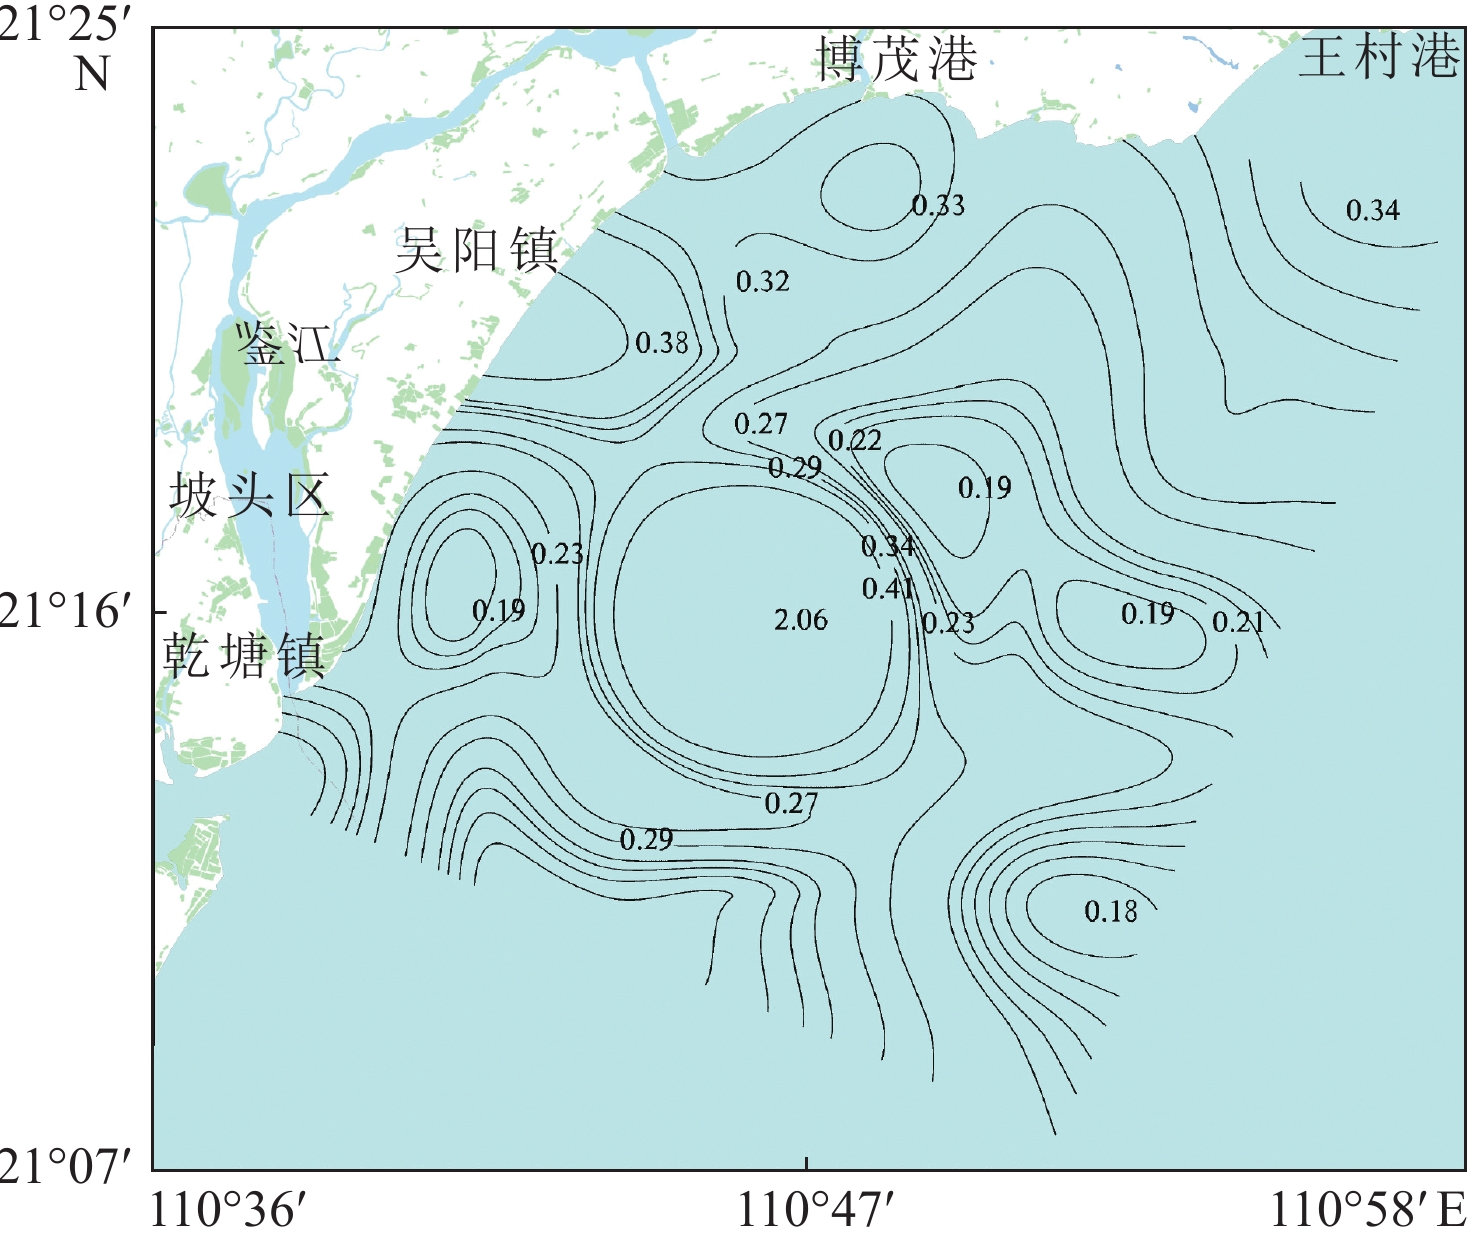
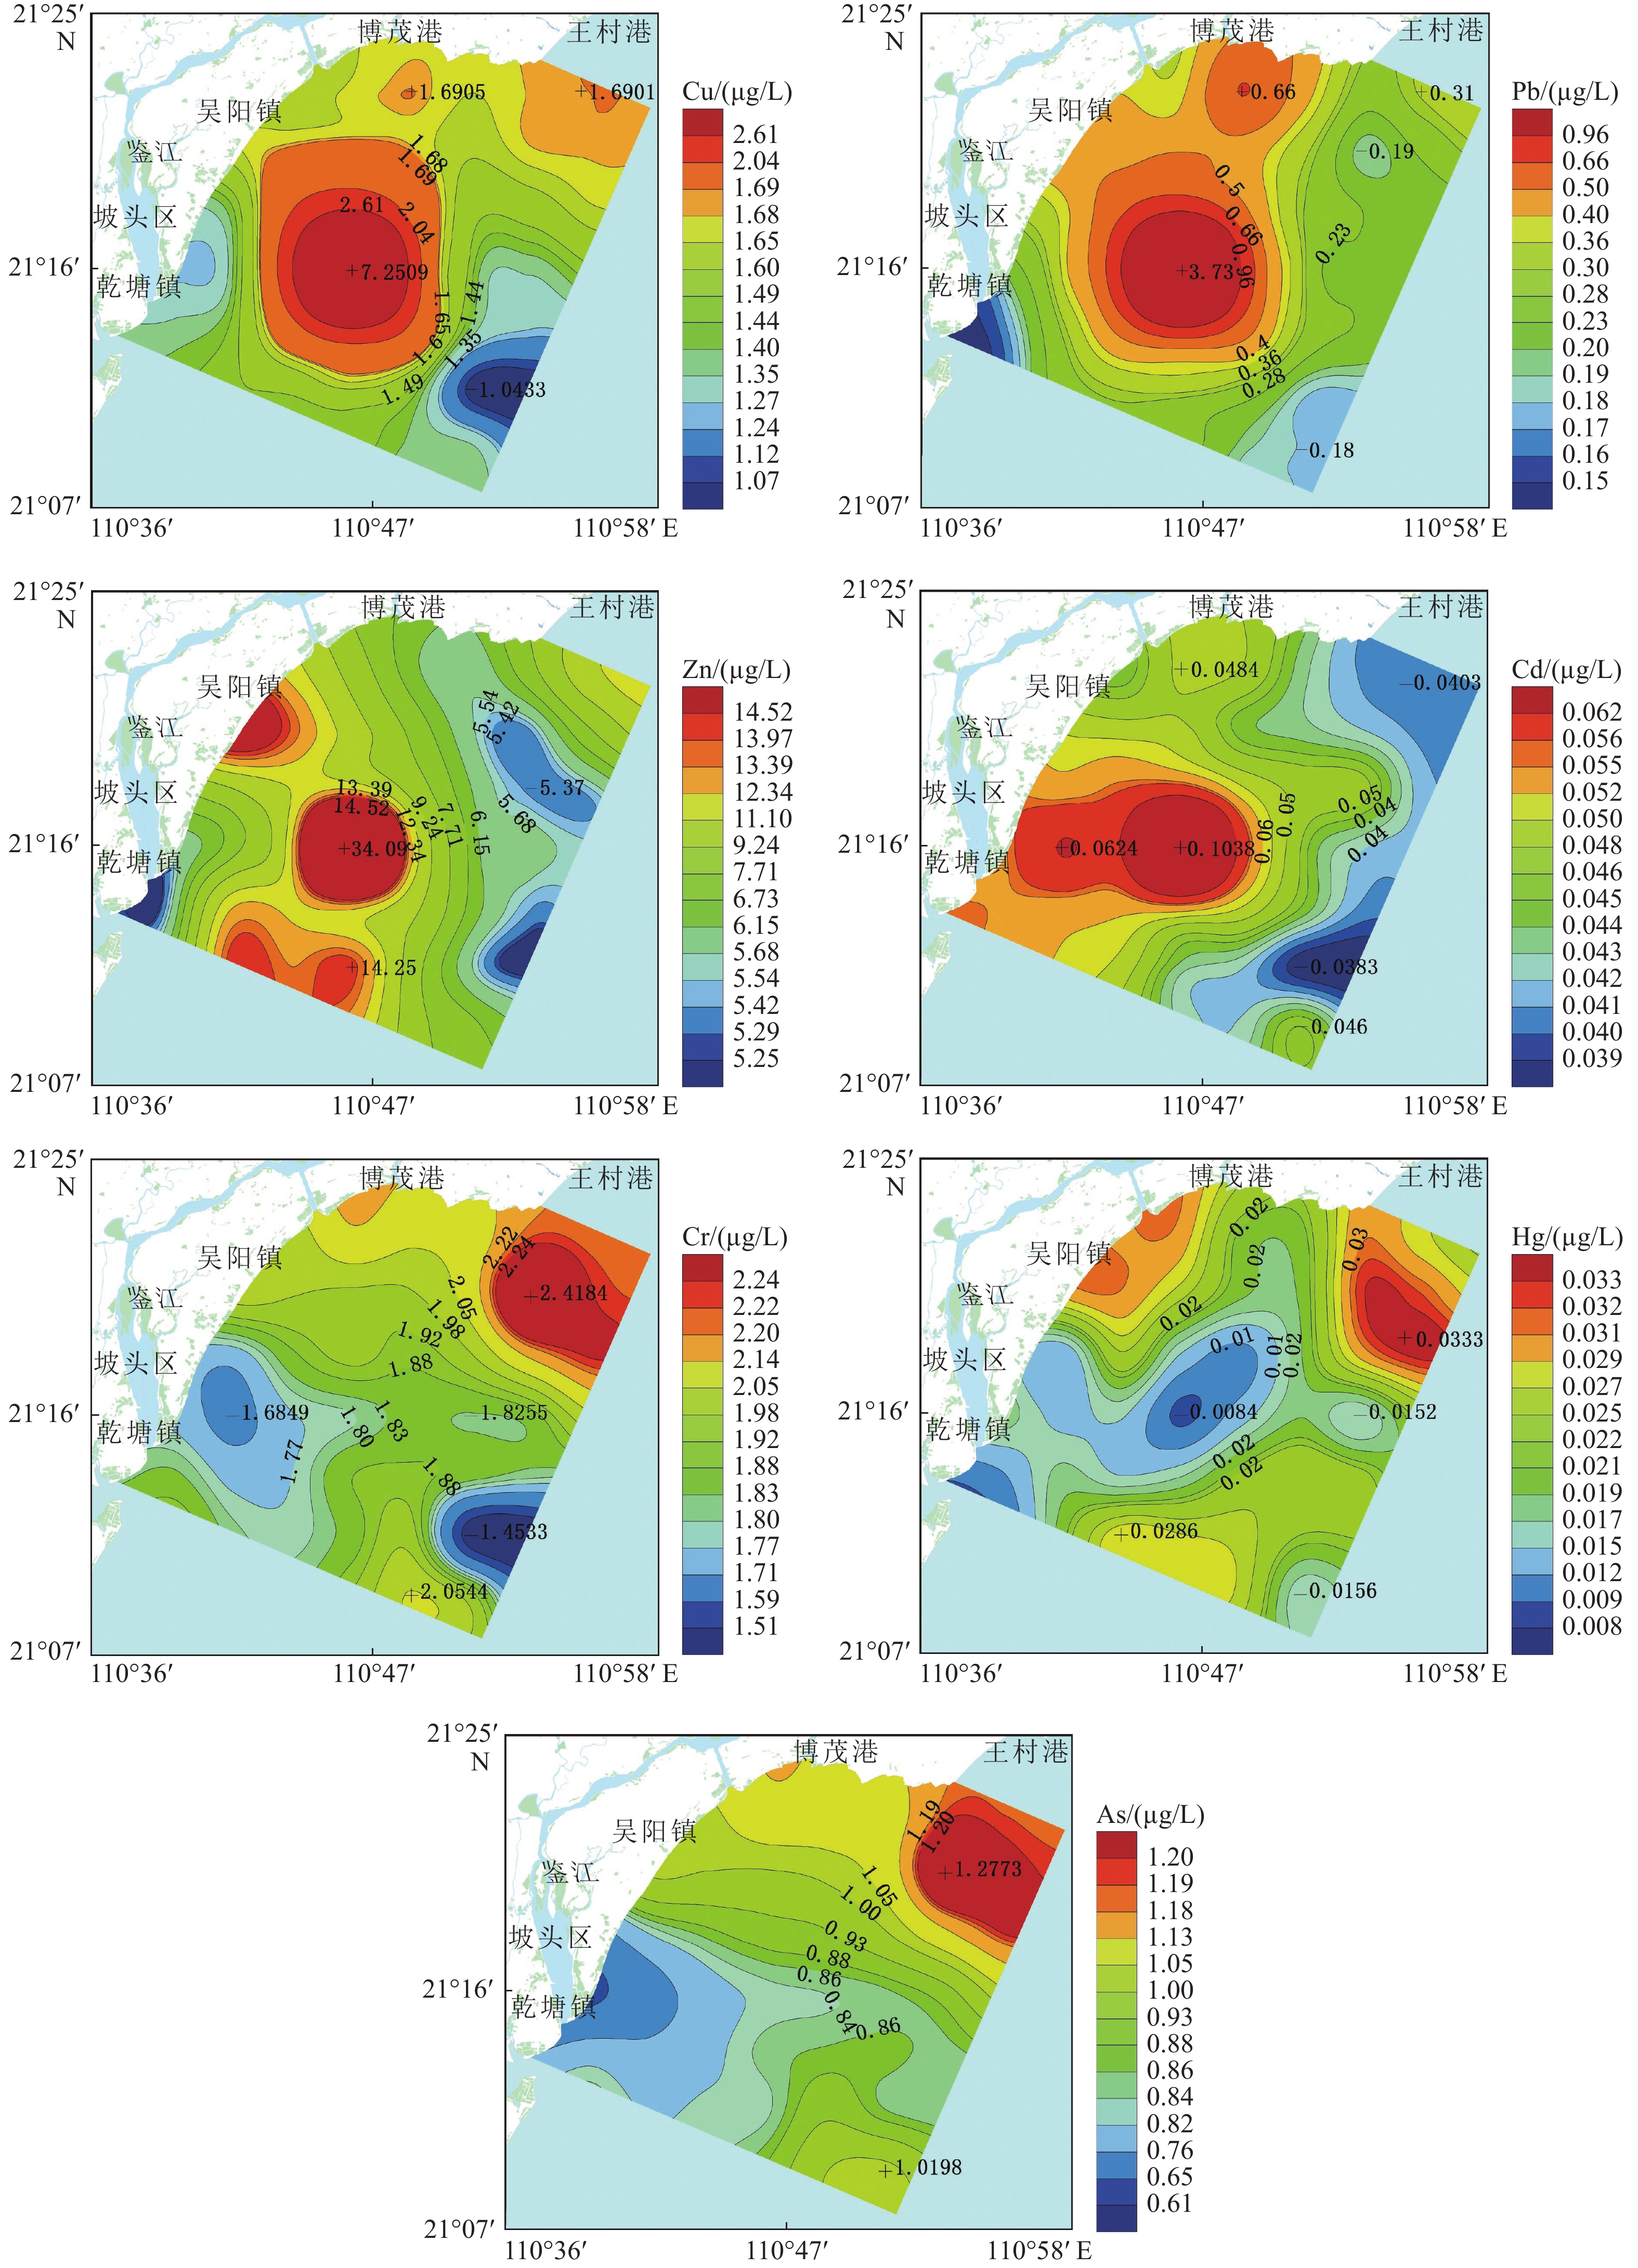
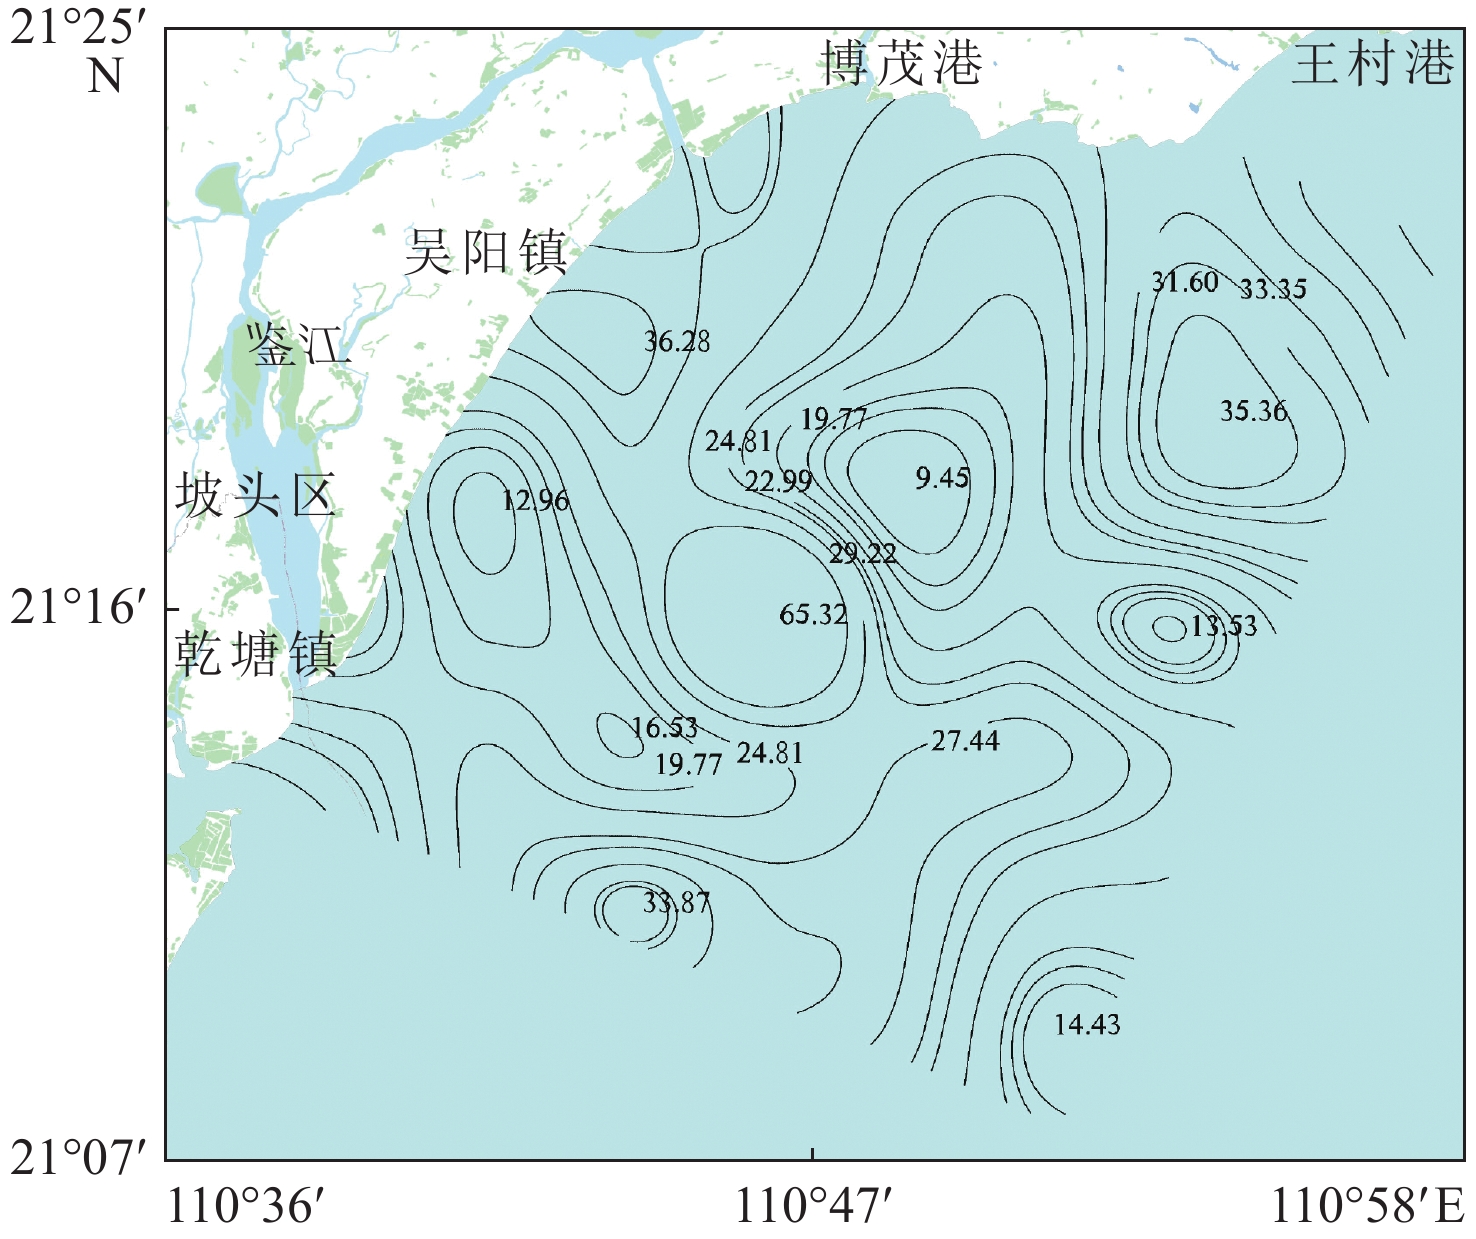
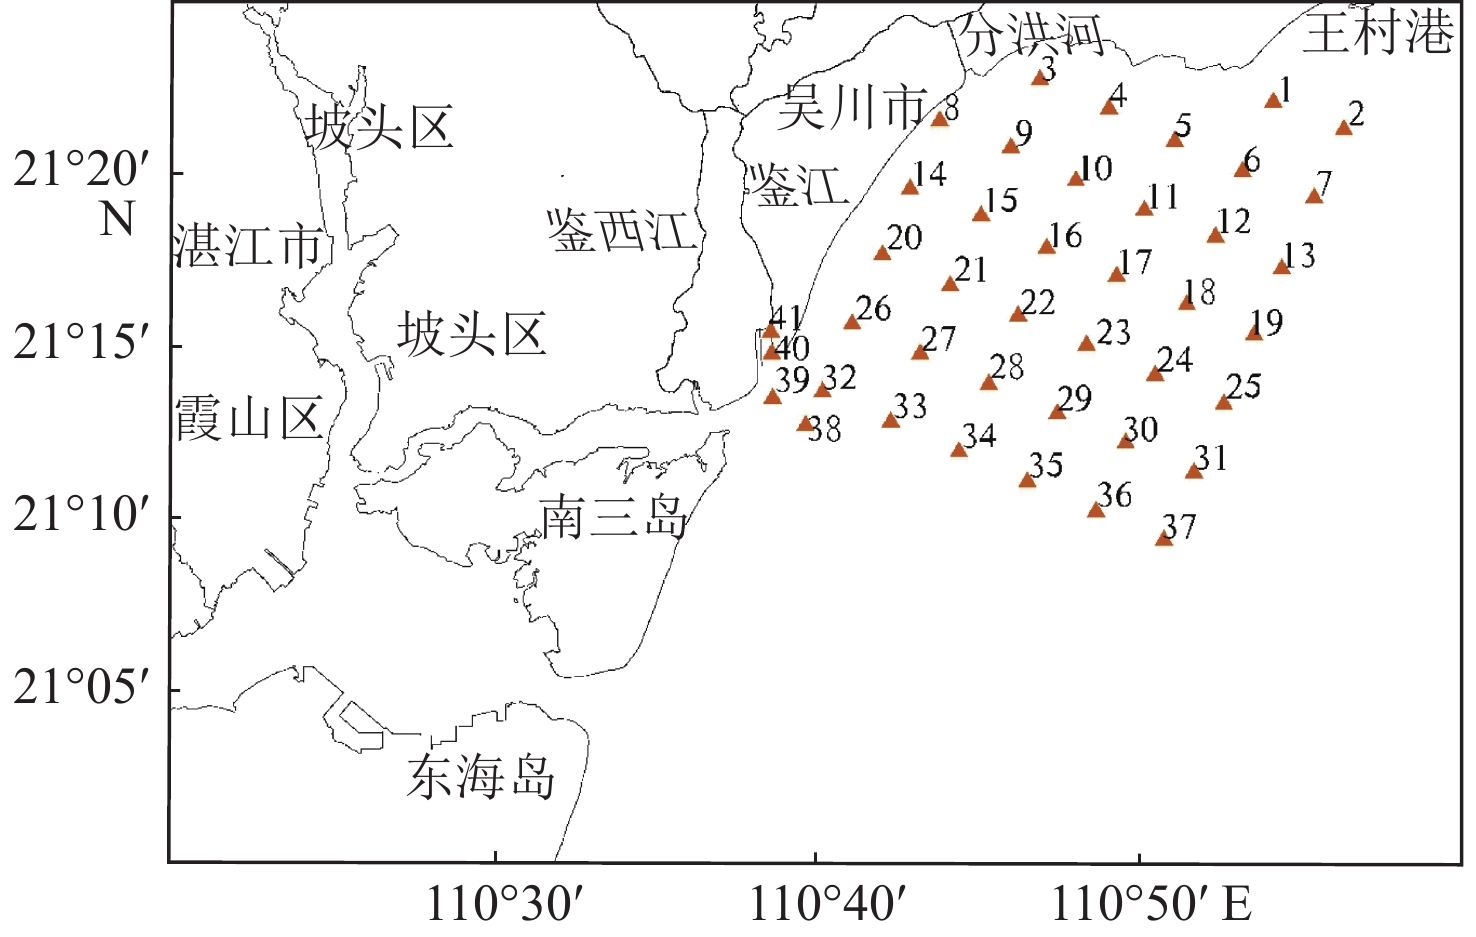
为了解广东吴川近岸海域重金属含量现状及其潜在风险,以便有针对性地对重金属污染进行防控,于2020年10月采集了吴川海域41个站位的表层海水样,运用综合指数法、HAKANSON潜在生态风险指数法和相关性分析法评价了其重金属污染程度和潜在生态风险。结果表明:Cu含量范围为0.48~14.1 μg/L,平均含量为1.75 μg/L;Pb含量范围为0.07~7.79 μg/L,平均含量为0.44 μg/L;Zn含量范围为3.98~65.8 μg/L,平均含量为9.22 μg/L;Cd含量范围为0.03~0.17 μg/L,平均含量为0.05 μg/L;Cr含量范围为0.62~2.69 μg/L,平均含量为1.92 μg/L;Hg含量范围为0~0.039 μg/L,平均含量为0.021 μg/L;As含量范围为0.39~1.42 μg/L,平均含量为0.93 μg/L。吴川海域各重金属元素平均含量均未超过中国海水水质一类标准。通过与国内外其他海域表层重金属含量的比较,吴川海域表层海水重金属含量整体处于中低水平。按其相关性可将吴川海域重金属元素分为3类:第1类为Cu-Pb-Zn-Cd组合,第2类为Cr-As组合,第3类为Hg元素。第1类重金属元素主要来源可能为海域内来往船舶及其燃烧尾气的大气沉降,第2类重金属元素可能主要来源于沿岸养殖场排放的养殖废水和溶解于海水的农药、化肥等农业活动用品。吴川近岸海域综合污染指数(WQI)平均值为0.31,整体污染程度为清洁。单项潜在生态风险指数(Eri)介于0.2~38.95,综合潜在生态风险指数(RI)介于6.65~65.32,整体生态危害等级为轻微。
Abstract:To understand the status and potential risks of heavy metal content in the coastal waters of Wuchuan, Guangdong Province, surface seawater samples were collected from 41 stations in October 2020, and the degree of heavy metal pollution and potential ecological risks were evaluated by comprehensive index method, Hakanson potential ecological risk index method, and correlation analysis method. The results show that the content of Cu ranged 0.48-14.1 μg/L (1.75 μg/L on average), Pb 0.07-7.79 μg/L (0.44 μg/L), Zn 3.98-65.8 μg/L (9.22 μg/L), Cu 0.48-14.1 μg/L (1.75 μg/L), Cd 0.03-0.17 μg/L (0.05 μg/L), Cr 0.62-2.69 μg/L (1.92 μg/L), Hg 0-0.039 μg/L (0.021 μg/L), As 0.39-1.42 μg/L (0.93 μg/L). The average content of heavy metal elements in Wuchuan sea area did not exceed the first-class benchmark of China’s national marine water quality criteria. By comparing the contents of heavy metals in the surface waters of other sea areas in China and the world, the contents of heavy metals in the surface waters of Wuchuan sea area are generally at a medium or low level. According to their correlation, the heavy metal elements in Wuchuan sea area were divided into three types: Cu-Pb-Zn-Cd assemblage, Cr-Hg-As assemblage, and Hg element. The main source of the first type may be the atmospheric deposition from marine vessel emission in the sea area, and the second type may be mainly from aquaculture wastewater from coastal farms and agricultural activities using pesticides and fertilizers. The average comprehensive pollution index of the Wuchuan coastal waters was 0.31, indicating an overall clean state of pollution. The single potential ecological risk index ranged from 0.2 to 38.95, and the overall potential ecological risk index ranged from 0.59 to 87.38, showing that the overall ecological hazard scale was low.
-
Key words:
- Wuchuan sea area /
- surface seawater /
- heavy metal /
- ecological risk
-

-
表 1 海水重金属综合污染指数与污染程度的关系
Table 1. The sea water quality index (WQI) and the contamination status indicated
综合水污染指数( WQI) 范围 污染程度 WQI≤1 清洁 1<WQI≤2 轻度污染 2<WQI≤3 中度污染 WQI>3 严重污染  下载: 导出CSV
表 2 Eri和RI与生态风险等级的对应关系
Table 2. Relationship among Eri (single potential ecological risk index), RI (overall potential risk index) and ecological risk level
Eri RI 生态风险等级 E <40 RI<150 轻微 40≤Eri<80 150≤RI<300 中等 80≤Eri<160 300≤RI<600 强生 160≤Eri<320 RI≥600 很强 Eri≥320 极强
下载: 导出CSV
表 3 吴川海域表层海水重金属含量分布特征
Table 3. Distribution characteristics of heavy metals in surface waters of Wuchuan sea areas
μg/L 元素 Cu Pb Zn Cd Cr Hg As 最小值 0.48 0.07 3.98 0.03 0.62 ND 0.39 最大值 14.1 7.79 65.8 0.17 2.65 0.039 1.42 平均值 1.75 0.44 9.22 0.05 1.92 0.021 0.93 第1类海水水质标准 5 1 20 1 50 0.05 20 第1类海水水质标准达标率/% 97.6 97.6 97.6 100 100 100 100
下载: 导出CSV
表 4 重金属元素相关性分析
Table 4. The relativity of heavy metals
元素 Cu Pb Zn Cd Cr Hg As Cu 1 Pb 0.988** 1 Zn 0.867** 0.873** 1 Cd 0.888** 0.896** 0.770** 1 Cr −0.015 −0.096 −0.068 −0.015 1 Hg −0.181 −0.215 −0.065 −0.239 0.405** 1 As −0.005 −0.067 −0.05 −0.141 0.729** 0.354* 1 注:* 在 0.05 级别(双尾)相关性显著;** 在 0.01 级别(双尾)相关性显著。
下载: 导出CSV
表 5 不同海域表层海水中重金属含量比较
Table 5. Comparison of heavy-metal concentrations in seawater of different sea areas
μg/L 元素 Cu Pb Zn Cd Cr Hg As 本研究 1.75 0.44 9.22 0.05 1.92 0.021 0.93 黄骅[9] 2.09 1.20 25.10 0.047 0.39 0.036 0.80 滨海县[29] 2.23 0.70 9.18 0.08 — 0.033 1.99 连云港[30] 25 100 7.3 43 52 — — 红海湾[31] 1.8 1.6 24.5 0.033 0 0.0015 2.4 钦州市[5] 5.06 0.70 12.5 0.12 2.38 0.048 0.61 大亚湾[24] 0.87 0.59 7.20 0.14 0.97 0.060 0.74 灯楼角[24] 0.73 1.06 5.83 0.043 0.96 0.069 0.58 红海北部[32] 3.24 0.59 10.14 0.24 — — —
下载: 导出CSV
-
[1] 时翠,林进清,薛峭. 雷州半岛近岸海域水环境质量综合评价[J]. 热带地理,2013,33(4):202-203. doi: 10.13284/j.cnki.rddl.002352
[2] 薛峭,何健,时翠,等. 雷州半岛近岸海水水质评价[J]. 安徽农业科学,2014,42(1):387-393.
[3] 付东洋,杨锋,梁晓军,等. 雷州半岛近海水质环境关键因子时空变化与评价[J]. 广东海洋大学学报,2014,36(6):58-64. doi: 10.3969/j.issn.1673-9159.2014.06.010
[4] 巩慧敏,刘永,肖雅元,等. 近海海水和表层沉积物重金属污染与生态风险评价:以海南新村港为例[J]. 农业现代化研究,2018,39(4):700-708.
[5] 李萍,郭钊,莫海连. 广西近岸海域海水表层重金属的含量分布特征及污染评价[J]. 科技通报,2018,34(3):223-233.
[6] 崔衍波,冯永亮,刘群群,等. 东营市三个河口区域表层海水重金属的分布与生态风险评价[J]. 中国海洋大学学报,2019,49(1):93-101.
[7] 雷富,张荣灿,陈宪云,等. 夏季广西北部湾近岸海域海水和表层沉积物中重金属污染现状及评价[J]. 海洋技术,2013,32(2):94-100.
[8] 徐轶肖,谢谊,赵鹏,等. 北部湾涠洲岛海水重金属污染现状研究[J]. 生态环境学报,2018,27(5):908-915.
[9] 刘宪斌,朱浩然,郭夏青,等. 河北黄骅近岸海域表层海水重金属污染特征及生态风险评价[J]. 安全与环境学报,2020,20(2):747-755.
[10] MAHALAKSHMI N,REVATHY K,RAGHUNATHAN C. Distribution of heavy metal in marine water and sediment of Bay of Bengal off ennore seacoast subjected to different pollution loads by environment,north-east coast of India[J]. Journal of Experimental Zoology India,2012,15(2):387-394.
[11] 杨文超,黄道建,陈继鑫,等. 大亚湾海域2009—2018 年重金属时空分布及污染评价价[J]. 华南师范大学学报,2020,52(5):65-75.
[12] 柯东胜. 粤西沿海海水、底质、生物体重重金属含量及其分布状况的研究[J]. 海洋通报,1985,4(4):20-24.
[13] 刘太胜,杨波,何宁,等. 茂名市海水养殖尾水污染综合评价研究[J]. 生态科学,2021,40(4):195-201.
[14] HAKANSON L. An ecological risk index for aquatic pollution control:a sedimentological approach[J]. Water Research,1980,14(8):975-1001. doi: 10.1016/0043-1354(80)90143-8
[15] 国家海洋局, 国家海洋环境监测中心, 中国国家标准化管理委员会. 海洋监测规范第3 部分: 样品采集、贮存与运输: GB 17378.3—2007[S]. 北京: 中国标准出版社, 2007.
[16] 国家海洋局. 海洋监测技术规程第1部分: 海水: HY/T147.1—2013[S]. 北京: 中国标准出版社, 2013.
[17] 国家海洋局, 国家海洋环境监测中心, 中国国家标准化管理委员会. 海洋监测规范第4部分: 海水分析: GB 17378.4—2007[S]. 北京: 中国标准出版社, 2007.
[18] 国家环境保护局, 国家海洋局. 海水水质标准: GB 3097—1997[S]. 北京: 中国标准出版社, 1997.
[19] 王毅,王少鹏,王英辉,等. 防城港近岸海域及河口溶解态重金属污染特征[J]. 广西大学学报,2018,43(5):2069-2078.
[20] 周笑白,梅鹏蔚,彭露露,等. 渤海湾表层沉积物重金属含量及潜在生态风险评价[J]. 生态环境学报,2015,24(3):452-456. doi: 10.16258/j.cnki.1674-5906.2015.03.012
[21] 刘慧杰,刘文君,刘继平,等. 南中国海表层海水重金属含量及其潜在生态风险分析[J]. 中国环境科学,2017,37(10):3891-3898. doi: 10.3969/j.issn.1000-6923.2017.10.034
[22] 陈明,蔡青云,徐慧,等. 水体沉积物重金属污染风险评价研究进展[J]. 生态环境学报,2015,24(6):1069-1074. doi: 10.16258/j.cnki.1674-5906.2015.06.024
[23] 罗万次,苏搏,刘熊,等. 广西北仑河口红树林保护区表层海水溶解态重金属时空分布及其影响因素[J]. 海洋通报,2014,33(6):668-675. doi: 10.11840/j.issn.1001-6392.2014.06.008
[24] 杨华,王少鹏,余克服. 南海北部珊瑚生长区海水重金属污染特征[J]. 生态环境学报,2017,26(2):668-675. doi: 10.16258/j.cnki.1674-5906.2017.02.010
[25] 李洪涛,刘阳,于国庆,等. 2013年威海南部近岸海域表层海水重金属分布特征及污染评价[J]. 河北渔业,2016(8):21-28. doi: 10.3969/j.issn.1004-6755.2016.06.006
[26] 易志全,杨艺文,张际标,等. 湛江港海水中铜、锌、铅、镉的周年变化与水质评价[J]. 广东海洋大学学报,2011,31(1):73-79. doi: 10.3969/j.issn.1673-9159.2011.01.014
[27] 李劳钰,王宗灵,魏修华,等. 南黄海西部冬季表层水中的溶解态重金属分布特征分析[J]. 海洋科学进展,2009,27(2):201-210.
[28] 彭修强,项立辉,郭娜,等. 南黄海南部海域表层沉积物重金属来源解析及风险评价[J]. 环境科学学报,2015,35(11):3628-3638. doi: 10.13671/j.hjkxxb.2015.0425
[29] 裘奕斐,王静,徐敏. 江苏滨海县近岸海域海水、沉积物和生物体重金属分布及健康风险评价[J]. 南京师大学报(自然科学版),2021,44(1):71-78. doi: 10.3969/j.issn.1001-4616.2021.01.011
[30] 许星鸿,姚海洋,孟霄,等. 连云港附近海域海水、表层沉积物和水产品的重金属污染及生态风险评价[J]. 海洋湖沼通报,2019,5:110-116. doi: 10.13984/j.cnki.cn37-1141.2019.05.014
[31] 孙钦帮,高范,王阳,等. 广东红海湾海域表层水环境中重金属含量特征及污染评价[J]. 海洋环境科学,2018,37(5):685-698. doi: 10.12111/j.cnki.mes20180509
[32] ALI A A M,HAMED M A,ABD EL-AZIM H. Heavy metals distribution in the coral reef ecosystems of the Northern Red Sea[J]. Helgoland Marine Research,2011,65(1):67-80. doi: 10.1007/s10152-010-0202-7
-
图(4)
表(5)
计量
- 文章访问数: 1512
- PDF下载数: 88
- 施引文献: 0