

Theoretical potential assessment of CO2 geological utilization and storage in the Sichuan Basin
-
摘要:
结合CO2地质利用与封存技术机理,在国际权威潜力评估公式的基础上,系统地提出了适合中国地质背景的次盆地尺度CO2封存潜力评估方法及关键参数取值。同时,以四川盆地为例,依次开展了枯竭油田地质封存与CO2强化石油开采、枯竭气田与CO2强化采气、不可采煤层地质封存与CO2驱替煤层气,以及咸水层地质封存技术的CO2地质封存潜力。结果表明,四川盆地利用深部咸水层与枯竭天然气田CO2地质封存潜力最大,期望值分别达154.20×10⁸t和53.73×10⁸t。其中,枯竭天然气田因成藏条件好、勘探程度高、基础建设完善,为四川盆地及其周边利用枯竭气田CO2地质封存技术实现低碳减排提供了早期示范机会。CO2地质利用与封存潜力评估方法,对进一步开展全国次盆地尺度理论封存潜力评估与工程规划具有重要意义。
Abstract:Based on the mechanism of CO2 geological utilization and storage technologies and the international authoritative evalua-tion formulae, the methodology of theoretical potential assessment at the sub-basin scale is proposed in this paper, and the solutions of key parameters are provided.Meanwhile, with the Sichuan Basin as a case study, the theoretical potential of depleted oil CO2 storage and CO2-EOR, depleted gas CO2 storage and CO2-EGR, unmineable coal bed seams CO2 storage and CO2-ECBM, and deep saline aquifer CO2 storage are evaluated respectively.The results show that the total CO2 storage potential of deep saline aquifers and depleted gas fields CO2 storage could reach 154.20×10⁸t and 53.73×10⁸t on the average.Because of good traps, high degree of exploration and good infrastructures, depleted gas fields provide a great chance for carrying out demonstration or industrial CO2 geological storage proj-ects first for the CO2 resources located in the Sichuan Basin.The methodology of potential assessment of CO2 geological utilization and storage technologies has great exploring significance for sub-basin scale national potential evaluation and project planning in China.
-

-
表 1 EXTRA值在不同API条件下的计算取值
Table 1. The value of EXTRA with API different gravity
EXTRA值/% API值 5.3 < 31 1.3(API-31)+5.3 31≤API≤41 18.3 > 41  下载: 导出CSV
表 2 不同深度和API条件下PLCO2和PHCO2取值
Table 2. Four EOR cases with different depths/pressures and API gravities
深度 API PLCO2/% PHCO2/% < 2000 > 35 100 0 ≤35 66 33 > 2000 > 35 33 66 ≤35 0 100
下载: 导出CSV
表 3 枯竭油田CO2地质封存潜力
Table 3. Storage potential of CO2 geological storage in depleted oil fields
构造单元 OOIP/108t 原油密度/kg·m-3 原油储量体积/m3 B (-) 压力/MPa 温度/℃ ρCO2/(kg·m-3) Eoil GCO2/108t 川中低平构造区 0.58 850 1.18 21.26 64.42 712.63 0.75 0.57 0.58 川北低平构造区 0.17 850 1.18 21.26 64.42 712.63 0.75 0.17 0.17 合计 0.74
下载: 导出CSV
表 4 CO2强化石油开采封存潜力
Table 4. CO2-EOR geological storage potential
构造单元 API EXTRA/% PLCO2/% PHCO2/% Eoil GCO2-EOR/108t 川中低平构造区 34.97 10.46 33 66 0.75 0.16 川北低平构造区 34.97 10.46 33 66 0.75 0.05 合计 0.21
下载: 导出CSV
表 5 中国不同地区沉积盆地CO2-EGR驱替效率取值建议[9]
Table 5. value of CO2-EGR for different sedimentary basins in China
地区 沉积盆地 驱替系数 东部 东北地区、华北盆地、南襄盆地、江汉盆地、苏北盆地 0.42 中部 鄂尔多斯盆地、四川盆地、楚雄盆地 0.63 西北 新疆、青海和甘肃地区 0.55 东南 三水盆地、十万大山盆地 0.66 大陆架 大陆架海域沉积盆地 0.60
下载: 导出CSV
表 6 不同煤质RCO2/CH4的取值
Table 6. The values of RCO2/CH4 of different types of coal
类型 RCO2/CH4 C 褐煤 10 1.00 不粘结煤 10 0.67 弱粘结煤 10 1.00 长焰煤 6 1.00 气煤 3 0.61 肥煤 1 0.55 焦煤 1 0.50 瘦煤 1 0.50 贫煤 1 0.50 无烟煤 1 0.50
下载: 导出CSV
表 7 CO2-ECBM技术封存效率取值建议[12]
Table 7. Storage efficiency of unmineable coal seams
P10 P50 P90 21% 37% 48%
下载: 导出CSV
表 8 四川盆地主要煤田CO2-ECBM地质封存潜力
Table 8. Storage potential of CO2 in unmineable coal seams and CO2-ECBM in Sichuan Basin
地区 GCBM/108m3 RCO2/CH4 C ρCO2std/kg·m-3 GCO2/108t GCO2-ECBM/108t P50 P50 川南黔北 5084.57 1 0.50 1.977 3.72 1.86 川渝 3471.40 1 0.50 1.977 2.54 1.27 合计 6.26 3.13
下载: 导出CSV
表 9 咸水层CO2地质封存系数取值建议[21]
Table 9. CO2 storage efficiency coefficients Esaline at regional scales of USDOE
岩性 P10 P50 P90 碎屑岩 1.2% 2.4% 4.1% 白云岩 2.0% 2.7% 3.6% 灰岩 1.3% 2.0% 2.8%
下载: 导出CSV
表 10 咸水层CO2地质封存远景区圈定一票否决指标
Table 10. Veto over key factors of deep saline saquifer CO2 geological storage prospective areas delineation
关键因素 一票否决 储集条件 单层厚度 <10m 孔隙度 <5% 渗透率 <1mD 水文地质条件 地层水矿化度 <3g/L 地下水动力条件 地下水强烈开启 地质安全性条件 活动断裂 <25km 地震动峰值加速度 ≥0.40g
下载: 导出CSV
表 11 咸水层地质封存各储层CO2封存潜力
Table 11. Storage potential of different reservoirs for deep saline aquifer CO2 storage
储层 封存潜力P50/108t 蓬莱镇组 (1.29~9.30)5.40 须二段 49.39 须四段 55.40 须六段 39.19 嘉陵江组 (2.44~4.88)3.66 飞仙关组 (0.10~1.36)0.42 长兴组 (0.14~1.12)0.37 茅口组 0.23 栖霞组 0.14 合计 154.20
下载: 导出CSV
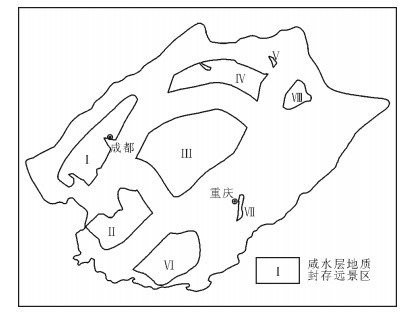
表 12 咸水层地质封存各远景区CO2封存潜力
Table 12. Storage potential of different prospective areas for deep saline aquifer CO2 storage
远景区 Ⅰ区 Ⅱ区 Ⅲ区 Ⅳ区 Ⅴ区 Ⅵ区 Ⅶ区 Ⅷ区 面积/km2 9067 7012 19732 7360 125 7731 342 1714 封存潜力期望值/108t 45.68 12.74 58.55 17.94 0.03 16.37 0.48 2.41 构造位置 川西北 川中 川东南
下载: 导出CSV
-
[1] 白冰, 李小春, 刘延锋, 等.中国CO2集中排放源调查及其分布特征[J].岩石力学与工程学报, 2006, 25(1):2918-2923.
[2] 中国21世纪议程管理中心.《第三次气候变化国家评估报告——中国二氧化碳利用技术评估报告》[M].北京:科学出版社, 2014.
[3] 张洪涛, 文冬光, 李义连, 等.中国CO2地质埋存条件分析及有关建议[J].地质通报, 2005, 24(12):1107-1110. doi: 10.3969/j.issn.1671-2552.2005.12.004 http://dzhtb.cgs.cn/ch/reader/view_abstract.aspx?flag=1&file_no=2005012221&journal_id=gbc
[4] 刘延锋, 李小春, 白冰.中国CO2煤层储存容量初步评估[J].岩石力学与工程学报, 2005, 24(16):2947-2952. doi: 10.3321/j.issn:1000-6915.2005.16.023
[5] 刘延锋, 李小春, 方志明, 等.中国天然气田CO2储存容量初步评估[J].岩土力学, 2006, 27(12):2277-2281. doi: 10.3969/j.issn.1000-7598.2006.12.037
[6] 李小春, 刘延锋, 白冰, 等.中国深部咸水含水层CO2储存优先区域选择[J].岩石力学与工程学报, 2006, 25(5):963-968. http://www.wenkuxiazai.com/doc/278f61c5aa00b52acfc7ca46.html
[7] Guo J, Wen D, Zhang S, et al. Potential and Suitability Evaluation of CO2 Geological Storage in Major Sedimentary Basins of China, and the Demonstration Project in Ordos Basin[J]. Acta Geological Si-nica (English Edition), 2015, 89(4):1319-1332. doi: 10.1111/acgs.2015.89.issue-4
[8] Wei N, Li X, Fang Z, et al. Regional Resource Distribution of On-shore Carbon Geological Utilization in China[J]. Journal of CO2 Uti-lization, 2015, 11:20-30. doi: 10.1016/j.jcou.2014.12.005
[9] Li X, Wei N, Fang Z, et al. CO2 Point Emission and Geological Storage Capacity in China[J]. Energy Procedia, 2009, 1:2793-2800. doi: 10.1016/j.egypro.2009.02.051
[10] Dahowski R T, Dooley J J, Davidson C L, et al. Building the Cost Curves for CO2 Storage:North America. Technical Report. IEA Greenhouse Gas R&D Programme, 2015[EB/OL][2016-08-03] http://www.globalccsinstitute.com/publications/building-costcurves-CO2-storage-north-america.2015.
[11] 国土资源部油气资源战略研究中心等.全国石油天然气资源评价[M].北京:中国大地出版社, 2010.
[12] Goodman F, Hakala A, Bromhal A, et al. U. S. DOE Methodology for the Development of Geologic Storage Potential for Carbon Di-oxide at the National and Regional Scale[J]. International Journal of Greenhouse Gas Control., 2011, 5:952-965. doi: 10.1016/j.ijggc.2011.03.010
[13] CSLF. Estimation of CO2 Storage Capacity in Geological Media (Phase), Prepared by the Task Force on CO2 Storage Capacity Estima-tion for the Techincal Group of the Carbon Sequestration Leadership Form[EB/OL](2007-06-15)[2016-08-03]. http://citeseerx.ist.psu.edu/viewdoc/download; jsessionid=5F350840888988FDCA7ADA39EB02EF36?doi=10.1.1.352.8121&rep=rep1&type=pdf.2007.
[14] 《中国油气田开发志》总编纂委员会. 《中国油气田开发志·卷十三:西南油气区》[M].北京:石油工业出版社, 2011.
[15] 国土资源部油气资源战略研究中心等.全国煤层气资源评价[M].北京:中国大地出版社, 2009.
[16] Reeves S R. Assessment of CO2 Sequestration and ECBM Poten-tial of U.S. Coalbeds[EB/OL][2016-08-03] https://www.osti.gov/scitech/biblio/923256.2003.
[17] Nicot J P. Evaluation of Large-scale CO2 Storage on Fresh-water Sections of Aquifers:an Example From the Texas Gulf Coast Basin[J]. International Journal of Greenhouse Gas Control., 2008, 2:582-593. doi: 10.1016/j.ijggc.2008.03.004
[18] Zhou Q, Birkholzer J T, Tsang C F, et al. A Method for Quick As-sessment of CO2 Storage Capacity in Closed and Semi-Closed Sa-line Formation[J]. International Journal of Greenhouse Gas Con-trol., 2008, 2:626-639. doi: 10.1016/j.ijggc.2008.02.004
[19] Birkholzer J T, Zhou Q, Tsang C F. Large-scale Impact of CO2 storage in Deep Saline Aquifers:A Sensitivity Study on Pressure Response in Stratified Systems[J]. International Journal of Green-house Gas Control., 2009, 3:181-194. doi: 10.1016/j.ijggc.2008.08.002
[20] IEA GHG (International Energy Agency Greenhouse Gas R&D Programme). Development of Storage Coefficients for CO2 Storage in Deep Saline Formations 2009/13[EB/OL][2016-08-03] http://www.ieaghg.org/.2007.
[21] Bachu S. Review of CO2 Storage Efficiency in Deep Saline Aqui-fers[J]. International Journal of Greenhouse Gas Control., 2015, 40:188-202. doi: 10.1016/j.ijggc.2015.01.007
-

图(3)
表(12)
计量
- 文章访问数: 889
- PDF下载数: 11
- 施引文献: 0