

Temporal and spatial variation characteristics of ecosystem service value in the Yellow River Basin
-
摘要:
研究目的 黄河流域是中国重要的生态屏障和经济地带,开展生态系统服务价值时空变化特征分析,对黄河流域生态环境保护和高质量可持续发展具有十分重要的意义。
研究方法 本文计算了黄河流域2000年、2005年、2010年、2015年、2020年的生态系统服务价值,并运用热点分析法和生态经济协调模型,探究了生态系统服务价值变化率的高值和低值聚集分布特征及黄河流域各地市生态和经济协调程度,从国土空间规划的角度提出相关建议。
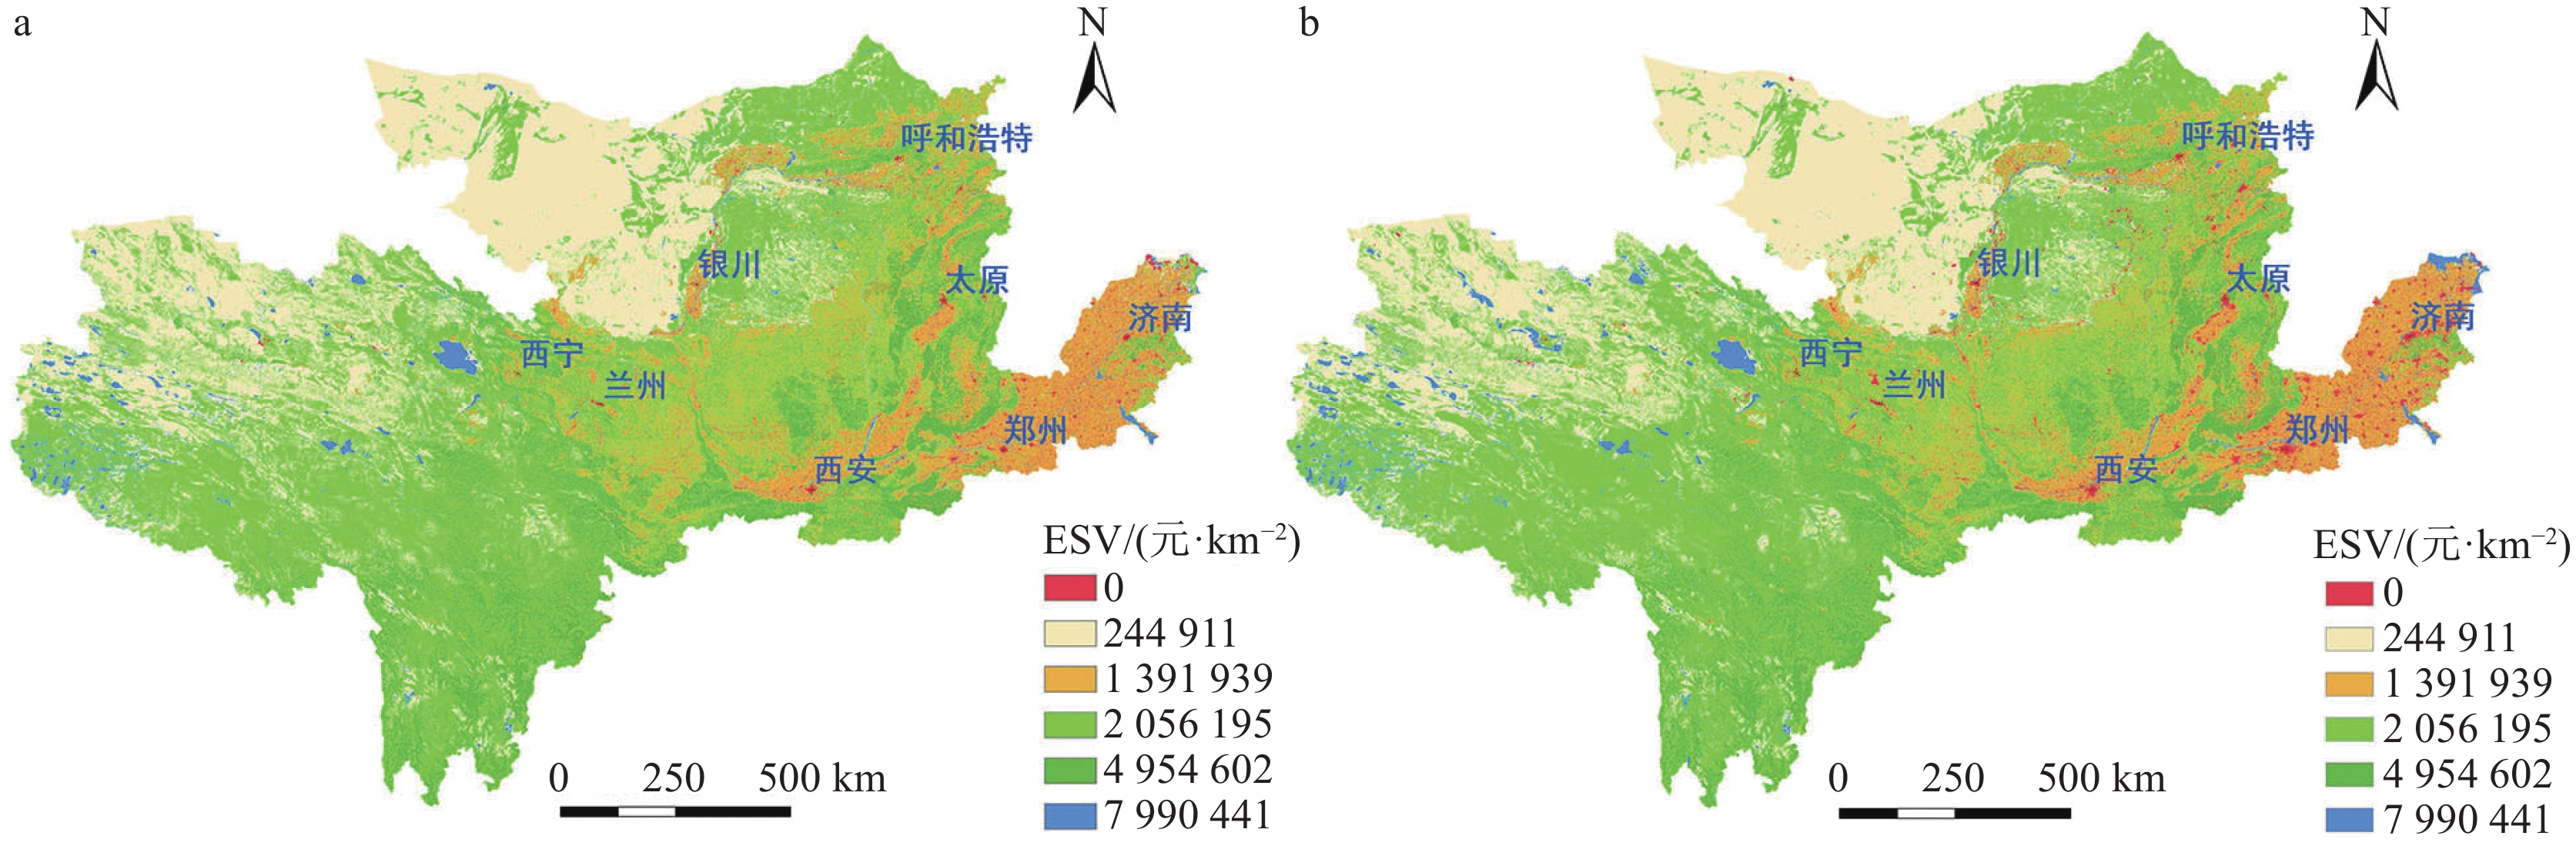
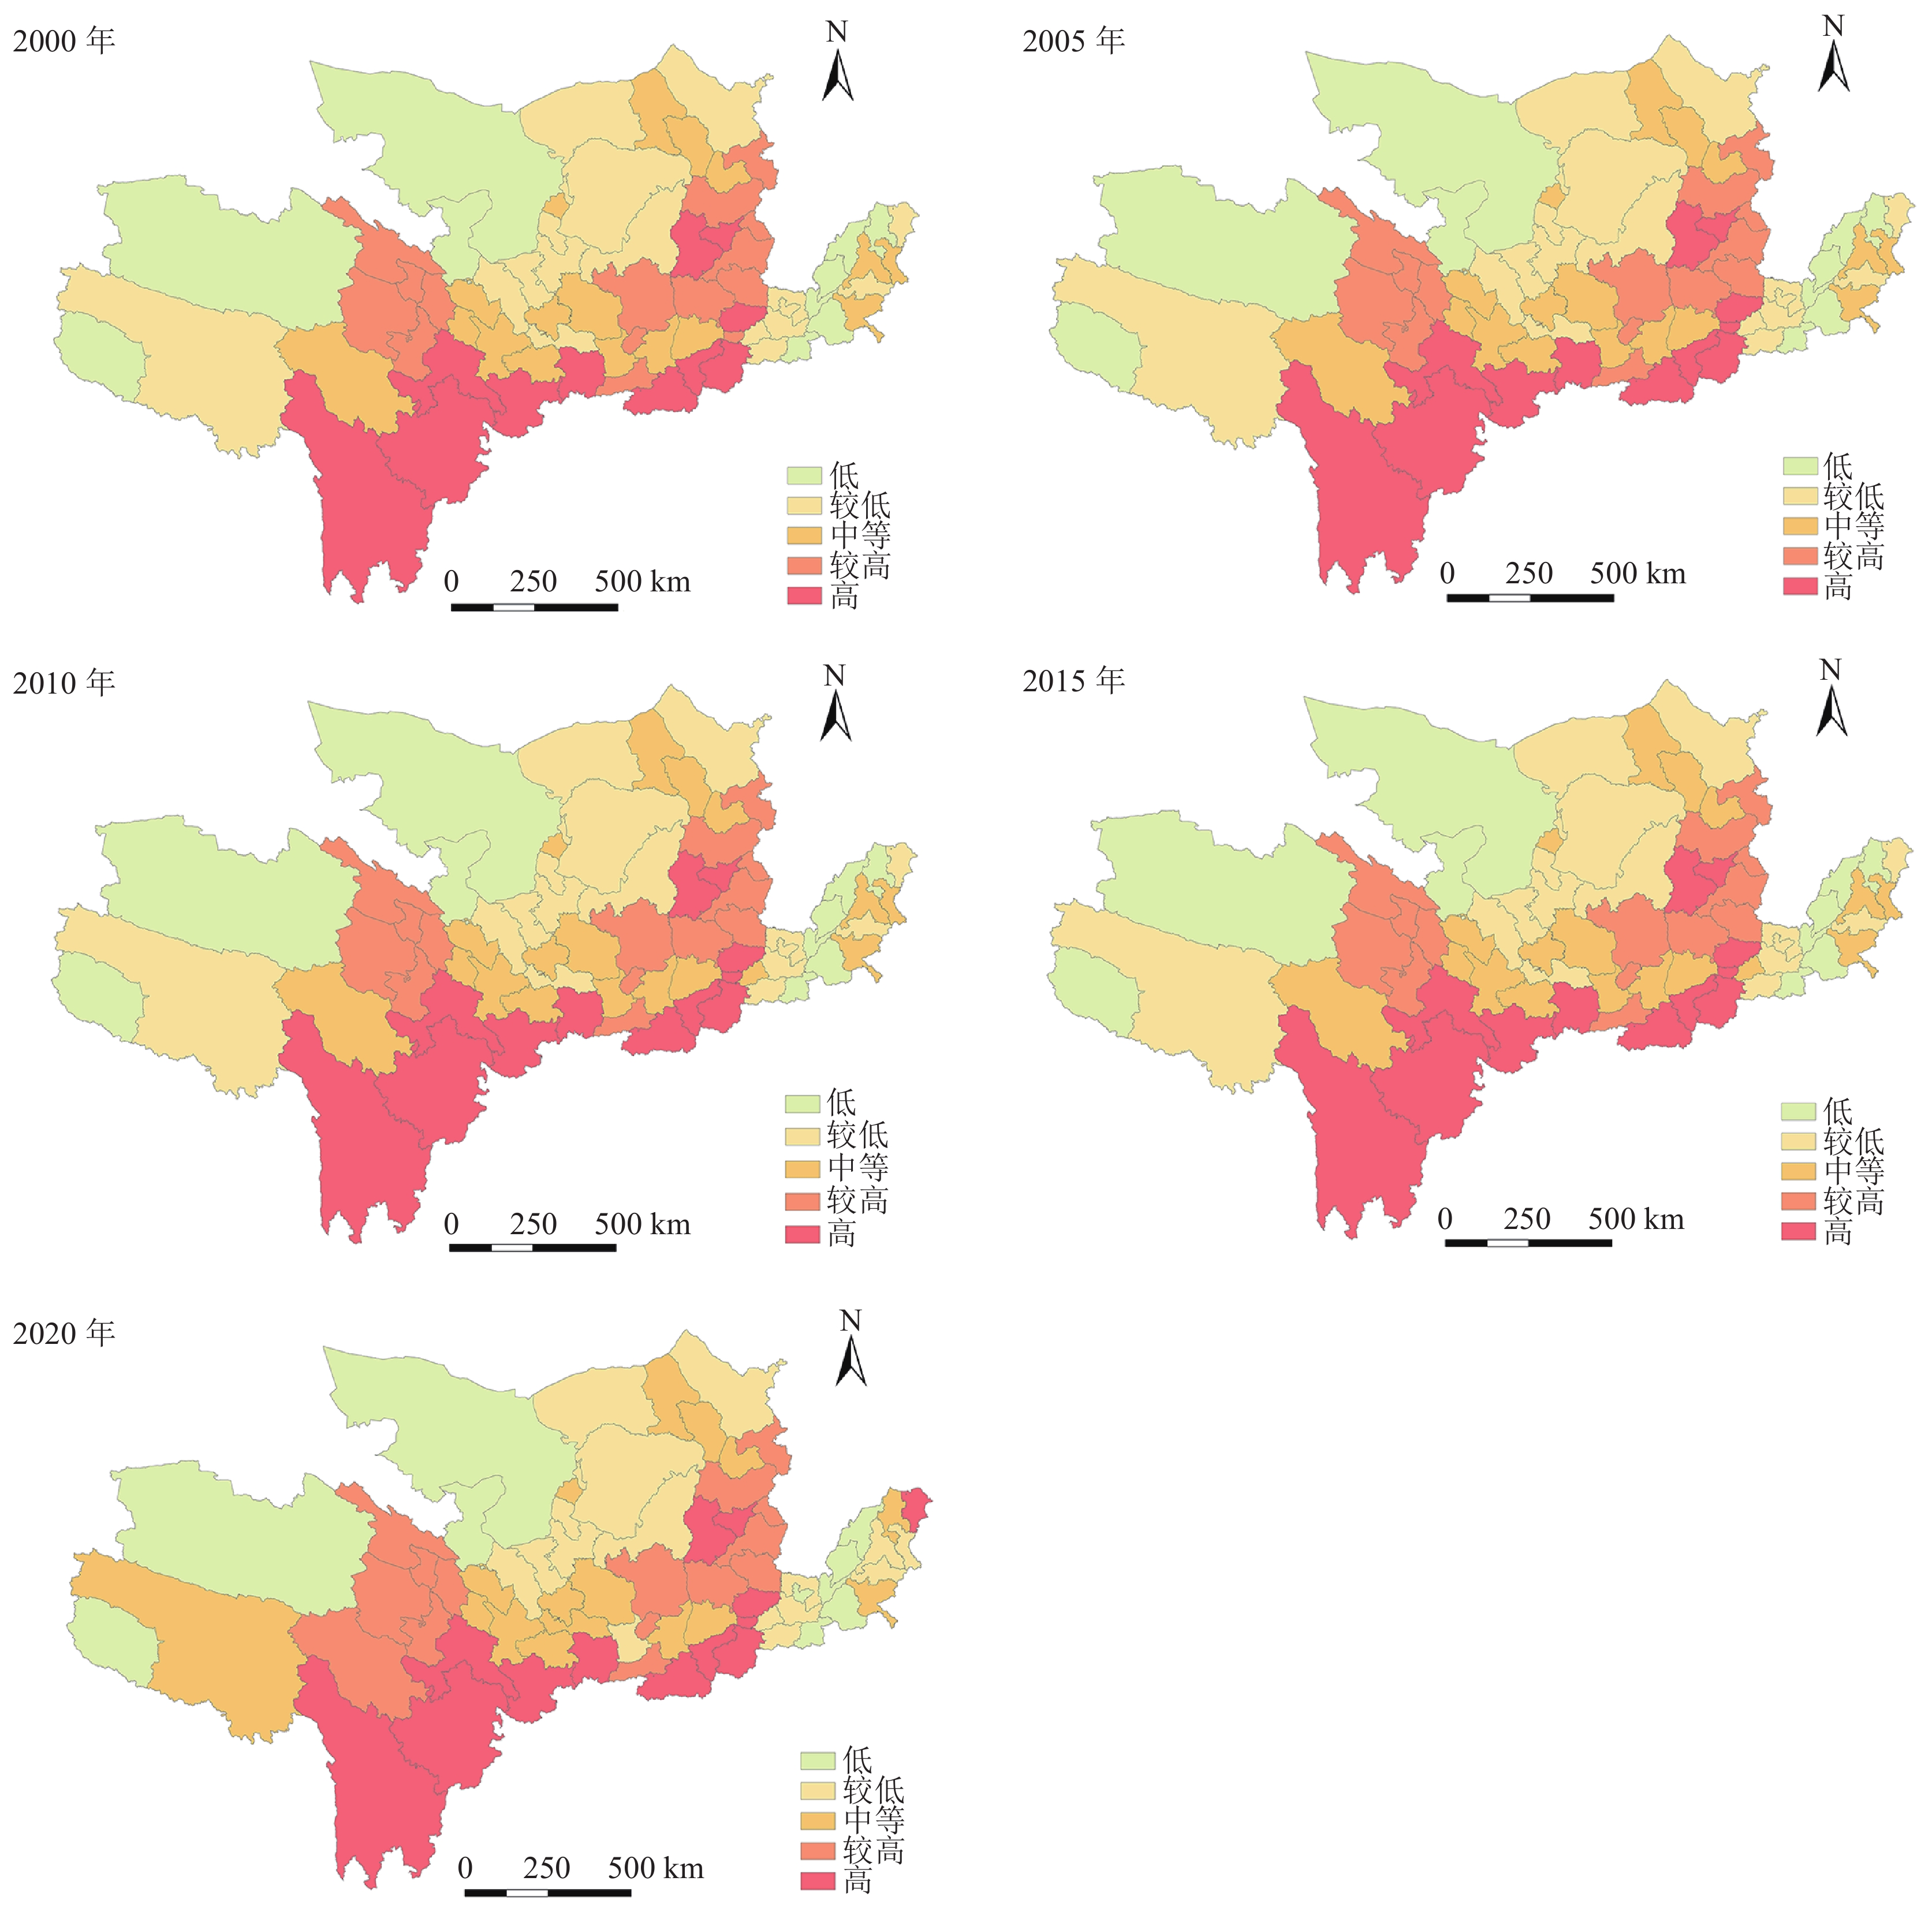
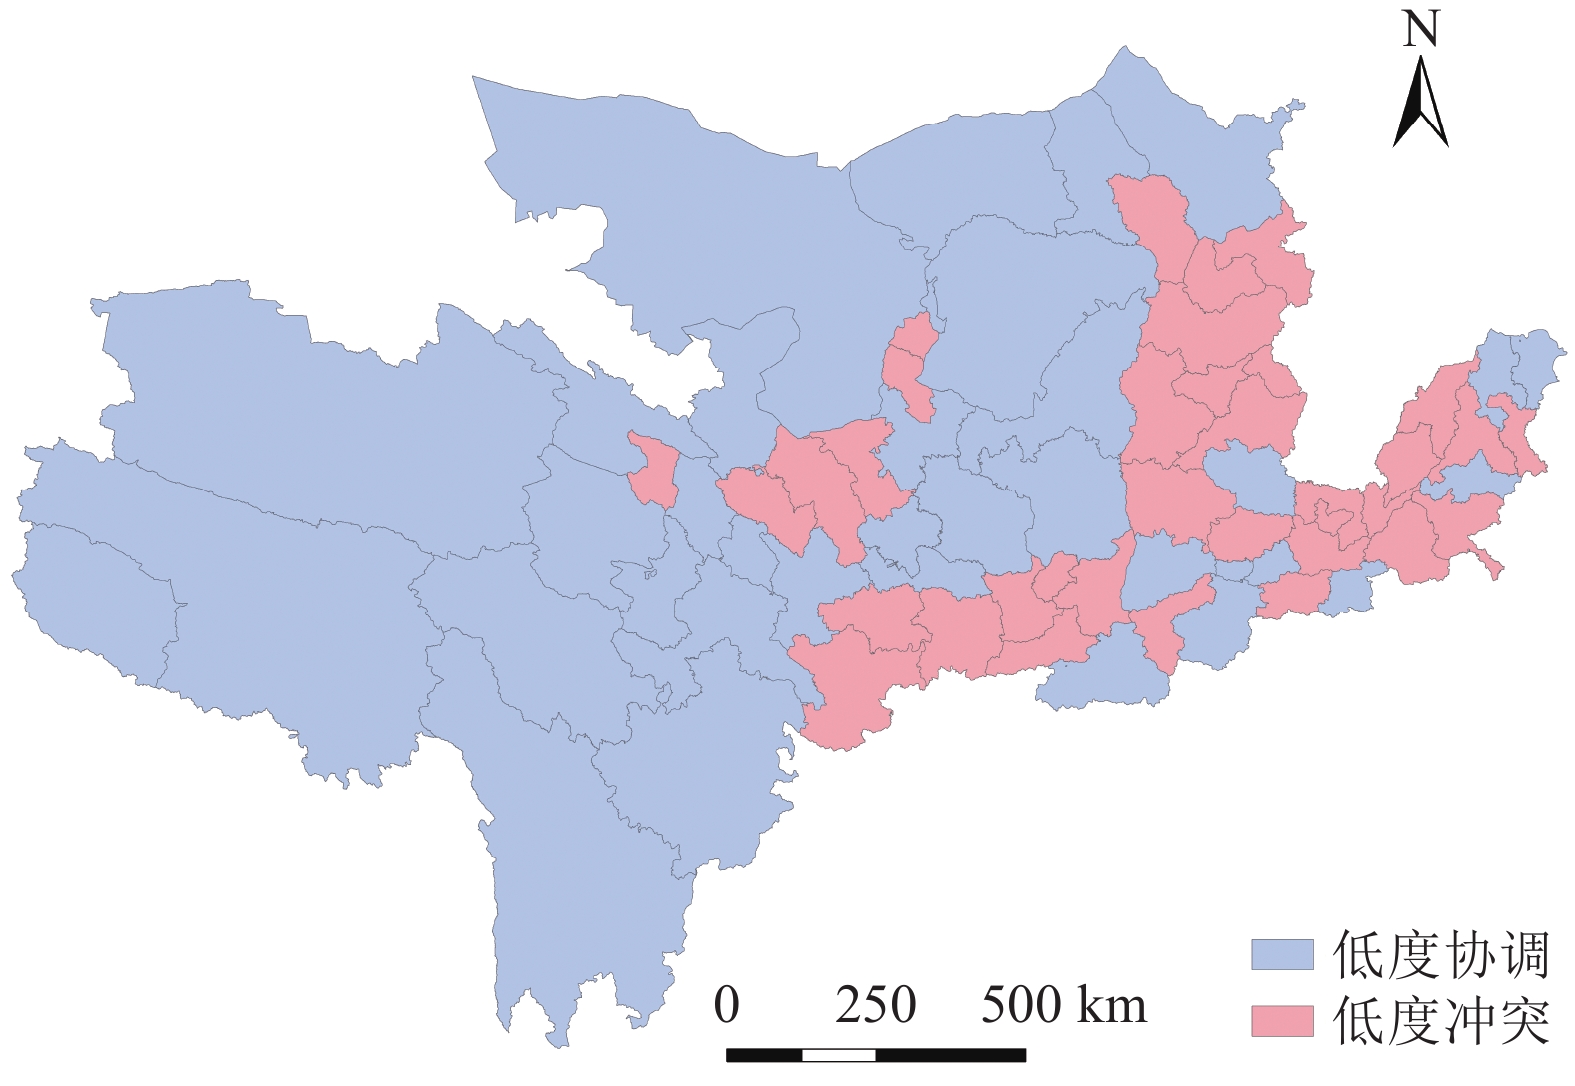
研究结果 ①2000—2020年黄河流域生态系统服务价值(ESV)整体呈增加趋势,ESV由2000年的40217.33亿元增加到2020年的41135.10亿元,其中,草地的ESV值最大,未利用地的ESV最小。②黄河流域各地级市单位面积生态系统服务价值呈现“南高北低、中游高上下游低”的空间分布特征,2000—2020年各地级市单位面积生态系统服务价值较稳定,整体格局没有发生显著变化。各阶段ESV变化率的高值区与低值区空间集聚程度明显,聚集区主要集中在北部和东部。③2000—2020年黄河流域GDP的增加率远高于生态系统服务价值的增加率,生态和经济整体处于低度协调和低度冲突水平。
结论 2000—2020年间,黄河流域生态系统服务价值虽呈增长趋势,但增速低于GDP,生态与经济协调度较低,未来需要加强优化生态安全格局,确保生态系统服务功能的可持续发展。
Abstract:Objective The Yellow River Basin is an important ecological barrier and important economic zone in China. The analysis of the temporal and spatial variation characteristics of ecosystem service value (ESV)is of great significance to the ecological environment protection and high−quality sustainable development of the Yellow River Basin.
Methods The ESV in 2000, 2005, 2010, 2015 and 2020 was calculated, and the hot spot analysis method and eco−economic harmony index model were used to explore the high and low value aggregation distribution characteristics of the change rate of ESV and the degree of eco−economic harmony of cities in the Yellow River Basin, and relevant suggestions were put forward from the perspective of national land spatial planning.
Results ① The ESV of the Yellow River Basin will increase from 4021.733 billion yuan in 2000 to 4113.510 billion yuan in 2020. The ESV of grassland is the largest and that of unused land is the smallest. The service value of hydrological regulation, soil conservation and biodiversity maintenance is at a high level. ② The ESV of cities in the Yellow River Basin is characterized by the spatial distribution of "high in the south and low in the north, high in the middle reaches and lower in the upstream and downstream". From 2000 to 2020, the AESV in each region is relatively stable, and the overall pattern has not changed significantly. The high value area and low value area of ESV change rate in each stage show obvious aggregation state, and the aggregation areas are mainly concentrated in the north and east. ③ The GDP growth rate of the Yellow River Basin from 2000 to 2020 is much higher than that of the ecosystem service value, and the ecology and economy are at a low level of coordination and conflict.
Conclusions Although the ESV in the Yellow River Basin showed an increasing trend from 2000 to 2020, the growth rate was lower than GDP, and the coordination between ecology and economy was relatively low. In the future, it is necessary to strengthen and optimize the ecological security pattern to ensure the sustainable development of ecosystem service functions.
-

-

图 4 2000—2020年黄河流域热点变化空间分布图(极显著热点代表99%的置信水平,显著热点代表95%的置信水平,热点代表90%的置信水平;冷点亦如此)
Figure 4.
表 1 黄河流域单位面积生态系统服务价值系数
Table 1. Factor of ecosystem services value per unit area in the Yellow River Basin
生态系统类型 生态系统服务价值/(元·hm−2·a−1) 耕地 林地 草地 建设用地 水域 未利用地 供给服务 食物生产 1761.95 581.44 757.64 0.00 933.84 35.24 原材料生产 687.16 5250.61 634.30 0.00 616.68 70.47 调节服务 气体调节 1268.61 7611.63 2642.92 0.00 898.60 105.71 气候调节 1709.09 7171.13 2748.64 0.00 3629.61 229.06 水文调节 1356.70 7206.37 2678.16 0.00 33071.79 123.34 废物处理 2449.11 3030.56 2325.78 0.00 26164.94 458.11 支持服务 保持土壤 2590.06 7083.03 3946.77 0.00 722.40 299.53 维持生物多样性 1797.19 7946.40 3294.84 0.00 6043.49 704.78 文化服务 美学景观 299.53 3664.86 1532.89 0.00 7823.06 422.87  下载: 导出CSV
表 2 2000—2020年黄河流域土地利用变化度
Table 2. Dynamic changes of land use in the Yellow River Basin from 2000 to 2020
时期 单一土地利用动态度/% 综合土地利用动态度/% 耕地 林地 草地 水域 建设用地 未利用地 2000—2005 −0.28 0.19 −0.04 0.43 1.58 0.02 0.09 2005—2010 −0.09 0.04 0.01 0.19 0.83 −0.05 0.03 2010—2015 −0.15 0.00 −0.03 0.47 2.78 −0.10 0.24 2015—2020 −0.58 0.21 0.34 2.78 4.37 −0.91 3.40 2000—2020 −0.27 0.11 0.07 1.01 2.79 −0.26 0.85
下载: 导出CSV
表 3 2000—2020年黄河流域土地利用转移矩阵
Table 3. Land use transition in the Yellow River Basin from 2000 to 2020
km2 时间 土地利用类型 2020年 2000年 耕地 林地 草地 水域 建设用地 未利用地 转出合计 耕地 194843 23835 81002 5999 31991 4047 146874 林地 22343 125681 79318 1329 2418 4658 110066 草地 76214 83869 632172 14382 8848 97948 281261 水域 5153 941 11638 19282 1164 6114 25010 建设用地 19441 1025 4256 1489 8375 498 26709 未利用地 5397 5888 117776 10577 1961 425220 141599 转入总计 128548 115558 293990 33776 46382 113265 731519
下载: 导出CSV
表 4 2000—2020年黄河流域不同用地类型生态系统服务价值
Table 4. ESV of different types of land use in the Yellow River Basin from 2000 to 2020
用地类型 2000年 2005年 2010年 2015年 2020年 ESV/亿元 占比 ESV/亿元 占比 ESV/亿元 占比 ESV/亿元 占比 ESV/亿元 占比 耕地 4763.55 11.84% 4697.59 11.66% 4676.40 11.59% 4640.75 11.50% 4506.32 10.95% 林地 11704.16 29.10% 11816.68 29.32% 11843.23 29.35% 11844.47 29.34% 11971.46 29.10% 草地 18808.69 46.77% 18770.37 46.57% 18778.67 46.54% 18753.83 46.46% 19072.03 46.36% 水域 3548.87 8.82% 3625.18 8.99% 3658.82 9.07% 3744.48 9.28% 4265.14 10.37% 建设用地 0.00 0.00% 0.00 0.00% 0.00 0.00% 0.00 0.00% 0.00 0.00% 未利用地 1392.05 3.46% 1393.39 3.46% 1390.03 3.45% 1383.16 3.43% 1320.15 3.21% 合计 40217.33 100.00% 40303.20 100.00% 40347.16 100.00% 40366.69 100.00% 41135.10 100.00%
下载: 导出CSV
表 5 2000—2020年黄河流域各单项生态系统服务价值
Table 5. ESVf in the Yellow River Basin from 2000 to 2020
生态功能 2000年 2005年 2010年 2015年 2020年 ESVf/亿元 占比 ESVf/亿元 占比 ESVf/亿元 占比 ESVf/亿元 占比 ESVf/亿元 占比 食物生产 1494.88 3.72% 1487.35 3.69% 1485.63 3.68% 1481.12 3.67% 1482.49 3.60% 原材料生产 2123.16 5.28% 2131.27 5.29% 2133.46 5.29% 2131.53 5.28% 2150.37 5.23% 气体调节 4749.79 11.81% 4757.05 11.80% 4760.50 11.80% 4754.92 11.78% 4806.21 11.68% 气候调节 5084.59 12.64% 5091.24 12.63% 5094.81 12.63% 5090.54 12.61% 5152.71 12.53% 水文调节 6155.40 15.31% 6191.99 15.36% 6208.63 15.39% 6237.21 15.45% 6496.34 15.79% 废物处理 5103.98 12.69% 5120.16 12.70% 5129.39 12.71% 5147.14 12.75% 5325.95 12.95% 土壤保持 6372.17 15.84% 6369.47 15.80% 6370.82 15.79% 6359.53 15.75% 6410.74 15.58% 维持生物多样性 6175.11 15.35% 6184.66 15.35% 6189.09 15.34% 6185.21 15.32% 6260.45 15.22% 美学景观 2958.24 7.36% 2969.99 7.37% 2974.83 7.37% 2979.51 7.38% 3049.82 7.41% 合计 40217.33 100.00% 40303.20 100.00% 40347.16 100.00% 40366.69 100.00% 41135.10 100.00%
下载: 导出CSV
-
[1] Constanza R, D’Arge R, De Groot R, et al. 1997. The value of the world’s ecosystem services and natural capital[J]. World Environment, 387(6630): 253−260.
[2] Ding H, An J C. 2015. Study on the ecosystem service value of the Upper Yellow River in Gannan Area[J]. Yellow River, 37(5): 74−76 (in Chinese with English abstract).
[3] Ding M T, Peng F S, Hu Y C, et al. 2020. Spatial and temporal changes of ecosystem service value in Jiangsu Province based on LUCC[J]. Acta Ecologica Sinica, 37(5): 74−76 (in Chinese with English abstract).
[4] Du T T, Luo W, Li Z. H, et al. 2012. Evaluation of lake ecosystem services: A case study of Taihu Lake[J]. China Population, Resouces and Environment, 22(S2): 208–211 (in Chinese with English abstract).
[5] Jiang B, Ouyang Z Y, Miao H, et al. 2011. Ecosystem services valuation of the Haihe River basin wetlands[J]. Acta Ecologica Sinica, 31(8): 2236−2244 (in Chinese with English abstract).
[6] Li D Y, Ren Z Y, Liu X F, et al. 2013. Dynamic change of ecological service value of cultivated land in Shaanxi Province[J]. Journal of Arid Land Resources and Environment, 27(7): 40−45 (in Chinese with English abstract).
[7] Li F, Chen C. 2021. Dynamic change of ecological–living–industrial land and the response to ecosystem service value—— a case study of Shunde[J]. Research of Soil and Water Conservation, 28(1): 250−257 (in Chinese with English abstract).
[8] Liu J, Cheng Y P, Zhang F E, et al. 2023. Research hotspots and trends of groundwater and ecology studies: Based on a bibliometric approach[J]. Journal of Groundwater Science and Engineering, 11(1): 20−36. doi: 10.26599/JGSE.2023.9280003
[9] Liu Y B, Wang X L, Hou X Y, et al. 2020. Land use pattern and ecosystem service value assessment of the Yellow River Delta in 2025 under four periods and simulated scenarios[J]. Wetland Science, 18(4): 424−436 (in Chinese with English abstract).
[10] Long J H, Zhang W, Fu Y H, et al. 2021. The value of ecosystem services in Hegang coal mining area[J]. Acta Ecologica Sinica, 41(5): 1728−1737 (in Chinese with English abstract).
[11] Mamat S, Mamattursun E, Taxpolat T. 2013. The effects of land−use change on ecosystem service value of desert oasis: A case study in Ugan−Kuqa River Delta Oasis, China[J]. Canadian Journal of Soil Science, 93(1): 99−108. doi: 10.4141/cjss2012-010
[12] Mu S L. 2016. Spatial patterns of value of ecosystem service in temperate grassland in Inner Mongolia during 1982–2014[J]. Journal of Arid Land Resources and Environment, 30(10): 76−81 (in Chinese with English abstract).
[13] Ouyang Z Y, Wang X K, Miao H. 1998. A primary study on Chinese terrestrial ecosystem services and their ecological–economic values[J]. Acta Ecologica Sinica, 19(5): 607−613 (in Chinese with English abstract).
[14] Shao M, Li X, Liu Z C, et al. 2021. Evolution analysis and optimization research of ecosystem service value in Chengde City, Hebei Province of northern China based on land use/land cover change (LUCC)[J]. Journal of Beijing Forestry University, 43(3): 106−116 (in Chinese with English abstract).
[15] Shen M H, Mao D. 2019. Review of the evaluation of marine ecosystem services value[J]. Acta Ecologica Sinica, 39(6): 2255−2265 (in Chinese with English abstract).
[16] Shi X L, Wang W. 2008. Evaluation method of integrated valuation of ecosystem functions and its application: A case study of Kangbao County, Hebei Province[J]. Acta Ecologica Sinica, 28(8): 3998−4006 (in Chinese with English abstract).
[17] Song G, E S X, Xu S, et al. 2013. Study on measurement of cultivated land ecosystem services evaluation in Bayan County[J]. Journal of Northeast Agricultural University, 44(5): 126−131 (in Chinese with English abstract).
[18] Tu X S, Long H L. 2015. Spatial patterns and dynamic evolution of ecosystem service values in Poyang Lake Region from 2000 to 2010[J]. Resources Science, 37(12): 2451−2460 (in Chinese with English abstract).
[19] Wang Y, Chen R S, Xia Z L, et al. 2020. The evaluation of ecosystem service value and its spatial change in the Yellow River Basin and suggestions from the ecological geology perspectives[J]. Geological Bulletin of China, 39(10): 1650−1662 (in Chinese with English abstract).
[20] Wen L, Song J, Zhang H C, et al. 2020. Dynamics of ecosystem service value in Ulan Buh Desert from 1990 to 2018[J]. Journal of Arid Land Resources and Environment, 34(12): 57−64 (in Chinese with English abstract).
[21] Wu J Z, Li B, Zhang X S. 2007. Ecosystem service value and its application in evaluation of eco−economic harmonious development[J]. Chinese Journal of Applied Ecology, 18(11): 2554−2558 (in Chinese with English abstract).
[22] Xiao J S, Qiao B, Chen G Q, et al. 2020. Land use change and evolution of ecosystem service value in Maduo County of source region of the Yellow River[J]. Acta Ecologica Sinica, 40(2): 510−521 (in Chinese with English abstract).
[23] Xie G D, Zhang C X, Zhang C S, et al. 2015a. The value of ecosystem services in China[J]. Resources Science, 37(9): 1740−1746 (in Chinese with English abstract).
[24] Xie G D, Zhang C X, Zhang L M, et al. 2015b. Improvement of the evaluation method for ecosystem service value based on per unit area[J]. Journal of Natural Resources, 30(8): 1243−1254 (in Chinese with English abstract).
[25] Xie G D, Zhen L, Lu C X, et al. 2010. Applying value transfer method for eco−service valuation in China[J]. Journal of Resources and Ecology, 2010,1(1): 51−59.
[26] Yao X W, Zeng J, Li W J. 2015. Spatial correlation characteristics of urbanization and land ecosystem service value in Wuhan Urban Agglomeration[J]. Transactions of the Chinese Society of Agricultural Engineering, 31(9): 249−256 (in Chinese with English abstract).
[27] Zhang P Y, Geng W L, Yang D, et al. 2020. Spatial−temporal evolution of land use and ecosystem service value in the Lower Reaches of the Yellow River Region[J]. Transactions of the Chinese Society of Agricultural Engineering, 36(11): 277−288 (in Chinese with English abstract).
[28] Zhang Y J, Guan D J, Zhai J, et al. 2017. Spatial and temporal variations of ecosystem services value in Chongqing City[J]. Acta Scientiae Circumstantiae, 37(3): 1169−1177 (in Chinese with English abstract).
[29] 丁辉, 安金朝. 2015. 黄河上游甘南段生态系统服务价值估算[J]. 人民黄河, 37(5): 74−76. doi: 10.3969/j.issn.1000-1379.2015.05.019
[30] 丁梦婷, 裴凤松, 胡引翠, 等. 2020. 基于LUCC的江苏省生态系统服务价值时空变化特征研究[J]. 生态学报, 40(19): 6801−6811.
[31] 杜婷婷, 罗维, 李中和, 等. 2012. 湖泊生态系统服务功能价值评估: 以太湖为例[J]. 中国人口(资源与环境), 22(S2): 208−211.
[32] 江波, 欧阳志云, 苗鸿, 等. 2011. 海河流域湿地生态系统服务功能价值评价[J]. 生态学报, 31,(8): 2236−2244.
[33] 李冬玉, 任志远, 刘宪锋, 等. 2013. 陕西省耕地生态系统服务价值动态测评[J]. 干旱区资源与环境, 27(7): 40−45.
[34] 李锋, 陈春. 2021. “三生”用地功能动态变化及其生态系统服务价值响应——以顺德区为例[J]. 水土保持研究, 28(1): 250−257.
[35] 刘玉斌, 王晓利, 侯西勇, 等. 2020. 四个时期和模拟情景下2025年黄河三角洲的土地利用格局和生态系统服务价值评估[J]. 湿地科学, 18(4): 424−436.
[36] 龙精华, 张卫, 付艳华, 等. 2021. 鹤岗矿区生态系统服务价值[J]. 生态学报, 41(5): 1728−1737.
[37] 穆松林. 2016. 1982—2014年内蒙古自治区温带草原生态系统服务价值及其空间分布[J]. 干旱区资源与环境, 30(10): 76−81.
[38] 欧阳志云, 王效科, 苗鸿. 1998. 中国陆地生态系统服务功能及其生态经济价值的初步研究[J]. 生态学报, 19(5): 607−613.
[39] 邵明, 李雄, 刘志成, 等. 2021. 基于LUCC的承德市域生态系统服务价值演变分析与优化研究[J]. 北京林业大学学报, 43(3): 106−116. doi: 10.12171/j.1000-1522.20190480
[40] 沈满洪, 毛狄. 2019. 海洋生态系统服务价值评估研究综述[J]. 生态学报, 39(6): 2255−2265.
[41] 石晓丽, 王卫. 2008. 生态系统功能价值综合评估方法与应用——以河北省康保县为例[J]. 生态学报, 28(8): 3998−4006. doi: 10.3321/j.issn:1000-0933.2008.08.060
[42] 宋戈, 鄂施璇, 徐珊, 等. 2013. 巴彦县耕地生态系统服务功能价值测算研究[J]. 东北农业大学学报, 44(5): 126−131. doi: 10.3969/j.issn.1005-9369.2013.05.025
[43] 涂小松, 龙花楼. 2015. 2000—2010年鄱阳湖地区生态系统服务价值空间格局及其动态演化[J]. 资源科学, 37(12): 2451−2460.
[44] 王尧, 陈睿山, 夏子龙, 等. 2020. 黄河流域生态系统服务价值变化评估及生态地质调查建议[J]. 地质通报, 39(10): 1650−1662. doi: 10.12097/j.issn.1671-2552.2020.10.015
[45] 温璐, 宋洁, 张慧超, 等. 2020. 近30年乌兰布和沙漠生态系统服务价值评估[J]. 干旱区资源与环境, 34(12): 57−64.
[46] 吴建寨, 李波, 张新时. 2007. 生态系统服务价值变化在生态经济协调发展评价中的应用[J]. 应用生态学报, 18(11): 2554−2558.
[47] 肖建设, 乔斌, 陈国茜, 等. 2020. 黄河源区玛多县土地利用和生态系统服务价值的演变[J]. 生态学报, 40(2): 510−521.
[48] 谢高地, 张彩霞, 张昌顺, 等. 2015a. 中国生态系统服务的价值[J]. 资源科学, 37(9): 1740−1746.
[49] 谢高地, 张彩霞, 张雷明, 等. 2015b. 基于单位面积价值当量因子的生态系统服务价值化方法改进[J]. 自然资源学报, 30(8): 1243−1254. doi: 10.11849/zrzyxb.2015.08.001
[50] 姚小薇, 曾杰, 李旺君. 2015. 武汉城市圈城镇化与土地生态系统服务价值空间相关特征[J]. 农业工程学报, 31(9): 249−256. doi: 10.11975/j.issn.1002-6819.2015.09.038
[51] 张鹏岩, 耿文亮, 杨丹, 等. 2020. 黄河下游地区土地利用和生态系统服务价值的时空演变[J]. 农业工程学报, 36(11): 277−288. doi: 10.11975/j.issn.1002-6819.2020.11.033
[52] 张艳军, 官冬杰, 翟俊, 等. 2017. 重庆市生态系统服务功能价值时空变化研究[J]. 环境科学学报, 37(3): 1169−1177.
-
图(5)
表(5)
计量
- 文章访问数: 58
- PDF下载数: 13
- 施引文献: 0