

Numerical simulation of water environment in mountainous river: A case of Gulin River, Sichuan Province
-
摘要:
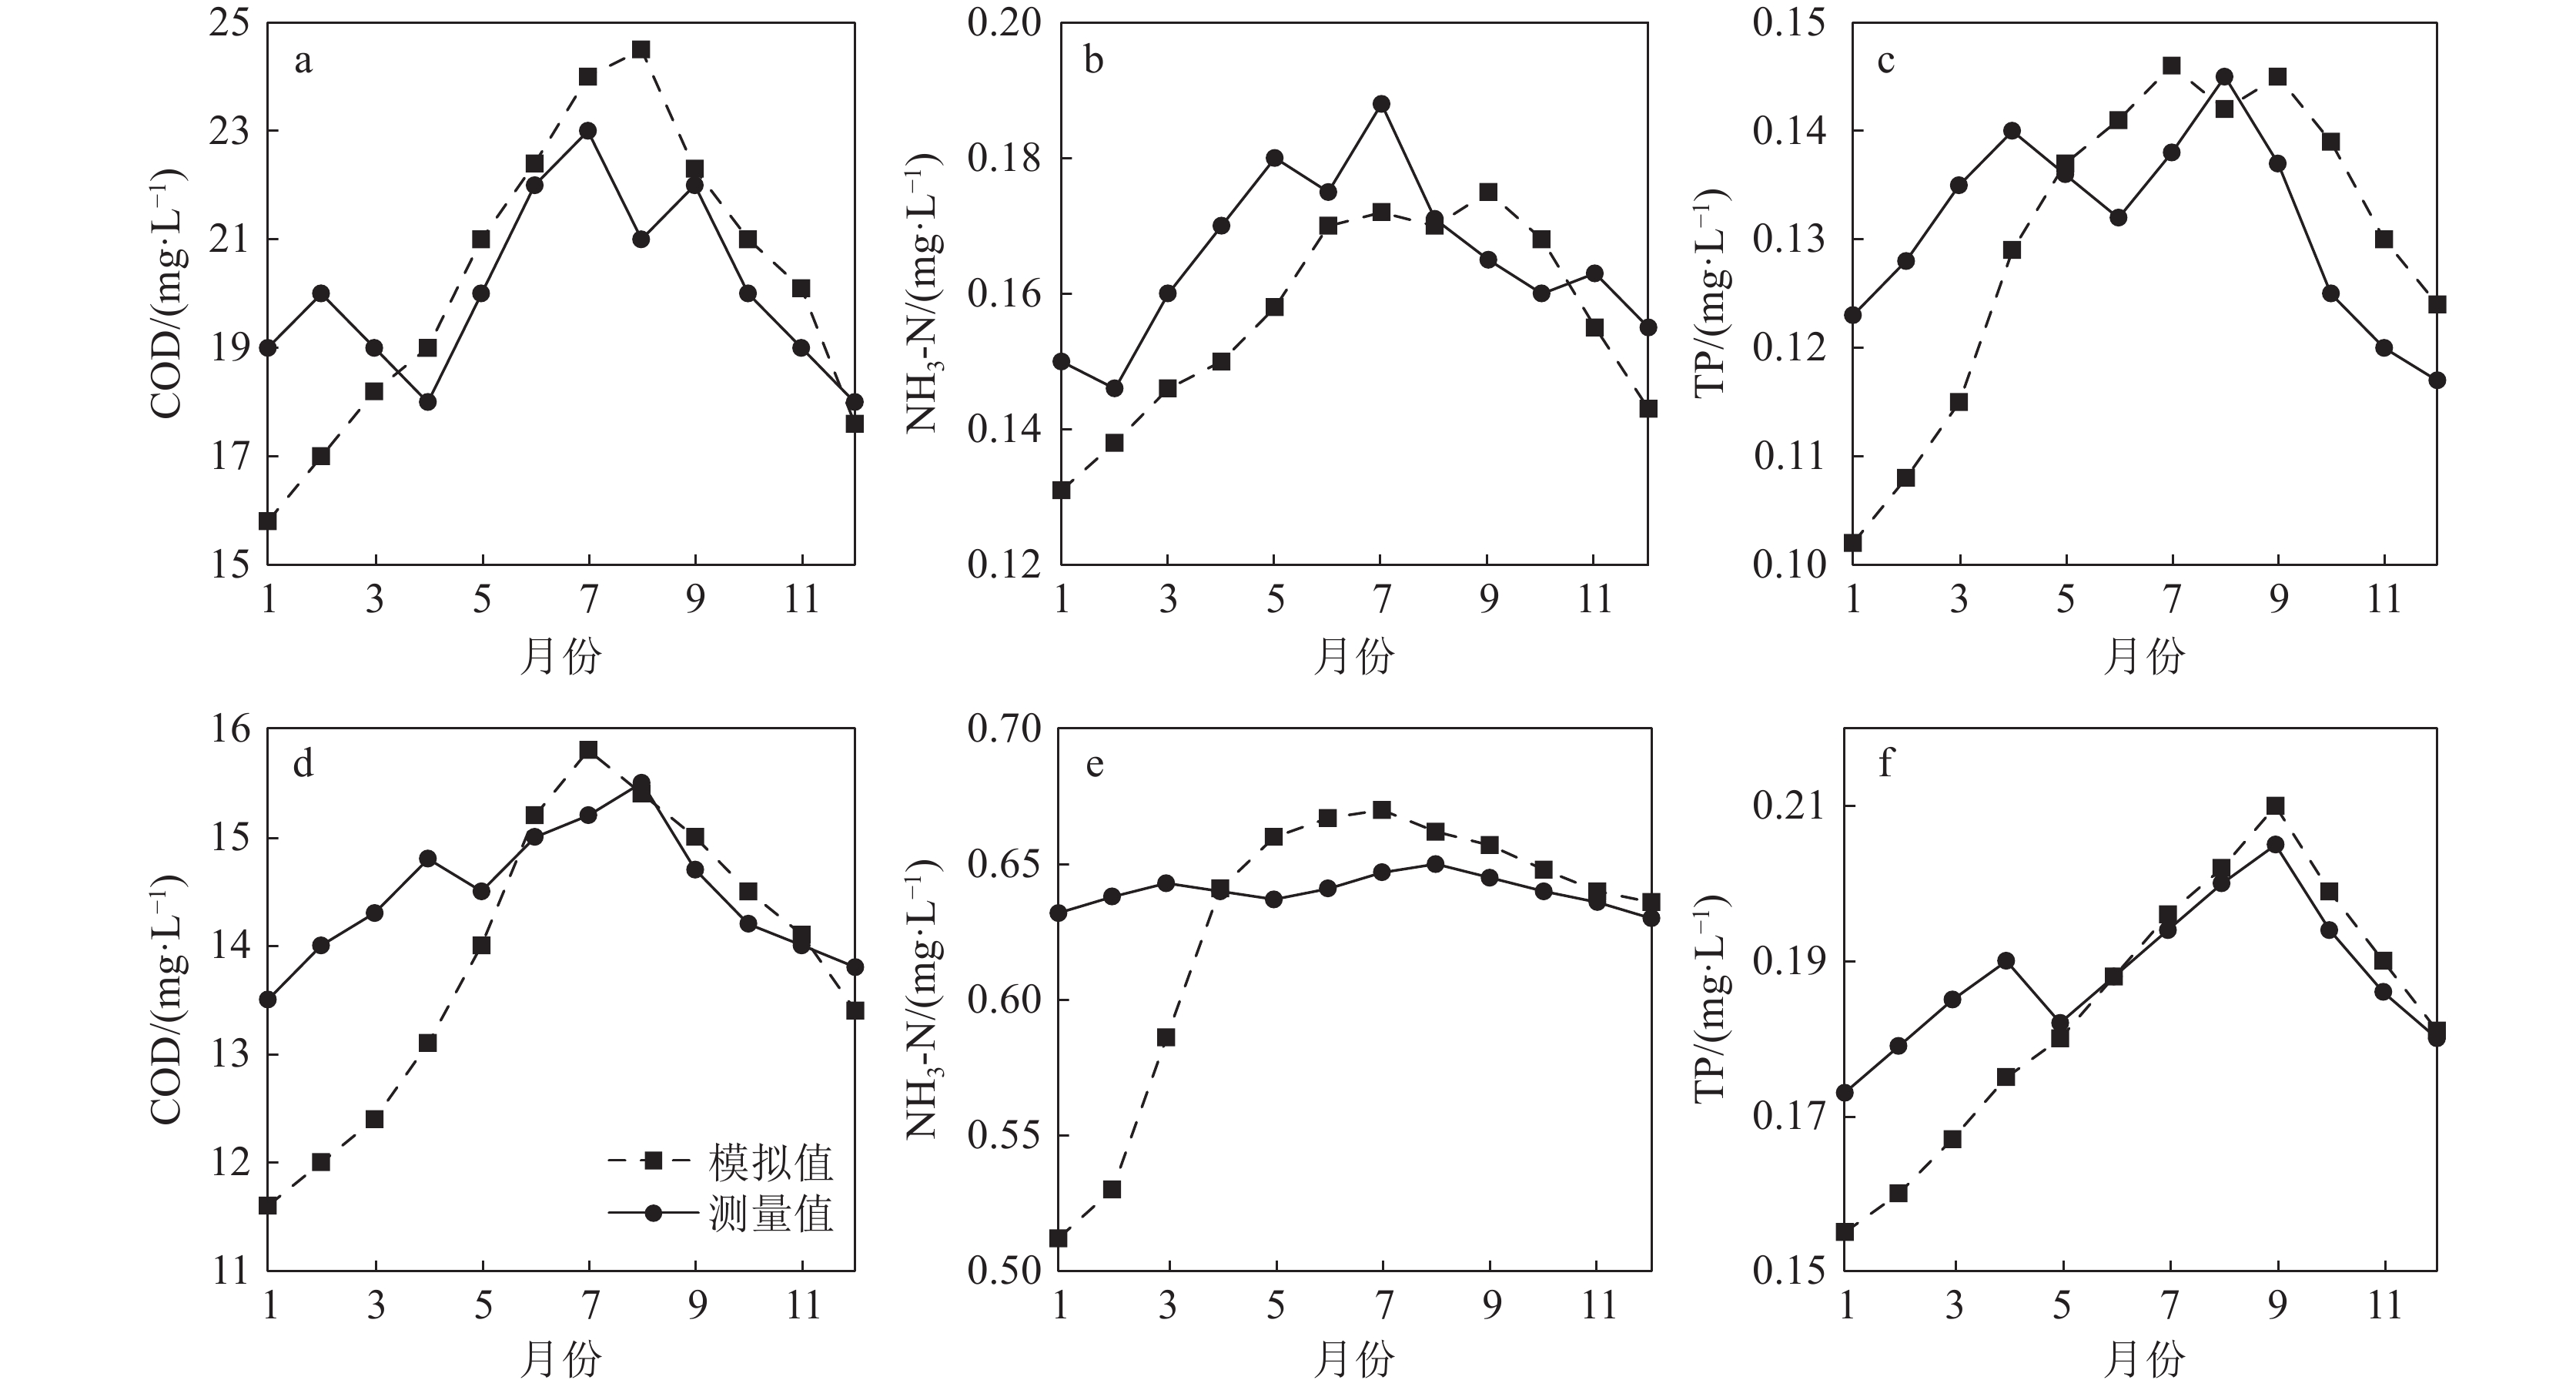
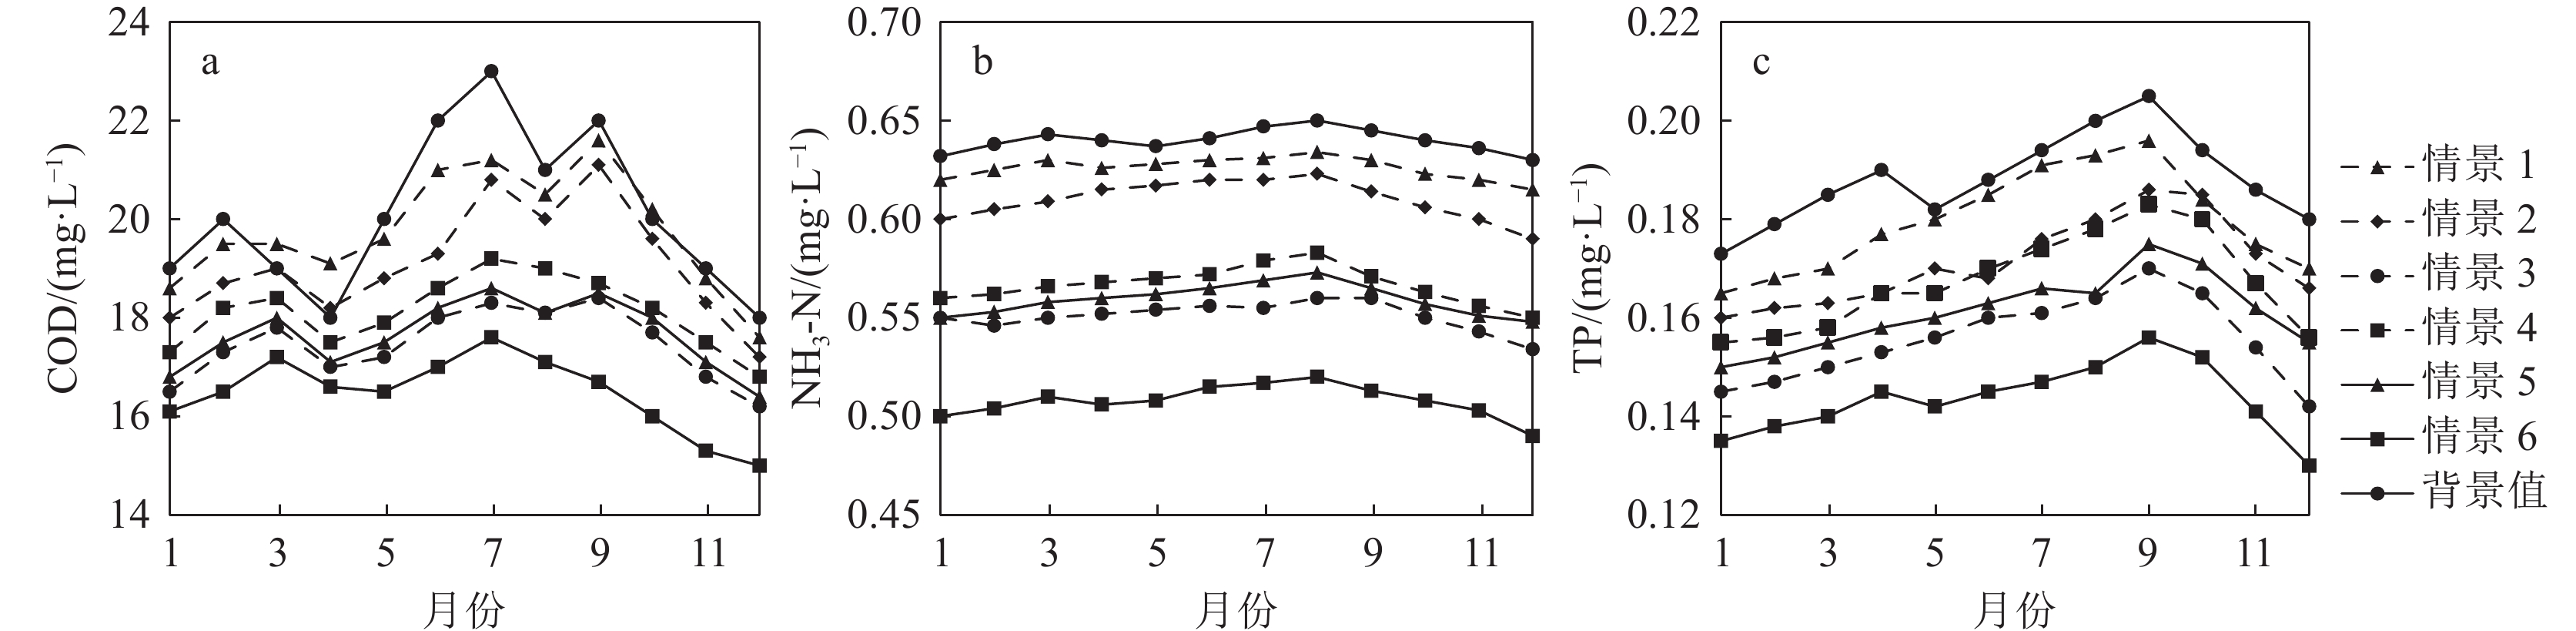
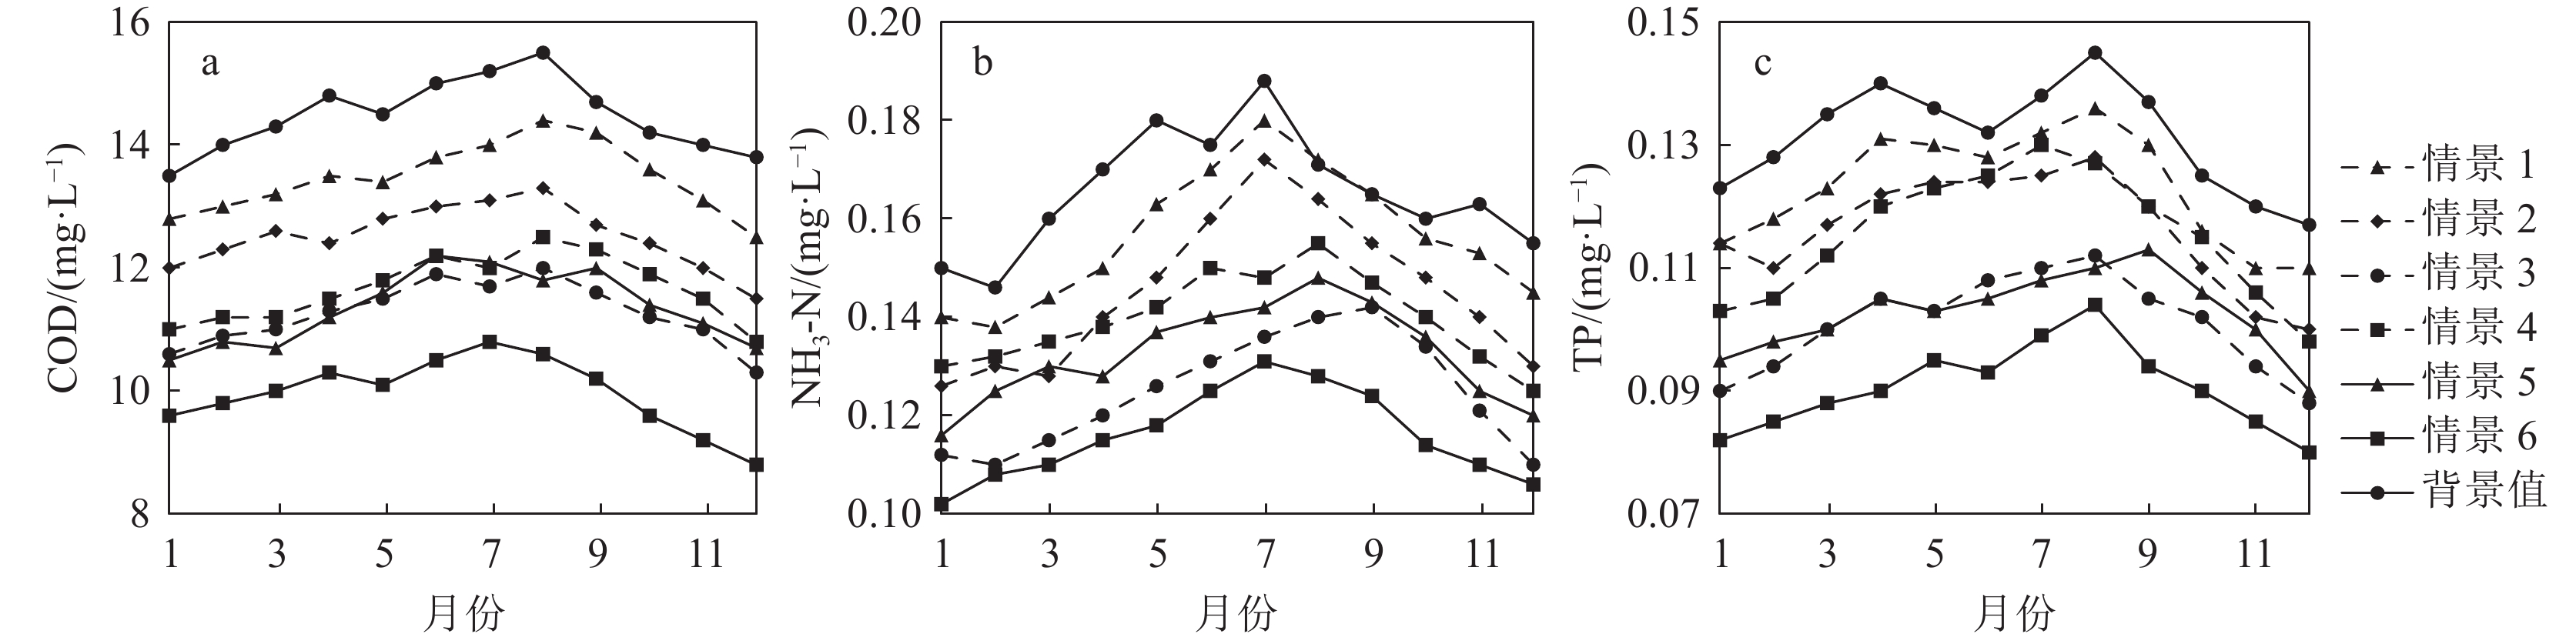
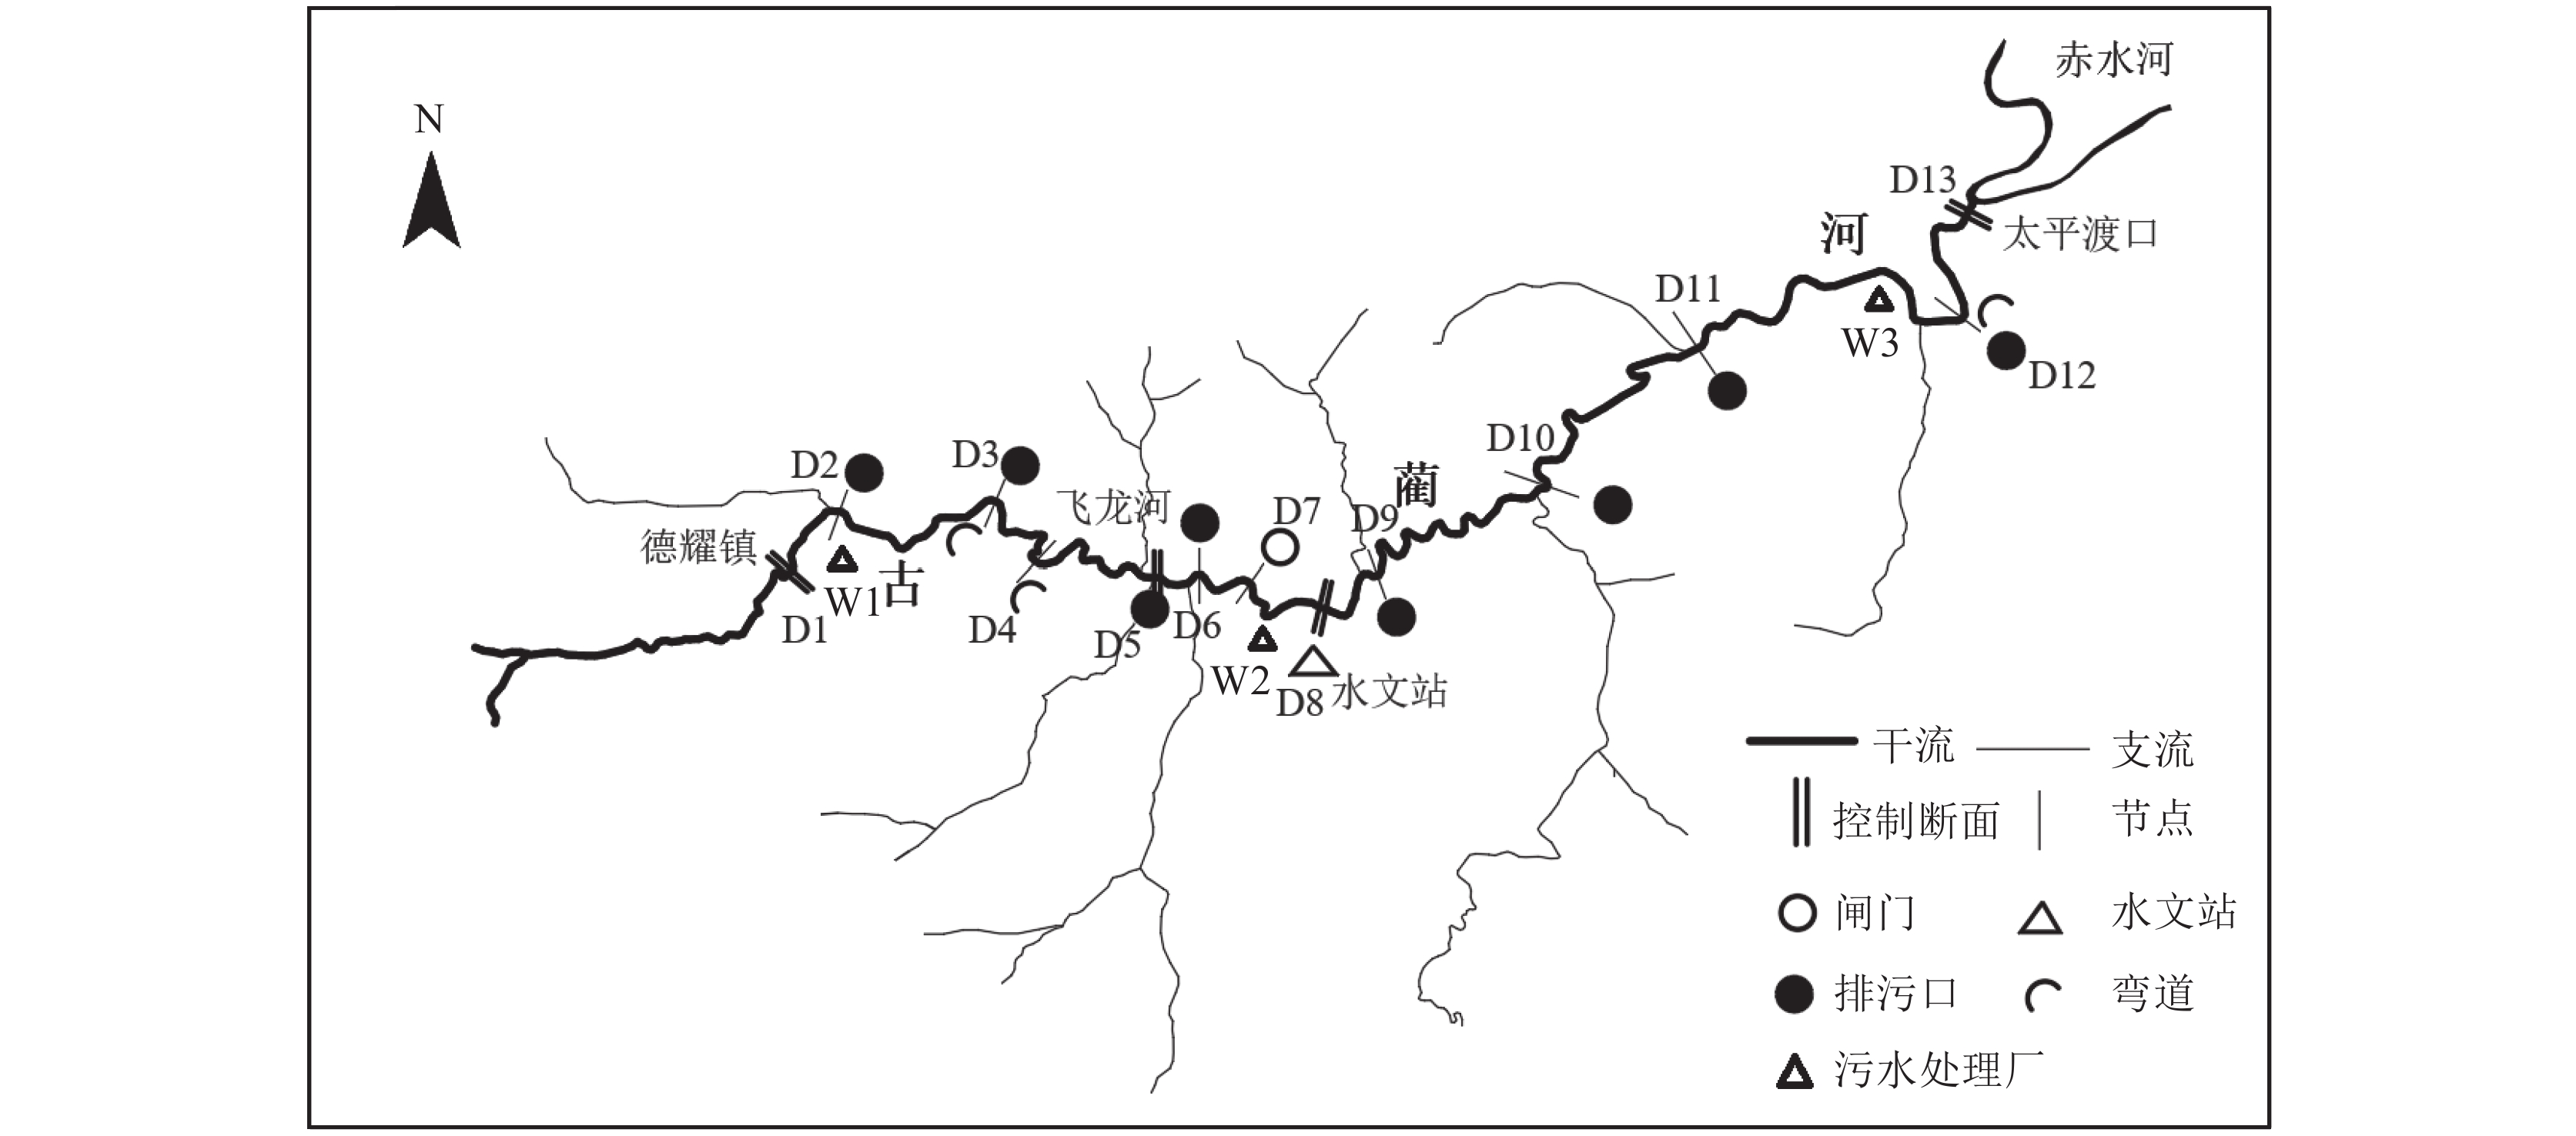
山区河流边界地形复杂、水动力条件变化剧烈且水文水质资料缺失,水环境系统不确定性较大,对其开展数值模拟研究具有重要的科学和实践意义。通过建立基于Navier-Stokes的MIKE 21水动力水质模型,对四川省南部典型山区河流古蔺河进行水环境数值模拟,为山区河流水环境研究提供支撑。结果显示,所建模型表现良好,水动力模型决定系数(R2)平均值为0.93,平均相对误差(MRE)平均值为14.25%,水质模型R2平均值为0.86,MRE平均值为19.83%。水动力情景模拟显示,降雨量增加一倍,控制断面处的平均流速增加7.94%,风速增加一倍,控制断面处的平均流速增加5.26%。在不同补水情景下,当补水位置位于德耀镇、古蔺镇及太平镇再生水厂上游5 km,补水量为再生水厂规模的50%(0.29 m3/s、0.58 m3/s、0.46 m3/s)时,控制断面处COD、NH3-N和TP的平均浓度降幅最大,分别为24.55%、25.25%和26.79%。研究结果可为山区河流的水环境研究提供借鉴,对于山区河流的水环境系统治理具有重要意义。
Abstract:The terrain of mountain river boundaries is complex, the hydrodynamic conditions change drastically, and hydrological and water quality data are lacking, leading to significant uncertainty in the water environment system. Conducting numerical simulation research has important scientific and practical significance. In this study, we established a MIKE 21 hydrodynamic and water quality model based on the Navier−Stokes equations to perform numerical simulations of the water environment in the Gulin River, a typical mountain river in the southern part of Sichuan Province. The results show that the established model performs well, with an average coefficient of determination (R²) of 0.93 for the hydrodynamic model and an average mean relative error (MRE) of 14.25%. For the water quality model, the average R² is 0.86 and the average MRE is 19.83%. Hydrodynamic scenario simulations show that doubling the rainfall increases the average flow velocity at the control section by 7.94%, while doubling the wind speed increases the average flow velocity at the control section by 5.26%. Under different water supplementation scenarios, when the supplementation locations are 5 km upstream of the Deyao Town, Gulin Town, and Taiping Town wastewater treatment plants, and the supplementation amount is 50% of the treatment plant capacity (0.29 m³/s, 0.58 m³/s, 0.46 m³/s), the average concentrations of COD, NH3−N, and TP at the control section decrease the most, by 24.55%, 25.25%, and 26.79%, respectively. The research results can provide references for the study of mountain river water environments and are of significant importance for the management of water environment systems in mountain rivers.
-
Key words:
- mountainous river /
- water environment /
- numerical simulation /
- MIKE 21 /
- Sichuan Province
-

-
表 1 计算单元信息
Table 1. Calculation unit information
序号 控制单元 计算单元 长度/m 宽度/m 水深/m 体积/m3 坡降 1 德耀镇−飞龙河段 D1-D2 2392 10 0.3 7176 0.0107 2 D2-D3 5623 14 0.35 27553 0.0269 3 D3-D4 2825 16 0.3 13560 0.0145 4 D4-D5 6643 10 0.5 33215 0.0054 5 飞龙河段−水文站段 D5-D6 1497 22 0.45 14820 0.0095 6 D6-D7 2737 20 0.5 27370 0.0030 7 D7-D8 3255 18 0.5 29295 0.0066 8 水文站−太平渡段 D8-D9 1326 14 0.3 5570 0.0068 9 D9-D10 8413 18 0.3 45430 0.0059 10 D10-D11 10110 20 0.5 101100 0.0021 11 D11-D12 8620 25 0.5 107750 0.0033 12 D12-D13 5169 30 0.6 93042 0.0050  下载: 导出CSV
表 2 水动力模块各变量测量值与模拟值指标比较
Table 2. Index of comparison for simulated and measured values of hydrodynamic model
变量 断面 MAE R2 RMSE MRE/% 流量/(m3·s−1) 水文站 0.53 0.91 0.55 20 太平渡 0.25 0.96 0.28 10 水位/m 水文站 1.12 0.90 1.62 19 太平渡 1.06 0.95 1.11 8
下载: 导出CSV
表 3 水质模块各变量测量值与模拟值指标比较
Table 3. Index of comparison for simulated and measured values of water quality model
污染物 断面 MAE R2 RMSE MRE/% COD 水文站 0.83 0.82 0.74 28 太平渡 0.66 0.90 0.51 16 NH3−N 水文站 0.56 0.80 1.34 25 太平渡 0.29 0.89 1.12 15 TP 水文站 1.08 0.84 1.41 23 太平渡 0.77 0.91 0.98 12
下载: 导出CSV
表 4 水动力模拟情景设定
Table 4. Setting of hydrodynamic simulation scenarios
情景 降雨量/mm 风速/(m·s−1) a 1 5 1 2 15 1 3 30 1 4 0 1 5 0 3 6 0 5 注:a研究设定模拟风向为正西
下载: 导出CSV
表 5 补水情景设定
Table 5. Water supplement scheme setting
情景 水厂 补水位置
(距水厂距离/km)补水比例 补水量/(m3·s−1) 1 W1 0 30% 0.17 W2 0 30% 0.35 W3 0 30% 0.28 2 W1 0 50% 0.29 W2 0 50% 0.58 W3 0 50% 0.46 3 W1 0 80% 0.46 W2 0 80% 0.93 W3 0 80% 0.74 4 W1 1 50% 0.29 W2 1 50% 0.58 W3 1 50% 0.46 5 W1 3 50% 0.29 W2 3 50% 0.58 W3 3 50% 0.46 6 W1 5 50% 0.29 W2 5 50% 0.58 W3 5 50% 0.46
下载: 导出CSV
-
[1] Danish Hyelraulic Institute. 2012. WQTEMPLATES Scientific Description[R]. Denmark.
[2] Endon. 1986. Diagnostic study on the vertical circulation and the maintenance mechanisms of the cyclonic gyre in lake Biwa[J]. Journal of Geophysical Research, C1(9): 869−876.
[3] Imboden M D. 1974. Phosphorus model of lake eutrophication, limno[J]. Ocanogr, 19(2): 144−150.
[4] Kim J, Lee T, Seo D. 2017. Algal bloom prediction of the lower Han River, Korea using the EFDC hydrodynamic and water quality model[J]. Ecological Modelling, 366: 27−36. doi: 10.1016/j.ecolmodel.2017.10.015
[5] Lopes J F, Silva C I, Cardoso A C. 2008. Validation of a water quality model for the Ria de Aveiro lagoon, Portugal[J]. Environmental Modelling & Software, 23(4): 479−494.
[6] Mikulčić H, Wang X, Duić N, et al. 2020. Environmental problems arising from the sustainable development of energy, water and environment system[J]. Journal of Environmental Management, 259: 109666. doi: 10.1016/j.jenvman.2019.109666
[7] Missaghi S, Hondzo M. 2010. Evaluation and application of a three-dimensional water quality model in a shallow lake with complex morphometry[J]. Ecological Modelling, 221(11): 1512−1525. doi: 10.1016/j.ecolmodel.2010.02.006
[8] Porté−agel F, Bastankhah M, Shamsoddin S. 2020. Wind−turbine and wind−farm flows: A review[J]. Boundary−Layer Meteorology, 174(1): 50−59.
[9] Saint V B. 1871. Movement non−permanent seaux avec Application auxcures des Rivers[J]. Pintroduction Desmaeres Dansleur Lit, Acad Sci Comptesrekus, 73(1): 148−154.
[10] Stefunkova Z, Macura V, Skrinar A, et al. 2021. Relationship between morphological characteristics and quality of aquatic habitat in mountain streams of Slovakia[J]. Water, 13(2): 1−14.
[11] Streeter H W, Phelps E B. 1958. A study of the pollution and natural purification of the Ohio River[R]. US Department of Health, Education, & Welfare.
[12] Teshager A D, Gassman P W, Secchi S, et al. 2017. Simulation of targeted pollutant−mitigation−strategies to reduce nitrate and sediment hotspots in agricultural watershed[J]. Science of the Total Environment, 607/608: 1188−1200. doi: 10.1016/j.scitotenv.2017.07.048
[13] Wang Q, Peng W, Dong F, et al. 2020. Simulating Flow of An Urban River Course with Complex Cross Sections Based on the MIKE 21 FM Model[J]. Water, 12(3): 761. doi: 10.3390/w12030761
[14] Xiong H B, Ma Y N, Liu T X. 2022. Purification−analysis of urban rivers by combining graphene photocatalysis with sewage treatment improvement based on the MIKE 11 model[J]. Environmental Technology, 43(4): 585−594. doi: 10.1080/09593330.2020.1797897
[15] 陈军, 吴程, 李爽, 等. 2022. 灞河流域水环境数值模拟研究[J]. 西北农林科技大学学报(自然科学版), 50(9): 80−88.
[16] 戴君, 刘硕, 韩金凤, 等. 2018. 污染负荷多情景变化下河流水质响应关系研究[J]. 中国环境科学, 38(2): 776−783.
[17] 付素静, 赵娜, 张晓晴, 等. 2021. 基于高时空分辨率流域水污染源清单的河流概化研究[J]. 环境生态学, 3(7): 11−16, 62.
[18] 古蔺县生态环境局. 2017. 古蔺县古蔺河“一河一策”管理保护规划[R].
[19] 韩先毅. 2017. 古蔺撤县设市城市供需水问题初探[J]. 四川水利, 38(4): 84−86.
[20] 何剑波, 李玉山, 胡立堂, 等. 2021. “引哈济党”工程对敦煌盆地地下水位影响的数值模拟研究[J]. 水文地质工程地质, 48(6): 34−43.
[21] 赖锡军. 2019. 流域水环境过程综合模拟研究进展[J]. 地理科学进展, 38(8): 1123−1135.
[22] 刘兴邦, 杜威. 2018. 关于山区中小河流水面线计算的探讨[J]. 中国水运(下半月), 18(10): 182−184.
[23] 罗铭, 丁锐, 黄尔, 等. 2019. 山区河流水位流量关系曲线研究[J]. 工程科学与技术, 51(5): 137−142.
[24] 漆露. 2018. 西南城市山溪性河流水系建设规划方法及实例研究[D]. 重庆大学硕士学位论文.
[25] 史铁锤, 王飞儿, 方晓波. 2010. 基于WASP的湖州市环太湖河网区水质管理模式[J]. 环境科学学报, 30(3): 631−640.
[26] 王民浩, 周晓平, 焦梦, 等. 2019. 流域水环境综合治理技术体系研究: 以兆河流域为例[J]. 环境工程, 37(10): 16−22.
[27] 王瑞敏, 胡静, 周末, 等. 2022. 基于 HEC-HMS模型的西南地区典型中小河流洪水预报研究[J]. 水电能源科学, 40(5): 79−82.
[28] 王文章, 程艳, 敖天其, 等. 2018. 基于SWAT模型的古蔺河流域面源污染模拟研究[J]. 中国农村水利水电, (10): 32−42.
[29] 王岩, 刘园, 高珍, 等. 2022. 环巢湖流域典型圩区水环境模拟与污染控制研究[J]. 水电能源科学, 40(9): 70−73.
[30] 吴贻创, 何守阳, 杨应增, 等. 2019. 喀斯特山区河流水环境容量核算与污染控制的单元化研究——以清水江流域鱼梁江河段为例[J]. 中国农村水利水电, (9): 111−120.
[31] 杨晨, 徐明德, 郭媛. 2017. 基于MIKE21的汾河水库突发环境事件数值模拟[J]. 灌溉排水学报, 36(11): 115−121.
[32] 张光科. 1999. 山区河流若干特性研究[J]. 四川联合大学学报(工程科学版), 3(1): 14−22.
[33] 张昊, 张代钧. 2010. 复杂水环境模拟研究与发展趋势[J]. 环境科学与管理, 35(4): 24−28.
[34] 张亚丽, 王艺铭, 史淑娟, 等. 2018. 基于QUAL2K模型的鹤壁卫河水质模拟预警研究[J]. 中国环境监测, 34(5): 138−143.
[35] 钟宗莲. 2016. 小流域水环境系统运行特性分析[D]. 西南交通大学.
-


图(8)
表(5)
计量
- 文章访问数: 648
- PDF下载数: 71
- 施引文献: 0