

Study on General Situation and Analysis of Supply and Demand of Global Phosphate Resources
-
摘要:
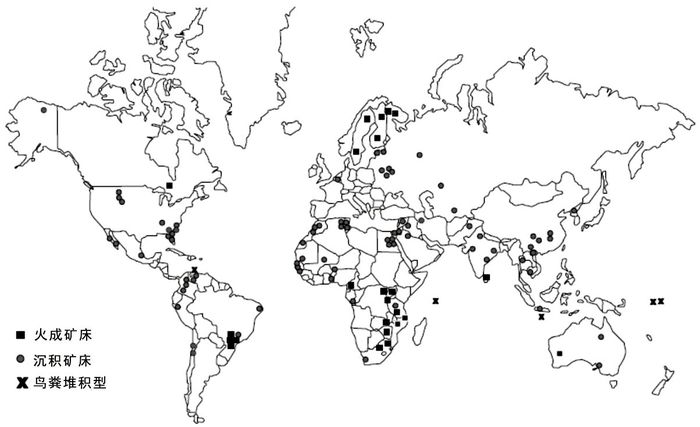
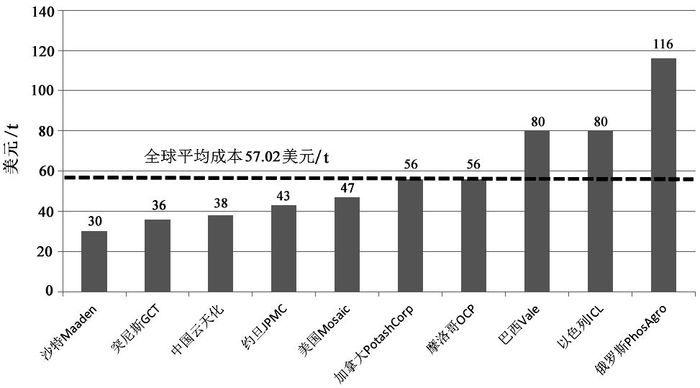
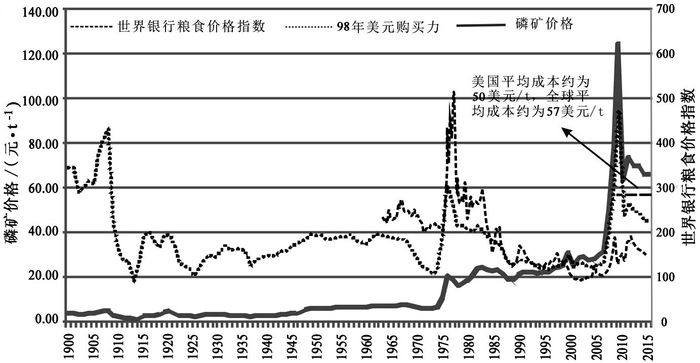
全球磷矿资源丰富,保障程度高,但资源分布和产量极不均衡,目前全球磷矿资源供应中心正由北美、东亚等地区逐步转向北非和中东等地区。全球磷矿资源开发加权平均P2O5入选品位为19.61%,选矿回收率63.01%,中国"三率"调查数据表明我国磷矿平均入选P2O5品位为19.4%,选矿回收率为89.97%,磷矿开发利用水平较高。全球大型磷矿企业加权平均生产成本大约为57美元/t,中国为38美元/t,生产成本低于全球平均水平,但中国磷矿生产成本有逐步上涨趋势。现阶段,全球磷矿市场供大于求,随着摩洛哥、沙特等国优质磷矿资源大规模开发,磷矿供应过剩局面仍将持续,在矿业市场复苏、资源供给、粮食价格、利润空间等多重因素影响下,全球磷矿价格短期内小幅上涨,但出现大幅度上涨的可能性不大。
Abstract:The global phosphate resources are abundant, but the distribution of them is uneven. The supply center of phosphate resources gradually transfers from North America and East Asia to North Africa and the Middle East. The global average grade of phosphate ore is 19.61%, and the ore dressing recovery is 63.01%. According to the "Three Indexes Survey" of China, the average feed grade of phosphate ore is 19.4%, the ore dressing recovery is 89.97%, indicating that the development and utilization of phosphate ore is relatively advanced in China. Compared with the global average production cost (57 $/t), the production cost in China (38 $/t) is relatively low, but it shows an upward trend. Due to the exploration of phosphate ore resources in Morocco, Saudi Arabia and other countries, the global market provides more phosphate ores than the demand, and this trend will be maintained. Under the influence of multiple factors, i.e., the mining market recovery, resource supply, food prices, profit margin, the global phosphate prices will present a modest rise rather than a sharp rise in the short term.
-
Key words:
- phosphate resources /
- analysis of supply and demand /
- global /
- market
-

-
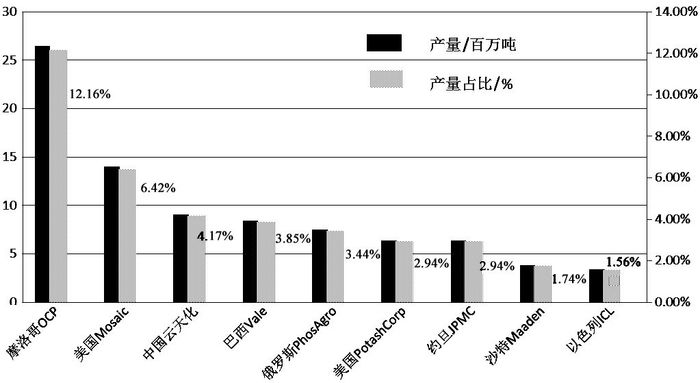
表 1 全球2016年磷矿资源储量和产量分布
Table 1. Reserves and yield distribution of the global phosphate resources in 2016
国家 产量/kt 产量占比/% 储量/kt 储量占比/% 美国 27 800 10.66 1 100 000 1.62 阿尔及利亚 1 500 0.58 2 200 000 3.24 澳大利亚 2 500 0.96 1 100 000 1.62 中国 138 000 52.92 3 100 000 4.57 约旦 8 300 3.18 1 200 000 1.77 摩洛哥和西撒哈拉 30 000 11.50 50 000 000 73.72 俄罗斯 11 600 4.45 1 300 000 1.92 叙利亚 - - 1 800 000 2.65 其他国家 41 060 15.75 6 025 000 8.88 全球总量 260 760 100 67 825 000 100  下载: 导出CSV
表 2 2019年前全球各国部分磷矿新开和扩产项目
Table 2. Some new and expanded project of phosphate resources around the world before 2019
国家 俄罗斯 巴西 秘鲁 摩洛哥 沙特 约旦 矿山项目 Acron Copebras Bayovar OCP Maaden JPMC 产能/(万t·a-1) 200 140 190 2 000 170 250
下载: 导出CSV
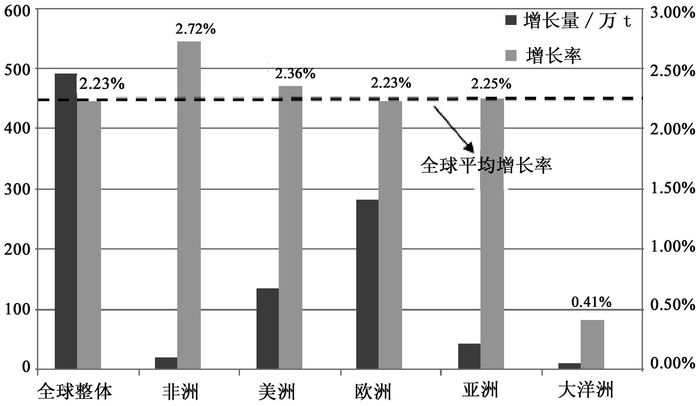
表 3 全球各区域磷肥需求量2014—2018年(以P2O5计,单位万t,源于FAO, 2015)
Table 3. Demand for phosphate fertilizer in various regions of the world: 2014—2018(at P2O5, unit 10 000 t, derived from FAO, 2015)

2013 2014 2015 2016 2017 2018 5年增长量 年均增长率/% 全球 4 172.7 4 270.6 4 380.3 4 474 4 571.8 4 664.8 492.1 2.23 非洲 138.4 143.1 146.8 150.9 155.1 159.3 20.9 2.72 北非 59.6 61.4 63.4 65.5 67.6 69.7 10.1 3.21 非洲沙哈 78.8 81.7 83.3 85.4 87.5 89.6 10.8 2.34 美洲 1 140 1 161.7 1 184.4 1 212.3 1 245 1 275.2 135.2 2.36 北美 483 479.5 476.5 478.4 485.3 490 7 0.54 拉美与加勒比 657 682.2 707.9 733.9 759.7 785.1 128.1 3.58 亚洲 2 402.2 2 458.4 2 534.6 2 584.7 2 635.8 2 685.1 282.9 2.23 西亚 104.3 103.3 115.5 121 127.6 132 27.7 6.32 南亚 765.8 805.8 851.1 877 902.8 929 163.2 3.62 东亚 1 532.1 1 549.3 1 568 1 586.7 1 605.4 1 624.2 92.1 1.19 377.6 384.9 394 403.9 412.4 420.7 43.1 2.25 中欧 69.7 72.9 75.7 78.6 81.5 84.2 14.5 3.67 西欧 187.6 189.8 190.5 191.1 191.2 190.9 3.3 0.14 东欧与中亚 120.3 122.2 127.8 134.2 139.7 145.6 25.3 4.47 大洋洲 114.6 122.6 120.6 122.2 123.5 124.6 10 0.41
下载: 导出CSV
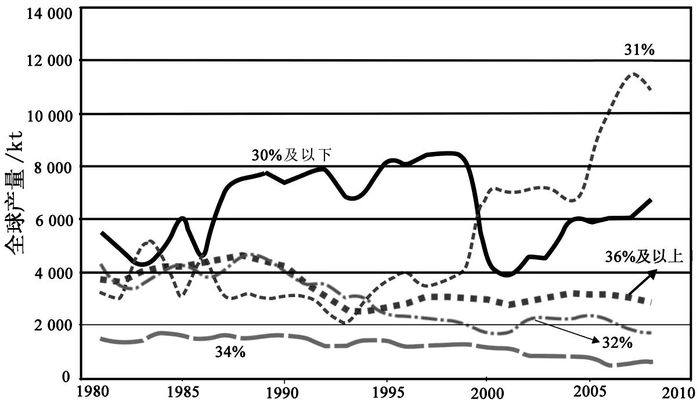
表 4 全球磷矿重点区域采选指标统计结果 /%
Table 4. Statistical results of the mining and dressing indexes of the key phosphate areas in the world
下载: 导出CSV
-
[1] Van Kauwenbergh S J. World phosphate rock reserves and resources[R]. Savannah:IFDC, 2010:16-18.
[2] Van Kauwenbergh S J. Global phosphate rock reserves and resources, the future of phosphate fertilizer[R]. Savannah:IFDC, 2014.
[3] T D Kelly, G R Matos, D W Buckingham, et al. Historical statistics for mineral and material commodities in the united states[R]. Reston, VA:USGS, 2005.
[4] USGS. Mineral commodity summaries 2015[R]. Reston, VA:USGS, 2016.
[5] M D Ridder, S D Jong, J Polchar, et al. Risks and opportunities in the global phosphate rock market:robust strategies in times of uncertainty[R]. Hague:HCSS, 2012.
[6] A Organization. World fertilizer trend sand outlook to 2018[R]. Washington:FAO, 2015.
[7] 中国地质科学院郑州矿产综合利用研究所. 全国重要矿山"三率"综合调查与评价[R]. 郑州: 中国地质科学院郑州矿产综合利用研究所, 2011.
[8] Infomine. Investment mine[EB/OL]. (2015-7-30)[2017-04-20]. http://www/infomine/com.
[9] M Heckenmüller, D Narita, G Klepper. Global availability of phosphorus and its implications for global food supply:an economic overview[R]. Kiel:Kiel Institute for the World Economy, 2014.
[10] 鲍荣华.世界磷矿供需格局及其变化[J].国土资源情报, 2015(5):48-51. http://www.cqvip.com/QK/97514X/201505/665366487.html
-

图(9)
表(4)
计量
- 文章访问数: 1853
- PDF下载数: 72
- 施引文献: 0