

Investigation and Evaluation of Heavy Metal Pollution in Soil from Zhengzhou City
-
摘要:
本文采用电感耦合等离子体质谱、原子荧光光谱法对郑州市及周边地区化探扫面(1 : 10万)采集的1014个表层土壤样品进行分析, 结合单因子污染指数法、内梅罗指数法评价了土壤中重金属含量水平、形态特征和污染分布状况。结果表明, 8种重金属的平均含量都低于《土壤环境质量标准》Ⅰ类土壤的临界值; 从地表到深部重金属元素含量逐步降低; 在测区1000 km2范围内, 一级、二级、三级土壤面积分别占89.6%、9.4%、1.0%, 土壤质量总体良好。在极个别中、重度污染区, 重金属主要以难以迁移和被植物利用的残渣态、铁锰氧化态形式存在, 目前对人及环境的实际危害很小。
-
关键词:
- 土壤质量 /
- 重金属污染评价 /
- 电感耦合等离子体质谱法 /
- 原子荧光光谱法
Abstract:The heavy metal contents of 1014 surface soil samples from a geochemical survey (1:100000) in Zhengzhou city and its surrounding areas has been determined by Inductively Coupled Plasma-Mass Spectrometry (ICP-MS) and Atomic Fluorescence Spectrometry (AFS). The single-factor index method and Nemerow index method were also used to evaluate the content level and morphological characteristics of heavy metals, and the distribution of their pollution. Analytical results show that the average contents of eight types of heavy metals are below the critical value of soil category I in the environmental quality standard for soils and the content of heavy metals decreases from the surface to the deep soil. In the 1000 km2 testing area, first-class, second-class and third-class soils account for 89.6%, 9.4%, and 1.0%, respectively, indicating good soil quality. In a few moderately and strongly polluted areas, heavy metals exist in the forms of a residual, ferri-manganese oxidation state, which were hard to migrate or use by plants and thus are not harmful to people and the environment.
-

-
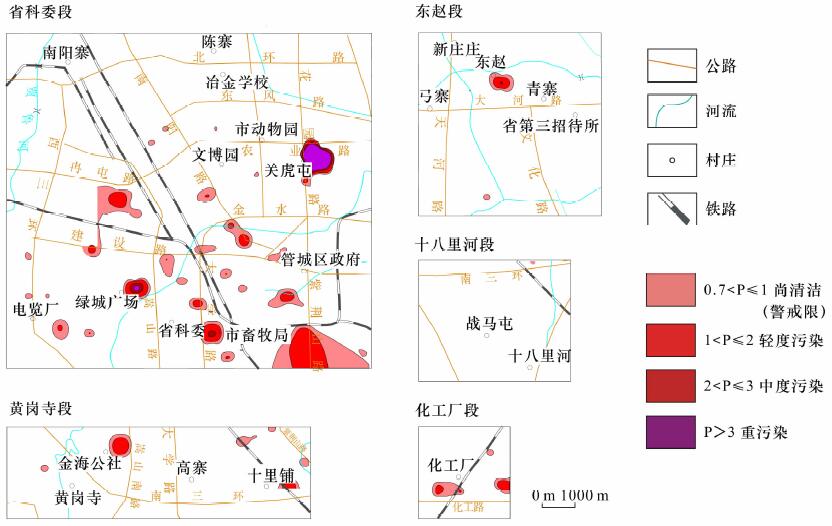
表 1 异常区地球化学元素特征值
Table 1. The contents of soil pollutants in anomaly area
采样
区段样品
个数项目 As Hg Cr Ni Cu Zn Cd Pb 省科委 577 范围(mg/kg) 4.71~40.31 14.65~32885.79 28.31~197.37 10.46~88.5 10.02~153.55 33.04~449.82 0.016~1.186 15.97~219 均值(mg/kg) 8.75 218.20 56.44 19.87 24.10 89.55 0.18 29.87 标准偏差
(mg/kg)2.22 1390.24 15.09 4.77 11.34 40.88 0.14 17.14 变异系数 25.42 637.15 26.74 24.01 47.06 45.65 73.99 57.38 化工厂 71 范围(mg/kg) 5.77~13.09 15.15~759.6 32.65~94.5 14.63~79.27 11.09~262.7 38.65~387.5 0.06~0.964 15.83~140.7 均值(mg/kg) 9.67 65.16 61.22 22.26 23.54 73.63 0.17 27.83 标准偏差
(mg/kg)1.39 106.69 15.02 7.55 29.58 46.08 0.14 17.11 变异系数 14.40 163.73 24.53 33.90 125.70 62.58 84.61 61.47 东赵 150 范围(mg/kg) 3.49~19.02 14.73~21.83 37.17~2.47 15.2~163.07 13.04~67.42 38.12~240 0.035~0.754 14.63~34.2 均值(mg/kg) 9.62 56.62 59.44 24.13 23.65 76.56 0.14 21.65 标准偏差
(mg/kg)2.55 44.81 16.35 12.25 7.86 30.16 0.09 3.77 变异系数 26.48 79.13 27.50 50.76 33.22 39.39 66.12 17.40 黄岗寺 205 范围(mg/kg) 4.87~12.86 5.32~1233.12 27.2~148.8 10.74~43.54 11.44~133.02 39.1~180.72 0.047~1.798 15.35~364.9 均值(mg/kg) 8.73 72.87 51.54 19.23 19.68 66.34 0.14 28.82 标准偏差
(mg/kg)1.43 114.25 12.39 2.86 9.27 18.60 0.15 38.64 变异系数 16.36 156.80 24.05 14.88 47.11 28.03 103.43 134.09 十八里河 102 范围(mg/kg) 2.72~13.76 15.4~462.22 32.4~91.3 11.6~28.87 10.38~62.46 40.71~180.86 0.026~0.612 15.67~70.31 均值(mg/kg) 7.40 57.69 50.09 17.74 17.58 74.01 0.10 24.67 标准偏差
(mg/kg)1.30 55.45 9.87 3.17 5.60 25.54 0.07 6.94 变异系数 17.61 96.12 19.71 17.88 31.84 34.51 68.37 28.15 注:Hg的数据单位为μg/kg。  下载: 导出CSV
-
[1] [2] [3] [4] [5] [6] 刘剑锋, 谷宁, 张可慧.土壤重金属空间分异及迁移研究进展与展望[J].地理与地理信息科学, 2012, 28(2):99-102.
Liu J F, Gu N, Zhang K H.Progress and Prospect of Soil Heavy Metal Spatial Differentiation and Migration[J].2012, 28(2):99-102.
[7] [8] -

图(2)
表(1)
计量
- 文章访问数: 1410
- PDF下载数: 884
- 施引文献: 0