

DISTRIBUTION PATTERN AND ASSESSMENT OF HEAVY METALS IN THE SEDIMENTS OF NORTH GUANG-LI RIVER ESTUARY
-
摘要:
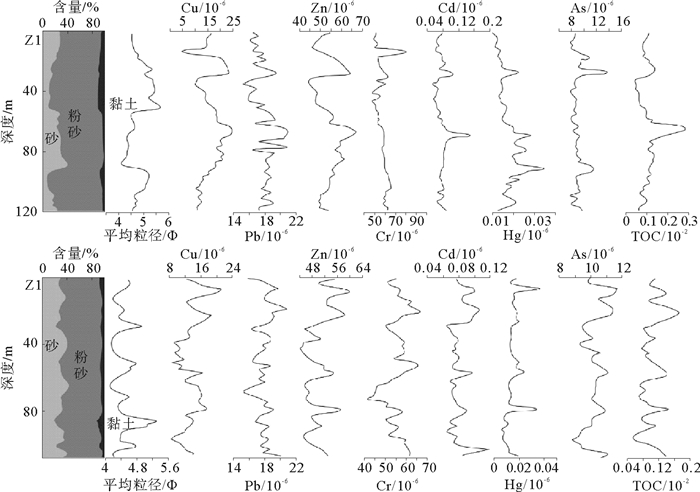
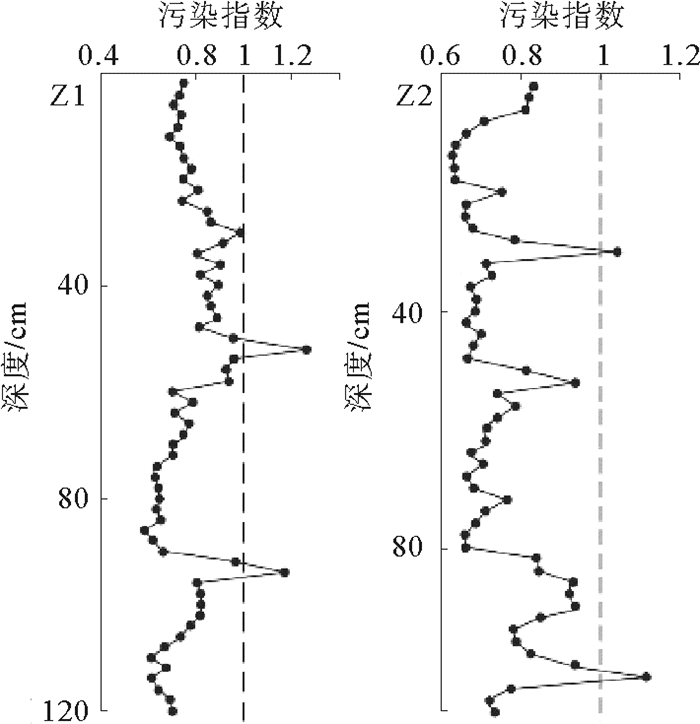
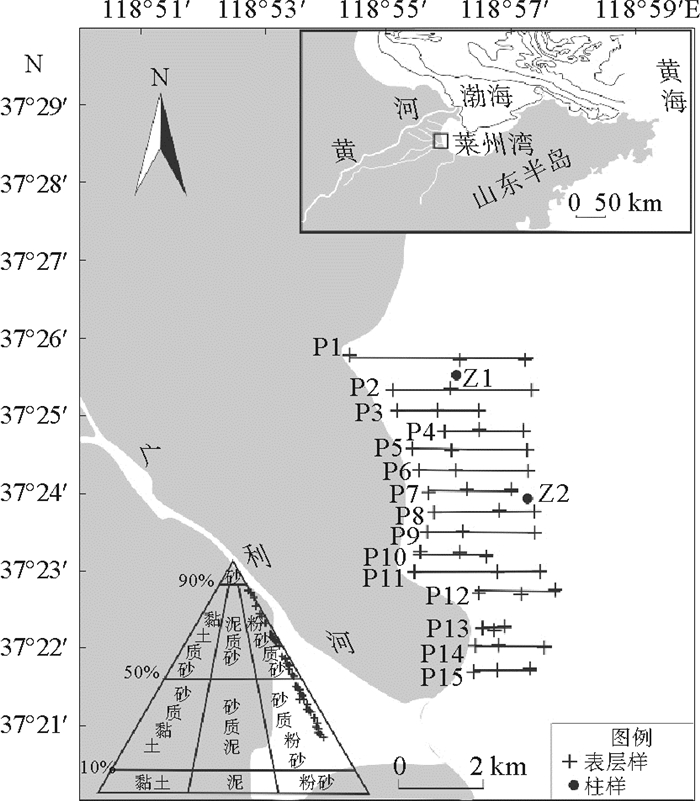
基于广利河口北潮滩45个表层沉物和2个岩心柱样重金属、粒度、TOC数据,分析了广利河口北潮滩沉积物重金属分布规律及其来源,采用内梅罗综合指数法进行质量评价。结果表明:Cu、Pb、Zn、Cr、Cd、Hg、As 7种元素含量低于国家一类标准;在空间分布特征上,距岸一定范围内数值相对较高,主要受沿岸余流作用的影响;就来源而言,Cr元素明显为广利河注入,表层、Z1和Z2沉积物粒度对重金属的控制作用有明显差异;研究区内Cr和As污染指数最高,Cu污染指数变化最大,综合污染指数呈“哑铃状”分布,靠近现代黄河口和广利河口各高值相对较高。目前广利河口北潮滩重金属含量没有到达污染的程度,但有向轻度污染发展的趋势。
Abstract:Based on the data of heavy metals, grain sizes and TOC for 45 surface sediments and 2 core columns taken from the north tidal flat of the Guang-li River estuary, we studied the distribution patterns and sources of heavy metals in the sediments of the estuary. Environmental quality evaluation is made with the Nemerow comprehensive index. The results show that the 7 elements of Cu, Pb, Zn, Cr, Cd, Hg and As, are all lower than the national standard of heavy metal pollution. In the spatial distribution, a high value anomaly of heavy metals is discovered in a place to certain distance from the shore, under the influence of coastal residual current. In terms of the source, however, the Cr element is clearly injected by the Guang-li River. In the sediments taken from the surface and the Z1 and Z2 sinks, grain size has obvious controlling effect over heavy metal distribution. The pollution indices of Cr and As remain the highest in the study area, while the pollution index of Cu changes greatly. The distribution of comprehensive pollution index is in a "dumbbell-like" pattern, with a high value region near the modern Yellow River estuary and another in the Guang-li River estuary. To conclude, the heavy metal content in the north tidal flat of the Guang-li River estuary has so far not reached the level of pollution, but the trend of development towards slight pollution is observed.
-
Key words:
- Guang-li River estuary /
- northern tidal flat /
- sediment /
- heavy metals /
- environments assessment
-

-
表 1 沉积物重金属的统计特征值
Table 1. Heavy metal contents of sediments
特征值 Cu Pb Zn Cr Cd Hg As 表层 最小值 1.20 12.20 40.40 51.70 0.06 0.008 7.79 最大值 22.80 19.80 60.50 81.30 0.12 0.028 11.40 平均值 9.16 17.08 47.23 61.54 0.084 0.015 9.51 变异系数 0.54 0.086 0.092 0.11 0.202 0.30 0.076 Z1 最小值 1.00 14.80 43.70 47.10 0.051 0.010 7.46 最大值 25.00 21.50 68.20 93.60 0.18 0.039 15.90 平均值 16.39 18.02 54.69 58.04 0.079 0.018 9.05 变异系数 0.30 0.088 0.110 0.12 0.23 0.32 0.14 Z2 最小值 8.10 15.00 44.50 40.40 0.059 0.006 8.49 最大值 21.40 21.00 60.80 67.10 0.12 0.043 11.70 平均值 13.66 17.96 50.27 55.84 0.082 0.015 10.24 变异系数 0.22 0.068 0.087 0.10 0.16 0.44 0.071 一类标准[22] 35.00 60.00 150.00 80.00 0.50 0.20 20.00 二类标准[22] 100.00 130.00 350.00 150.00 1.50 0.50 65.00 莱州湾[13] 21.96 21.99 60.41 60.00 0.12 0.05 12.64 渤海[23] 22.00 20.00 64.00 57.00 0.09 0.04 9.00  下载: 导出CSV
表 2 广利河口北潮滩沉积物重金属元素富集系数
Table 2. Enrichment factor of heavy metal elements of the sediments in study area
研究区域 Cu Pb Zn Cr Cd Hg As 黄河[24] 表层 0.70 1.14 1.18 1.03 1.09 0.99 1.27 Z1 1.26 1.20 1.37 0.97 1.02 1.17 1.21 Z2 1.05 1.20 1.26 0.93 1.06 1.01 1.37 莱州湾[13] 表层 0.42 0.78 0.78 1.03 0.70 0.29 0.75 Z1 0.75 0.82 0.91 0.97 0.66 0.35 0.72 Z2 0.62 0.82 0.83 0.93 0.68 0.30 0.81 渤海[23] 表层 0.42 0.85 0.74 1.08 0.93 0.41 1.06 Z1 0.74 0.90 0.85 1.02 0.88 0.49 1.01 Z2 0.62 0.90 0.79 0.98 0.91 0.42 1.14
下载: 导出CSV
表 3 丰枯季重金属含量变化
Table 3. Comparison of heavy metal element contents between flooding and drying seasons
样品号 Cu Pb Zn Cr Cd Hg As 丰 枯 丰 枯 丰 枯 丰 枯 丰 枯 丰 枯 丰 枯 P1 潮上带 16 14.5 13 17 49.5 54 60.1 61 0.08 0.087 0.0098 0.013 7.79 9.79 潮间带 10.2 11 18.6 18.3 48 49 61.4 62 0.092 0.084 0.012 0.016 9.58 11 潮下带 6.2 9.2 16.8 18 41.2 44 57.2 59 0.066 0.059 0.01 0.014 10.1 10.1 P4 潮上带 6.3 15.4 17.5 20.4 51.2 54 73.6 64 0.1 0.11 0.022 0.014 9 9.83 潮间带 3 9.3 15.6 19.6 44.9 53 66.3 71 0.076 0.099 0.016 0.02 9.41 10.4 潮下带 5.7 12.3 15.6 19.5 41.5 47 58.6 59 0.064 0.075 0.012 0.016 10.4 13.6 P7 潮上带 15.2 13.4 16.2 16.8 53.6 54 57.8 64 0.11 0.1 0.015 0.018 9.71 11.2 潮间带 7.9 8.3 17.8 16.6 46.6 49 66.5 67 0.077 0.096 0.018 0.022 9.04 10.6 潮下带 8.9 7.2 16.7 17.7 46.5 44 56.7 60 0.078 0.081 0.015 0.017 10.1 10.7 P10 潮上带 13.1 14.2 17.3 18.9 52.5 56 64.1 73 0.12 0.085 0.017 0.017 9.21 10.9 潮间带 1.2 2.8 17.1 17.3 48.7 49 72.4 75 0.096 0.1 0.016 0.018 8.6 9.47 潮下带 4.8 8.05 17.7 18.8 45.2 46 69.5 65 0.089 0.081 0.014 0.016 9.01 12 P13 潮上带 4.15 13.7 16.8 14.2 43.3 47 66.3 19 0.066 0.04 0.011 0.014 8.35 9.81 潮间带 2.1 7 16.3 17.6 42.9 42 74.9 55 0.071 0.079 0.0082 0.015 9.38 11.1 潮下带 2.1 11.1 16.4 16.8 40.4 42 55.9 45 0.061 0.071 0.011 0.013 9.64 12.7
下载: 导出CSV
表 4 广利河口北潮滩表层沉积物元素相关性分析
Table 4. Correlation coefficients of the elements in the surface sediments of study area
Cu Pb Zn Cr Cd Hg As 砂 粉砂 黏土 Cu 1.00 Pb 0.15 1.00 Zn 0.71 0.36 1.00 Cr -0.52 0.18 0.03 1.00 Cd 0.58 0.36 0.75 0.09 1.00 Hg -0.08 0.33 0.18 0.29 0.06 1.00 As 0.24 0.09 0.01 -0.39 -0.06 0.10 1.00 砂 -0.59 -0.25 -0.87 -0.14 -0.74 -0.03 0.28 1.00 粉砂 0.56 0.56 0.56 0.17 0.72 0.03 -0.31 -1.00 1.00 黏土 0.70 0.24 0.91 -0.06 0.75 0.05 -0.08 -0.90 0.86 1.00
下载: 导出CSV
表 5 Z1沉积物元素相关性分析
Table 5. Correlation coefficients between elements in Z1
Cu Pb Zn Cr Cd Hg As TOC 砂 粉砂 黏土 Cu 1.00 Pb 0.50 1.00 Zn 0.79 0.66 1.00 Cr -0.43 0.14 0.15 1.00 Cd 0.49 0.51 0.64 0.11 1.00 Hg 0.34 0.45 0.47 0.21 0.51 1.00 As 0.23 0.15 0.35 0.16 0.29 0.47 1.00 TOC 0.70 0.65 0.81 0.10 0.49 0.37 0.11 1.00 砂 -0.43 -0.26 -0.55 -0.14 -0.36 -0.33 -0.36 -0.30 1.00 粉砂 0.39 0.16 0.45 0.07 0.23 0.17 0.32 0.26 -0.96 1.00 黏土 0.37 0.43 0.61 0.27 0.55 0.64 0.33 0.31 -0.70 0.49 1.00
下载: 导出CSV
表 6 Z2沉积物元素相关性分析
Table 6. Correlation coefficients between elements in Z2
Cu Pb Zn Cr Cd Hg As TOC 砂 粉砂 黏土 Cu 1.00 Pb 0.24 1.00 Zn 0.62 0.53 1.00 Cr -0.28 0.51 0.46 1.00 Cd 0.43 0.56 0.68 0.42 1.00 Hg 0.52 0.32 0.62 0.26 0.45 1.00 As 0.59 0.31 0.74 0.26 0.53 0.54 1.00 TOC 0.48 0.54 0.87 0.55 0.64 0.57 0.71 1.00 砂 -0.41 -0.47 -0.73 -0.40 -0.52 -0.45 -0.45 -0.69 1.00 粉砂 0.35 0.32 0.56 0.24 0.37 0.34 0.27 0.49 -0.95 1.00 黏土 0.41 0.61 0.83 0.59 0.67 0.51 0.67 0.87 -0.75 0.52 1.00
下载: 导出CSV
表 7 广利河口北潮滩沉积物重金属单因子污染指数
Table 7. Single factor pollution index of heavy metals in the sediments of study area
单因子污染指数 Cu Pb Zn Cr Cd Hg As 最小值 0.055 0.610 0.631 0.907 0.667 0.228 0.866 表层 最大值 1.036 0.990 0.945 1.426 1.333 0.778 1.267 平均值 0.416 0.854 0.738 1.080 0.932 0.411 1.056 最小值 0.045 0.740 0.683 0.826 0.567 0.278 0.829 Z1 最大值 1.136 1.075 1.066 1.642 2.000 1.083 1.767 平均值 0.745 0.901 0.855 1.018 0.876 0.489 1.005 最小值 0.368 0.750 0.695 0.709 0.656 0.175 0.943 Z2 最大值 0.973 1.050 0.950 1.177 1.333 1.194 1.300 平均值 0.621 0.898 0.786 0.980 0.906 0.421 1.138
下载: 导出CSV
-
[1] Zhang C, Shan B Q, Tang W Z, et al. Heavy metal concentrations and speciation in riverine sediments and the risks posed in three urban belts in the Haihe Basin[J]. Ecotoxicology & Environmental Safety, 2017, 139:263-271. http://www.wanfangdata.com.cn/details/detail.do?_type=perio&id=d46608cafc648a1f4c7c1bda985a9e05
[2] 张勇, 张现荣, 毕世普, 等.我国近海海域沉积物重金属分布特征与环境质量评价[J].海洋地质前沿, 2012, 28(11):38-42. http://www.jhyqy.com.cn/article/id/94501d64-3dfd-4412-9711-f0c7af504828
[3] 王永红, 张经, 沈焕庭.潮滩沉积物重金属累积特征研究进展[J].地球科学进展, 2002, 17(1):69-77. doi: 10.3321/j.issn:1001-8166.2002.01.011
[4] 徐刚, 刘健, 孔祥淮, 等.近海沉积物重金属污染来源分析[J].海洋地质沿, 2012, 28(11):47-52. http://www.wanfangdata.com.cn/details/detail.do?_type=perio&id=hydzdt201211009
[5] 王应飞, 高建华, 石勇, 等.鸭绿江河口西岸潮间带柱状沉积物中重金属的分布特征及其对流域变化的响应[J].地球化学, 2014, 43(1):64-76. http://www.wanfangdata.com.cn/details/detail.do?_type=perio&id=dqhx201401007
[6] 李淑媛, 刘国贤, 苗丰民.渤海沉积物中重金属分布及环境背景值[J].中国环境科学, 1995(5):370-376. http://www.wanfangdata.com.cn/details/detail.do?_type=perio&id=QK199400576329
[7] 霍素霞, 邢聪聪, 朱超祁, 等.渤海沉积物重金属含量时间演化特征及影响因素研究[J].中国海洋大学学报:自然科学版, 2017, 47(10):42-49. http://www.wanfangdata.com.cn/details/detail.do?_type=perio&id=qdhydxxb201710007
[8] 林曼曼, 张勇, 薛春汀, 等.环渤海海域沉积物重金属分布特征及生态环境评价[J].海洋地质与第四纪地质, 2013, 33(6):41-46. http://www.wanfangdata.com.cn/details/detail.do?_type=perio&id=hydzydsjdz201306005
[9] 许艳, 王秋璐, 李潇, 等.环渤海典型海湾沉积物重金属环境特征与污染评价[J].海洋科学进展, 2017, 35(3):428-438. doi: 10.3969/j.issn.1671-6647.2017.03.012
[10] 谢嘉.典型重金属(Cd2+、Pb2+)和有机污染物(BaP、BDE-47)对长牡蛎的复合毒性效应研究[D].烟台: 中国科学院烟台海岸带研究所, 2017: 37-102.
http://cdmd.cnki.com.cn/Article/CDMD-80180-1017811444.htm [11] 罗先香, 张蕊, 杨建强, 等.莱州湾表层沉积物重金属分布特征及污染评价[J].生态环境学报, 2010, 19(2):262-269. doi: 10.3969/j.issn.1674-5906.2010.02.002
[12] 胡宁静, 石学法, 刘季花, 等.莱州湾表层沉积物中重金属分布特征和环境影响[J].海洋科学进展, 2011, 29(1):63-72. doi: 10.3969/j.issn.1671-6647.2011.01.008
[13] 郑懿珉, 高茂生, 刘森, 等.莱州湾表层沉积物重金属分布特征及生态环境评价[J].海洋环境科学, 2015, 34(3):354-360. http://www.wanfangdata.com.cn/details/detail.do?_type=perio&id=hyhjkx201503006
[14] 刘金虎, 宋骏杰, 曹亮, 等.莱州湾表层沉积物中重金属时空分布、污染来源及风险评价[J].生态毒理学报, 2015, 10(2):369-381. http://www.wanfangdata.com.cn/details/detail.do?_type=perio&id=cyyhj201502046
[15] 沈佳裕, 罗先香, 郑浩, 等.小清河口及邻近海域表层沉积物重金属污染及生态风险特征[J].环境化学, 2017, 36(7):1516-1524. http://www.wanfangdata.com.cn/details/detail.do?_type=perio&id=hjhx201707010
[16] 刘淑民, 姚庆祯, 刘月良, 等.黄河口湿地表层沉积物中重金属的分布特征及其影响因素[J].中国环境科学, 2012, 32(9):1625-1631. doi: 10.3969/j.issn.1000-6923.2012.09.013
[17] Sun Z, Mou X, Sun W. Decomposition and heavy metal variations of the typical halophyte litters in coastal marshes of the Yellow River estuary, China[J]. Chemosphere, 2016, 147: 163-172. http://www.wanfangdata.com.cn/details/detail.do?_type=perio&id=ce9d27b60edee2e7abc17fb3ec7392d1
[18] 庞家珍, 司书亨.黄河河口演变(Ⅰ)——近代历史变迁[J].海洋与湖沼, 1979, 10(2): 136-141. http://www.cnki.com.cn/Article/CJFDTotal-HYFZ197902005.htm
[19] 杨荣民, 李广雪, 李安龙, 等.广利河口拦门沙的沉积特征与冲淤过程的研究[J].中国海洋大学学报:自然科学版, 2005, 35(2):339-343. http://www.wanfangdata.com.cn/details/detail.do?_type=perio&id=qdhydxxb200502034
[20] 赵学, 左书华.广利港海域悬沙分布及黄河口泥沙扩散对其影响[J].海洋地质前沿, 2012, 28(9):14-19. http://www.jhyqy.com.cn/article/id/89ef4079-1e02-4910-9df6-643953117aed
[21] 林维田, 吴永亭, 刘建立.广利港河道水位变化及河口拦门沙地形变化分析研究[J].海岸工程, 2008(3):9-14. doi: 10.3969/j.issn.1002-3682.2008.03.002
[22] 国家海洋局.GB 18668—2002海洋沉积物质量[S].北京: 中国标准出版社, 2002.
[23] 赵一阳, 鄢明才.中国浅海沉积物地球化学[M].北京:科学出版社, 1994:61-108.
[24] 刘珊珊, 张勇, 龚淑云, 等.长江三角洲经济区海域沉积物重金属分布特征及环境质量评价[J]海洋地质与第四纪地质, 2013, 33(5):63-70. http://www.wanfangdata.com.cn/details/detail.do?_type=perio&id=hydzydsjdz201305007
[25] 宋静宜, 傅开道, 苏斌, 等.澜沧江水系底沙重金属含量空间分布及其污染评价[J].地理学报, 2013, 68(3):389-397. http://www.wanfangdata.com.cn/details/detail.do?_type=perio&id=dlxb201303010
[26] 蓝先洪, 孟祥君, 梅西, 等.辽东湾表层沉积物的重金属污染特征与质量评价[J].海洋学报, 2018, 40(6):60-73.doi:10.3969/j.issn.0253—4193.2018.06.006
[27] 姜发军, 尹闯, 张荣灿, 等. 2010年冬季广西北部湾近岸海域表层海水和沉积物中重金属污染现状及评价[J].海洋环境科学, 2013, 32(6):824-830. http://www.wanfangdata.com.cn/details/detail.do?_type=perio&id=hyhjkx201306006
[28] 程国栋, 薛春汀.黄河三角洲沉积地质学[M].北京:科学出版社, 1997:30-49.
[29] Bilali L E, Rasmussen P E, Hall G E M, et al. Role of sediment composition in trace metal distribution in lake sediments[J]. Applied Geochemistry, 2002, 17(9): 1171-1181. doi: 10.1016/S0883-2927(01)00132-9
[30] 李壮伟, 陈巧弟, 罗荣真, 等.深圳铜鼓航道表层沉积物中重金属含量及潜在生态危害[J].海洋地质前沿, 2011, 27(9):32-39. http://www.jhyqy.com.cn/article/id/8a026809-f2f1-4738-85f8-33dbff66dc02
[31] 吕晓霞, 翟世奎, 于增慧.长江口及邻近海域表层沉积物中营养元素的分布特征及其控制因素[J].海洋环境科学, 2005, 24(3):1-5. doi: 10.3969/j.issn.1007-6336.2005.03.001
-

图(5)
表(7)
计量
- 文章访问数: 762
- PDF下载数: 58
- 施引文献: 0