

-
摘要:
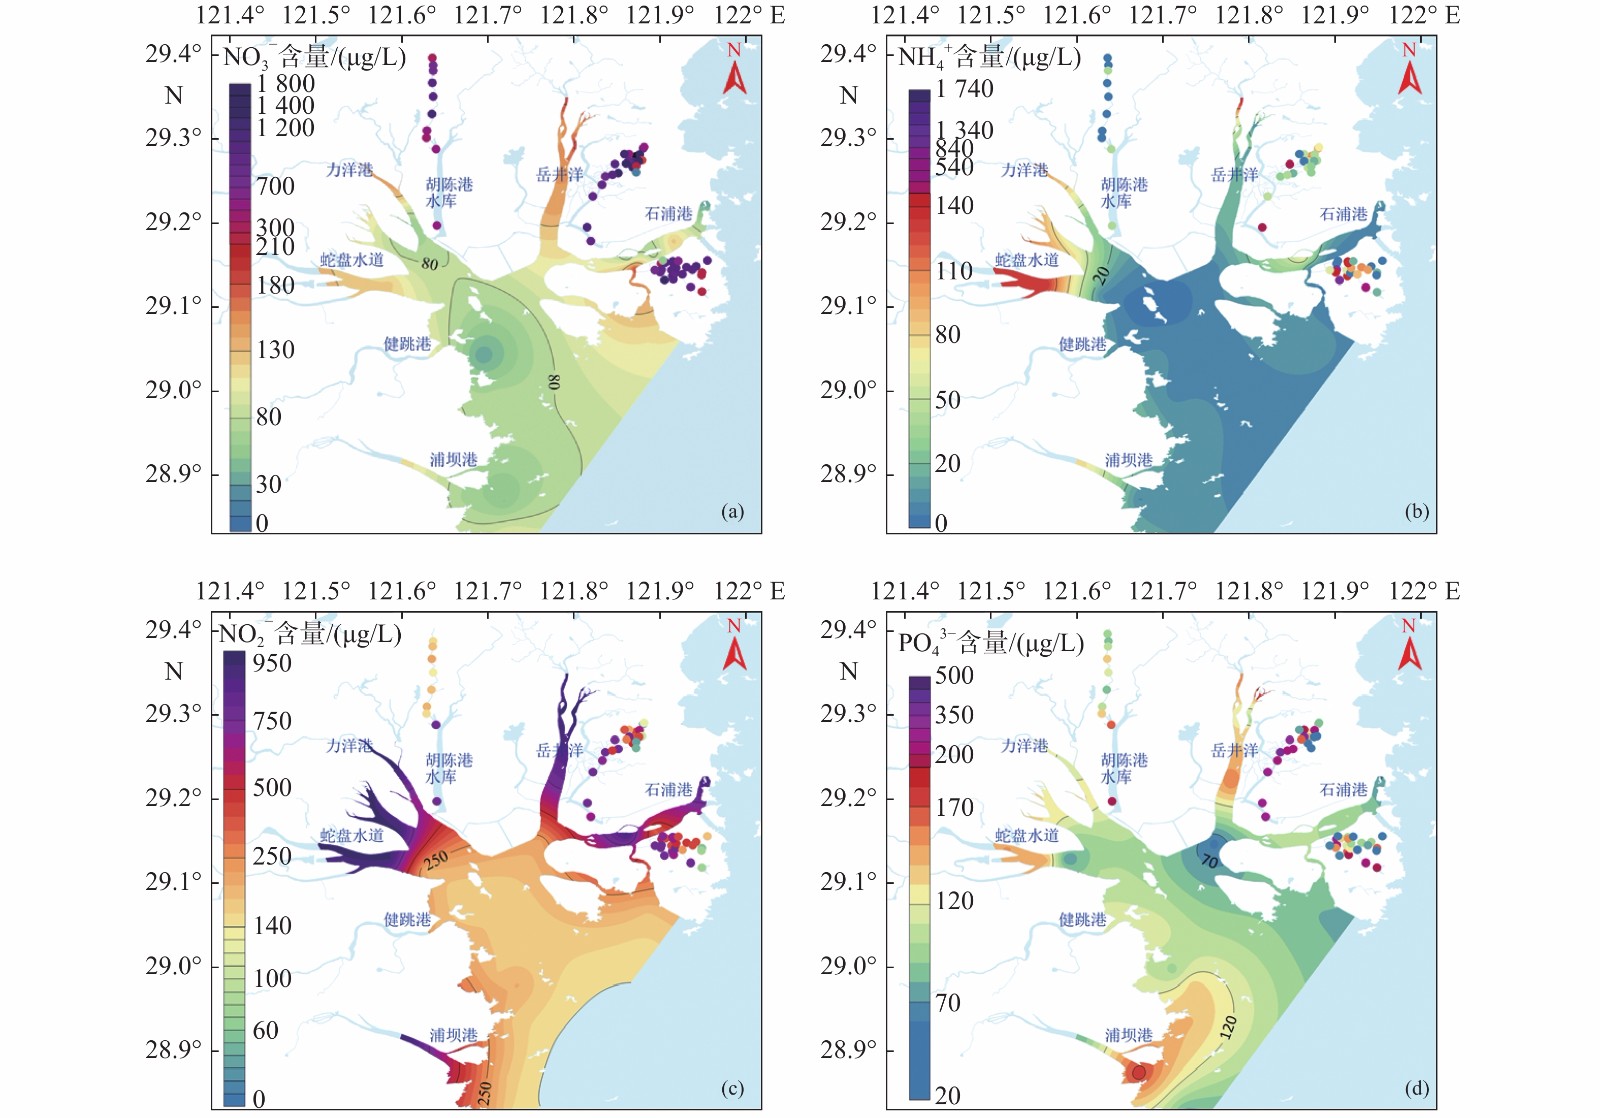
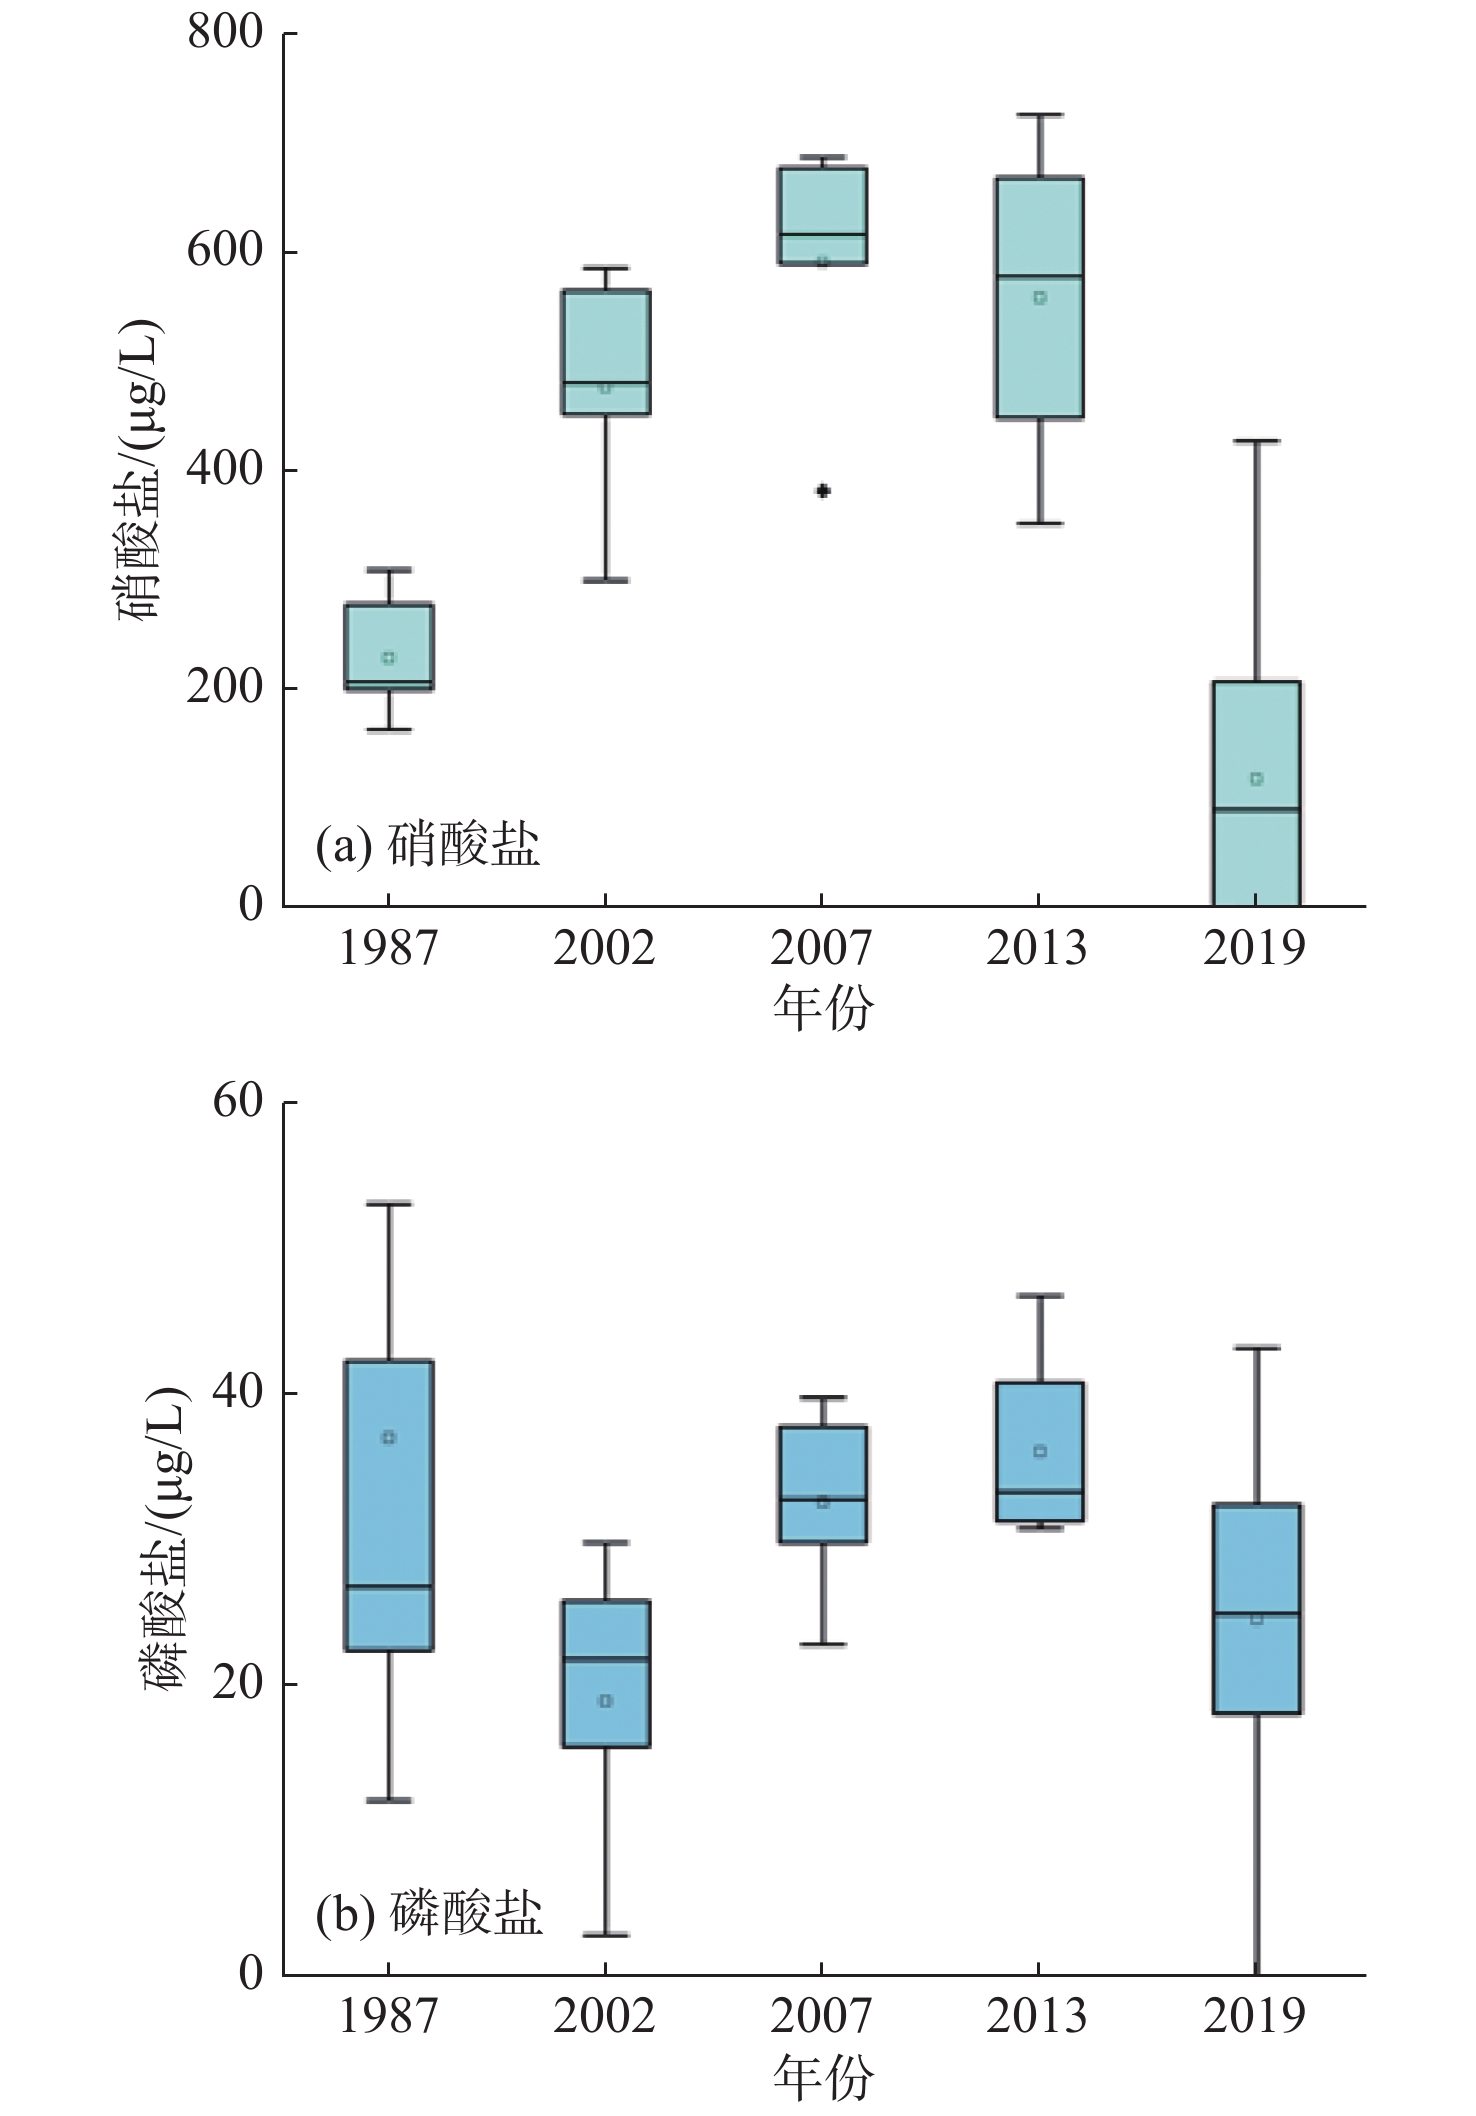
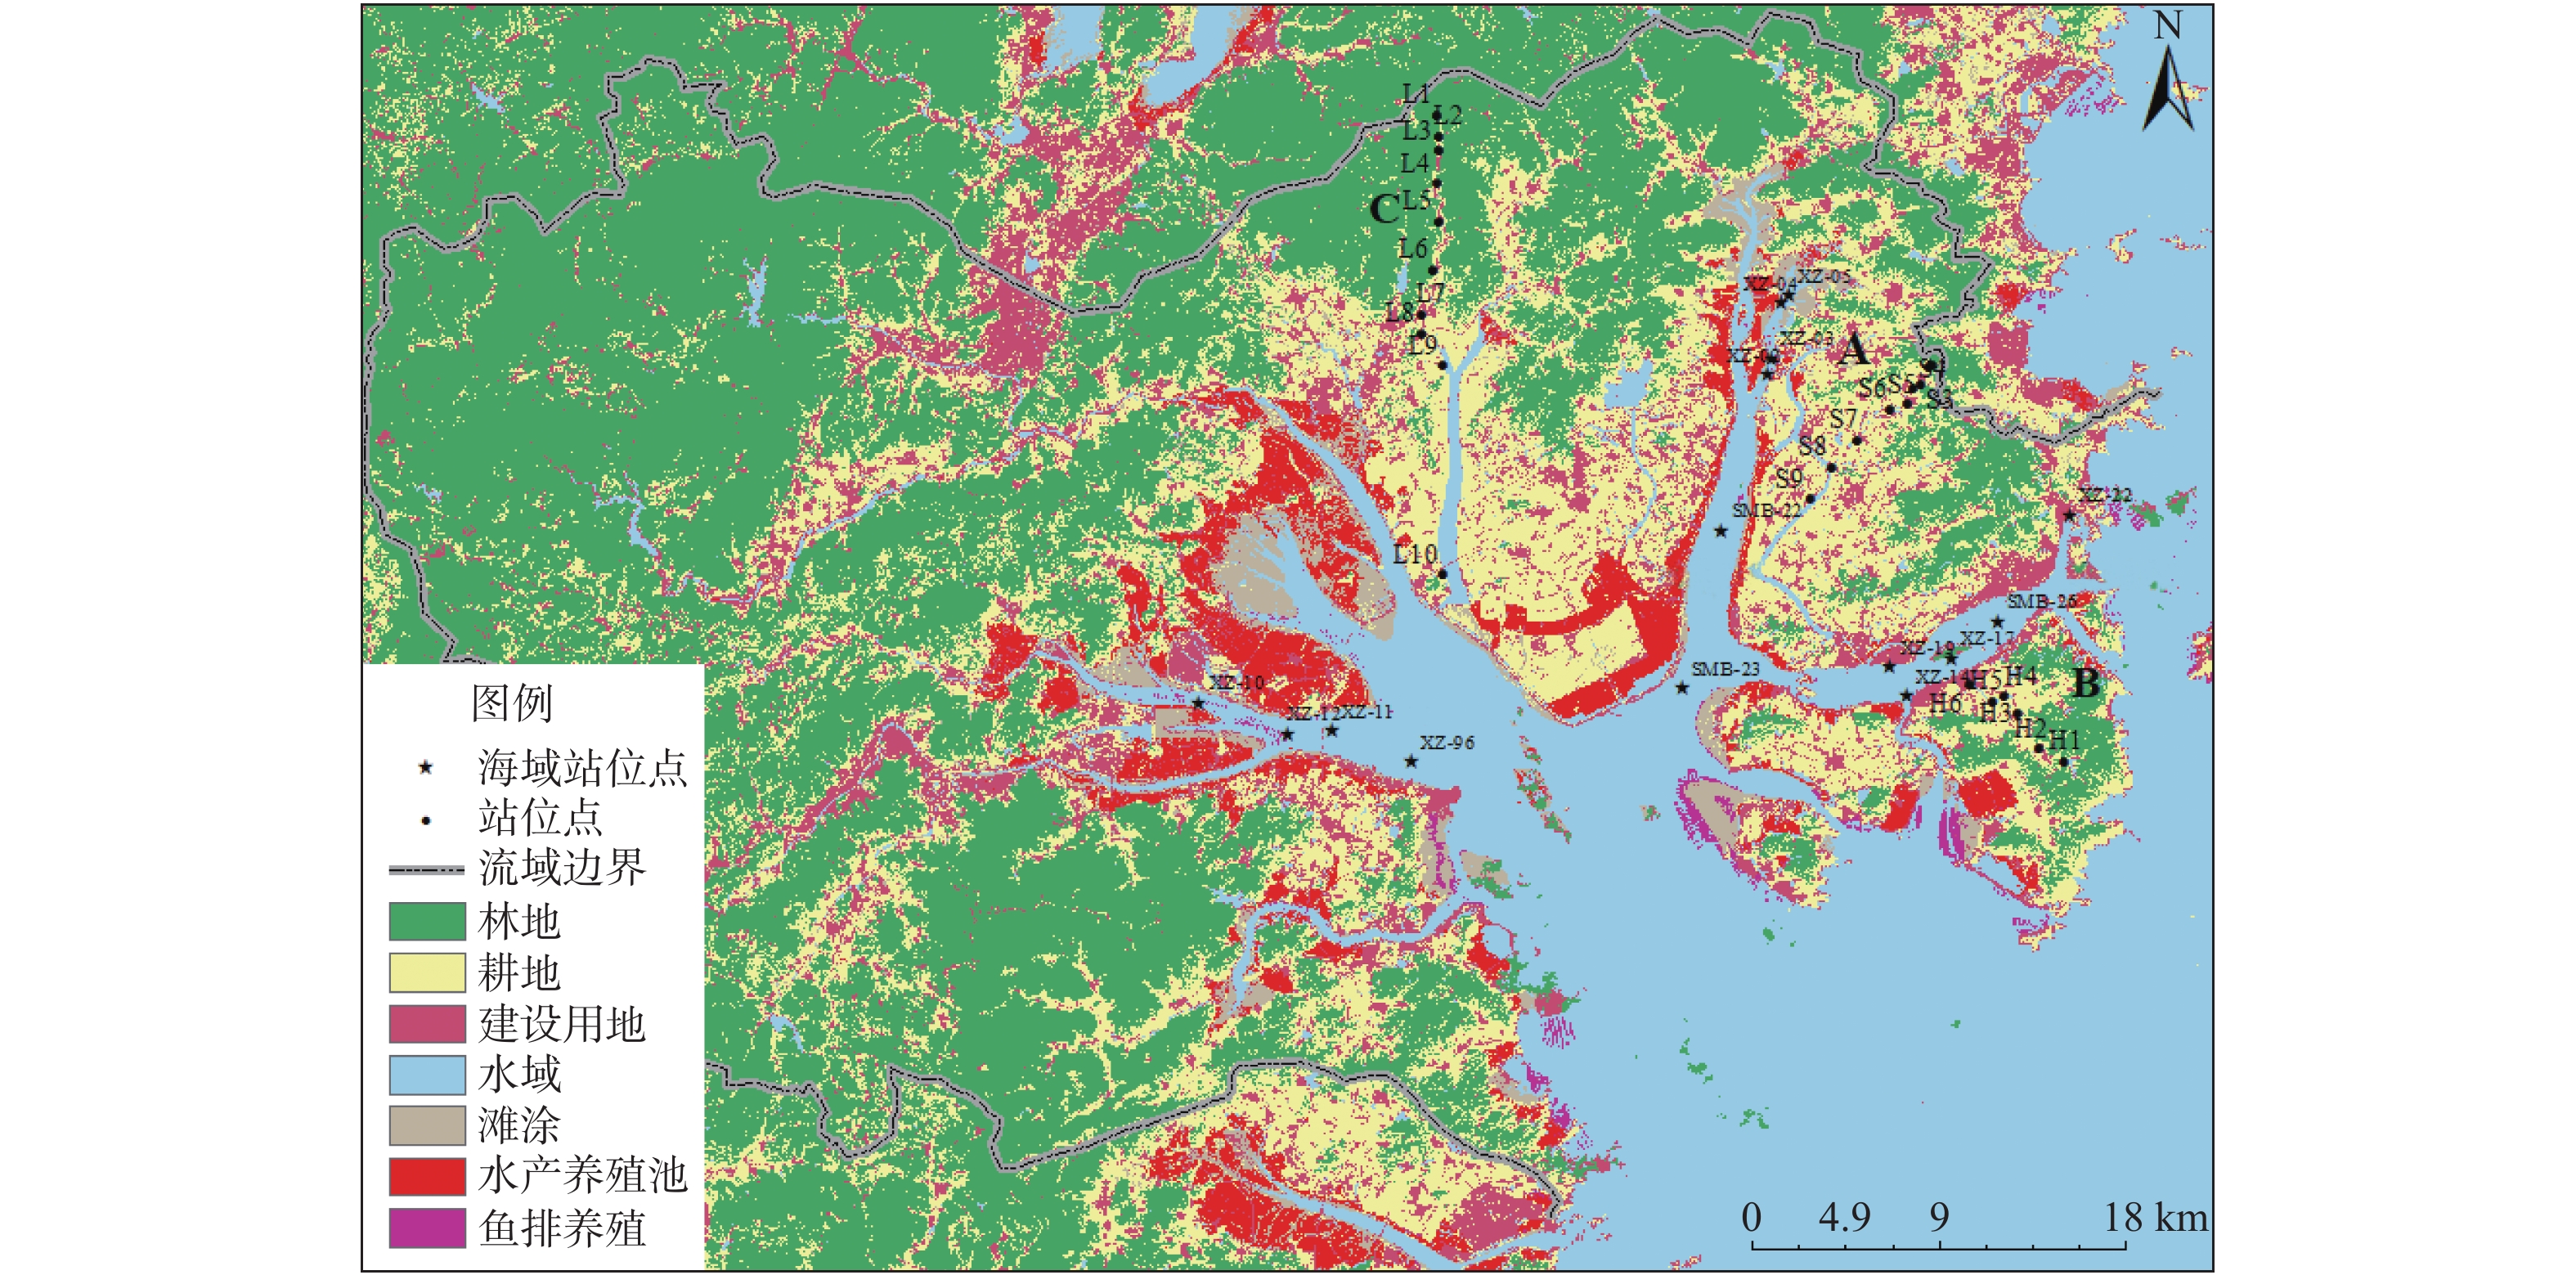
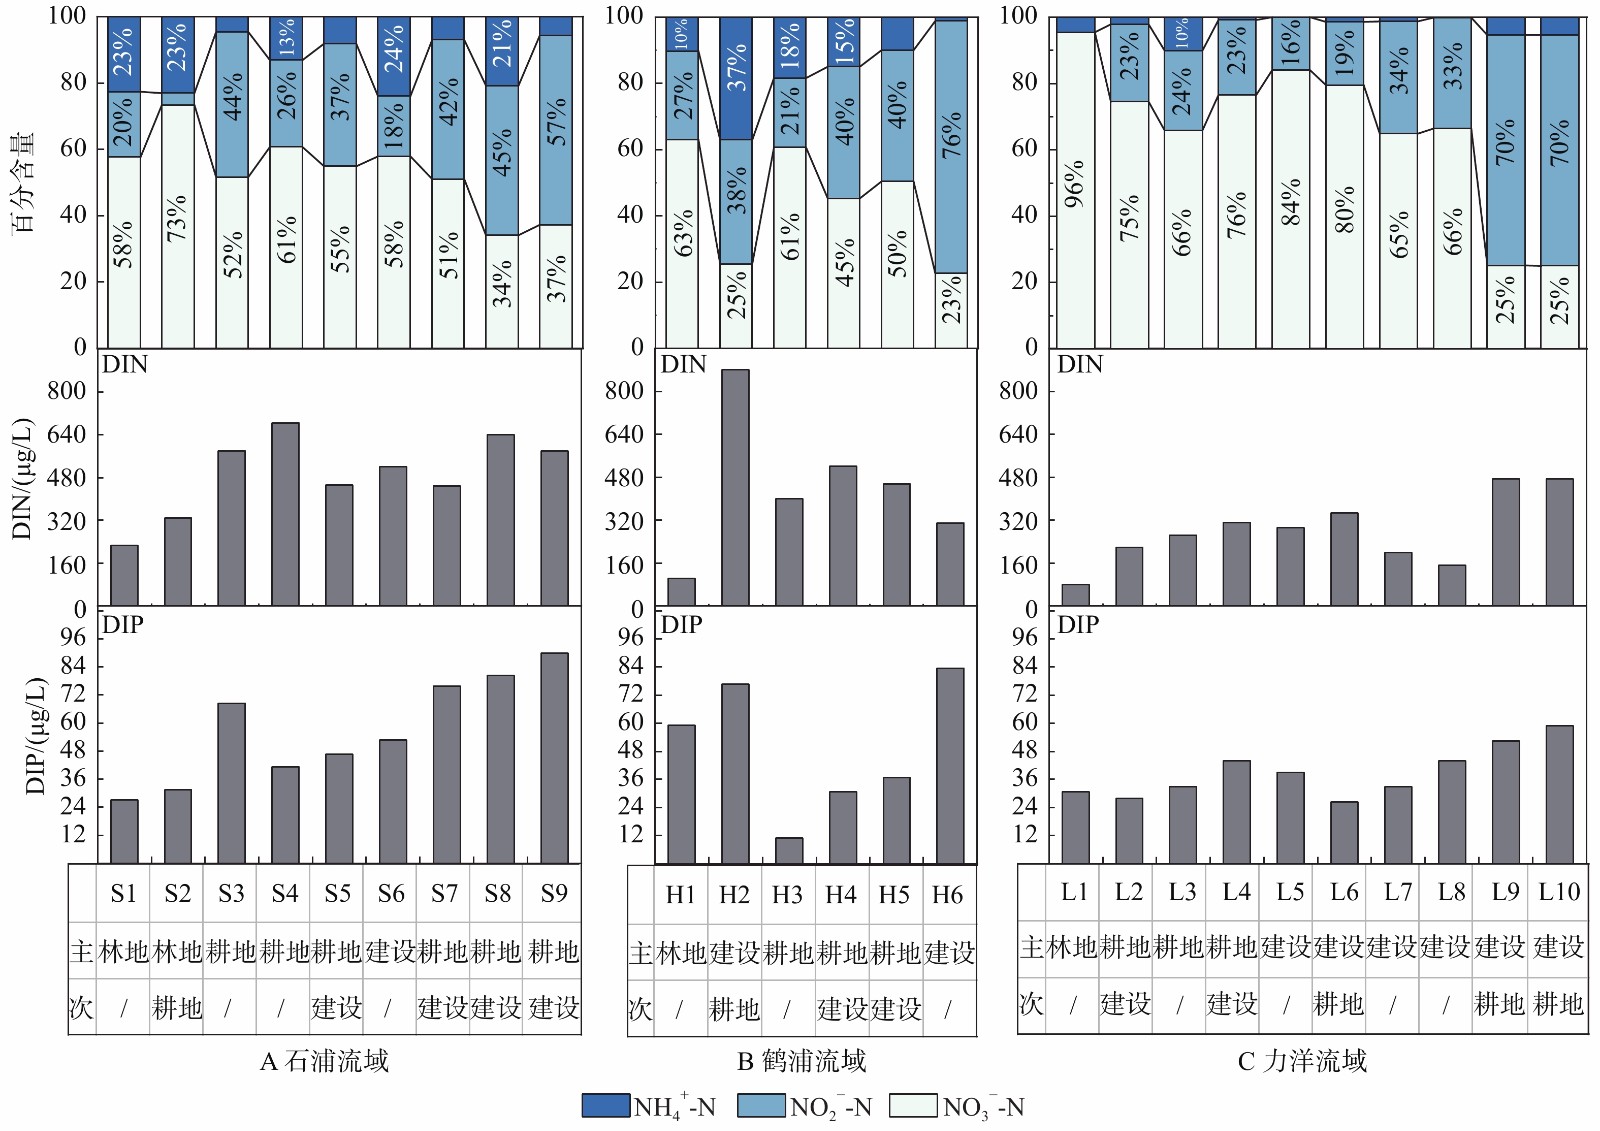
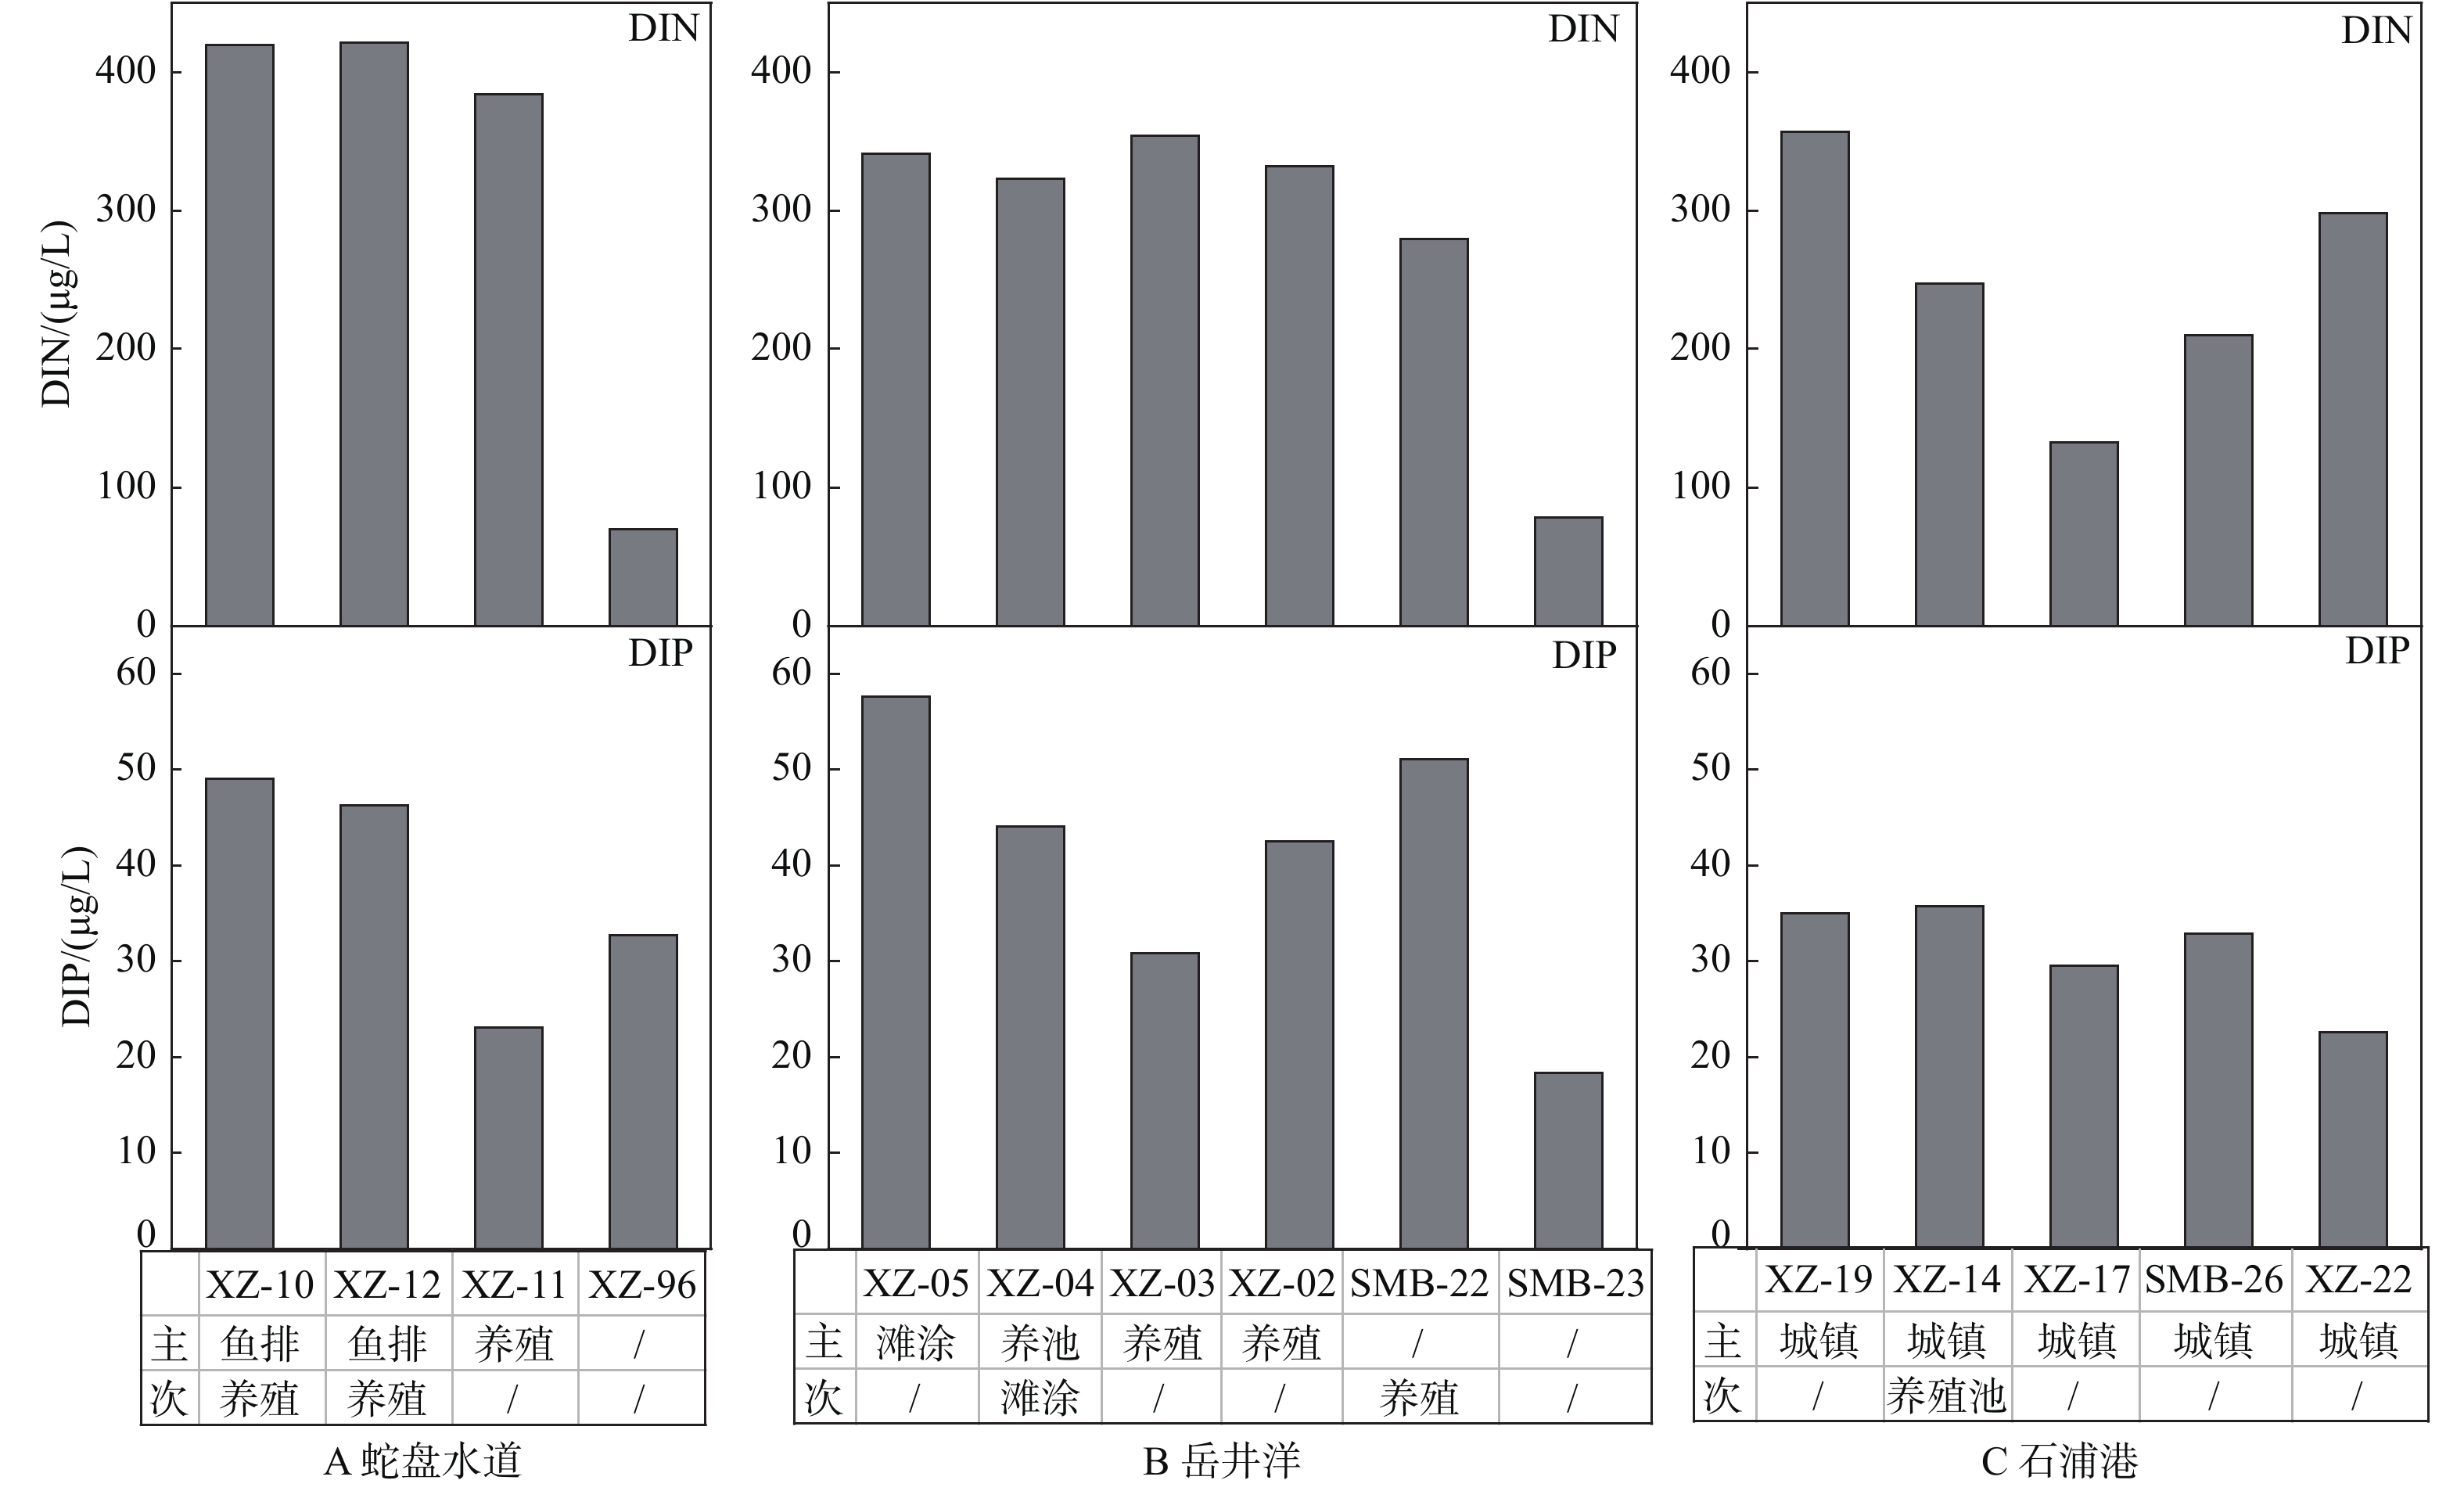
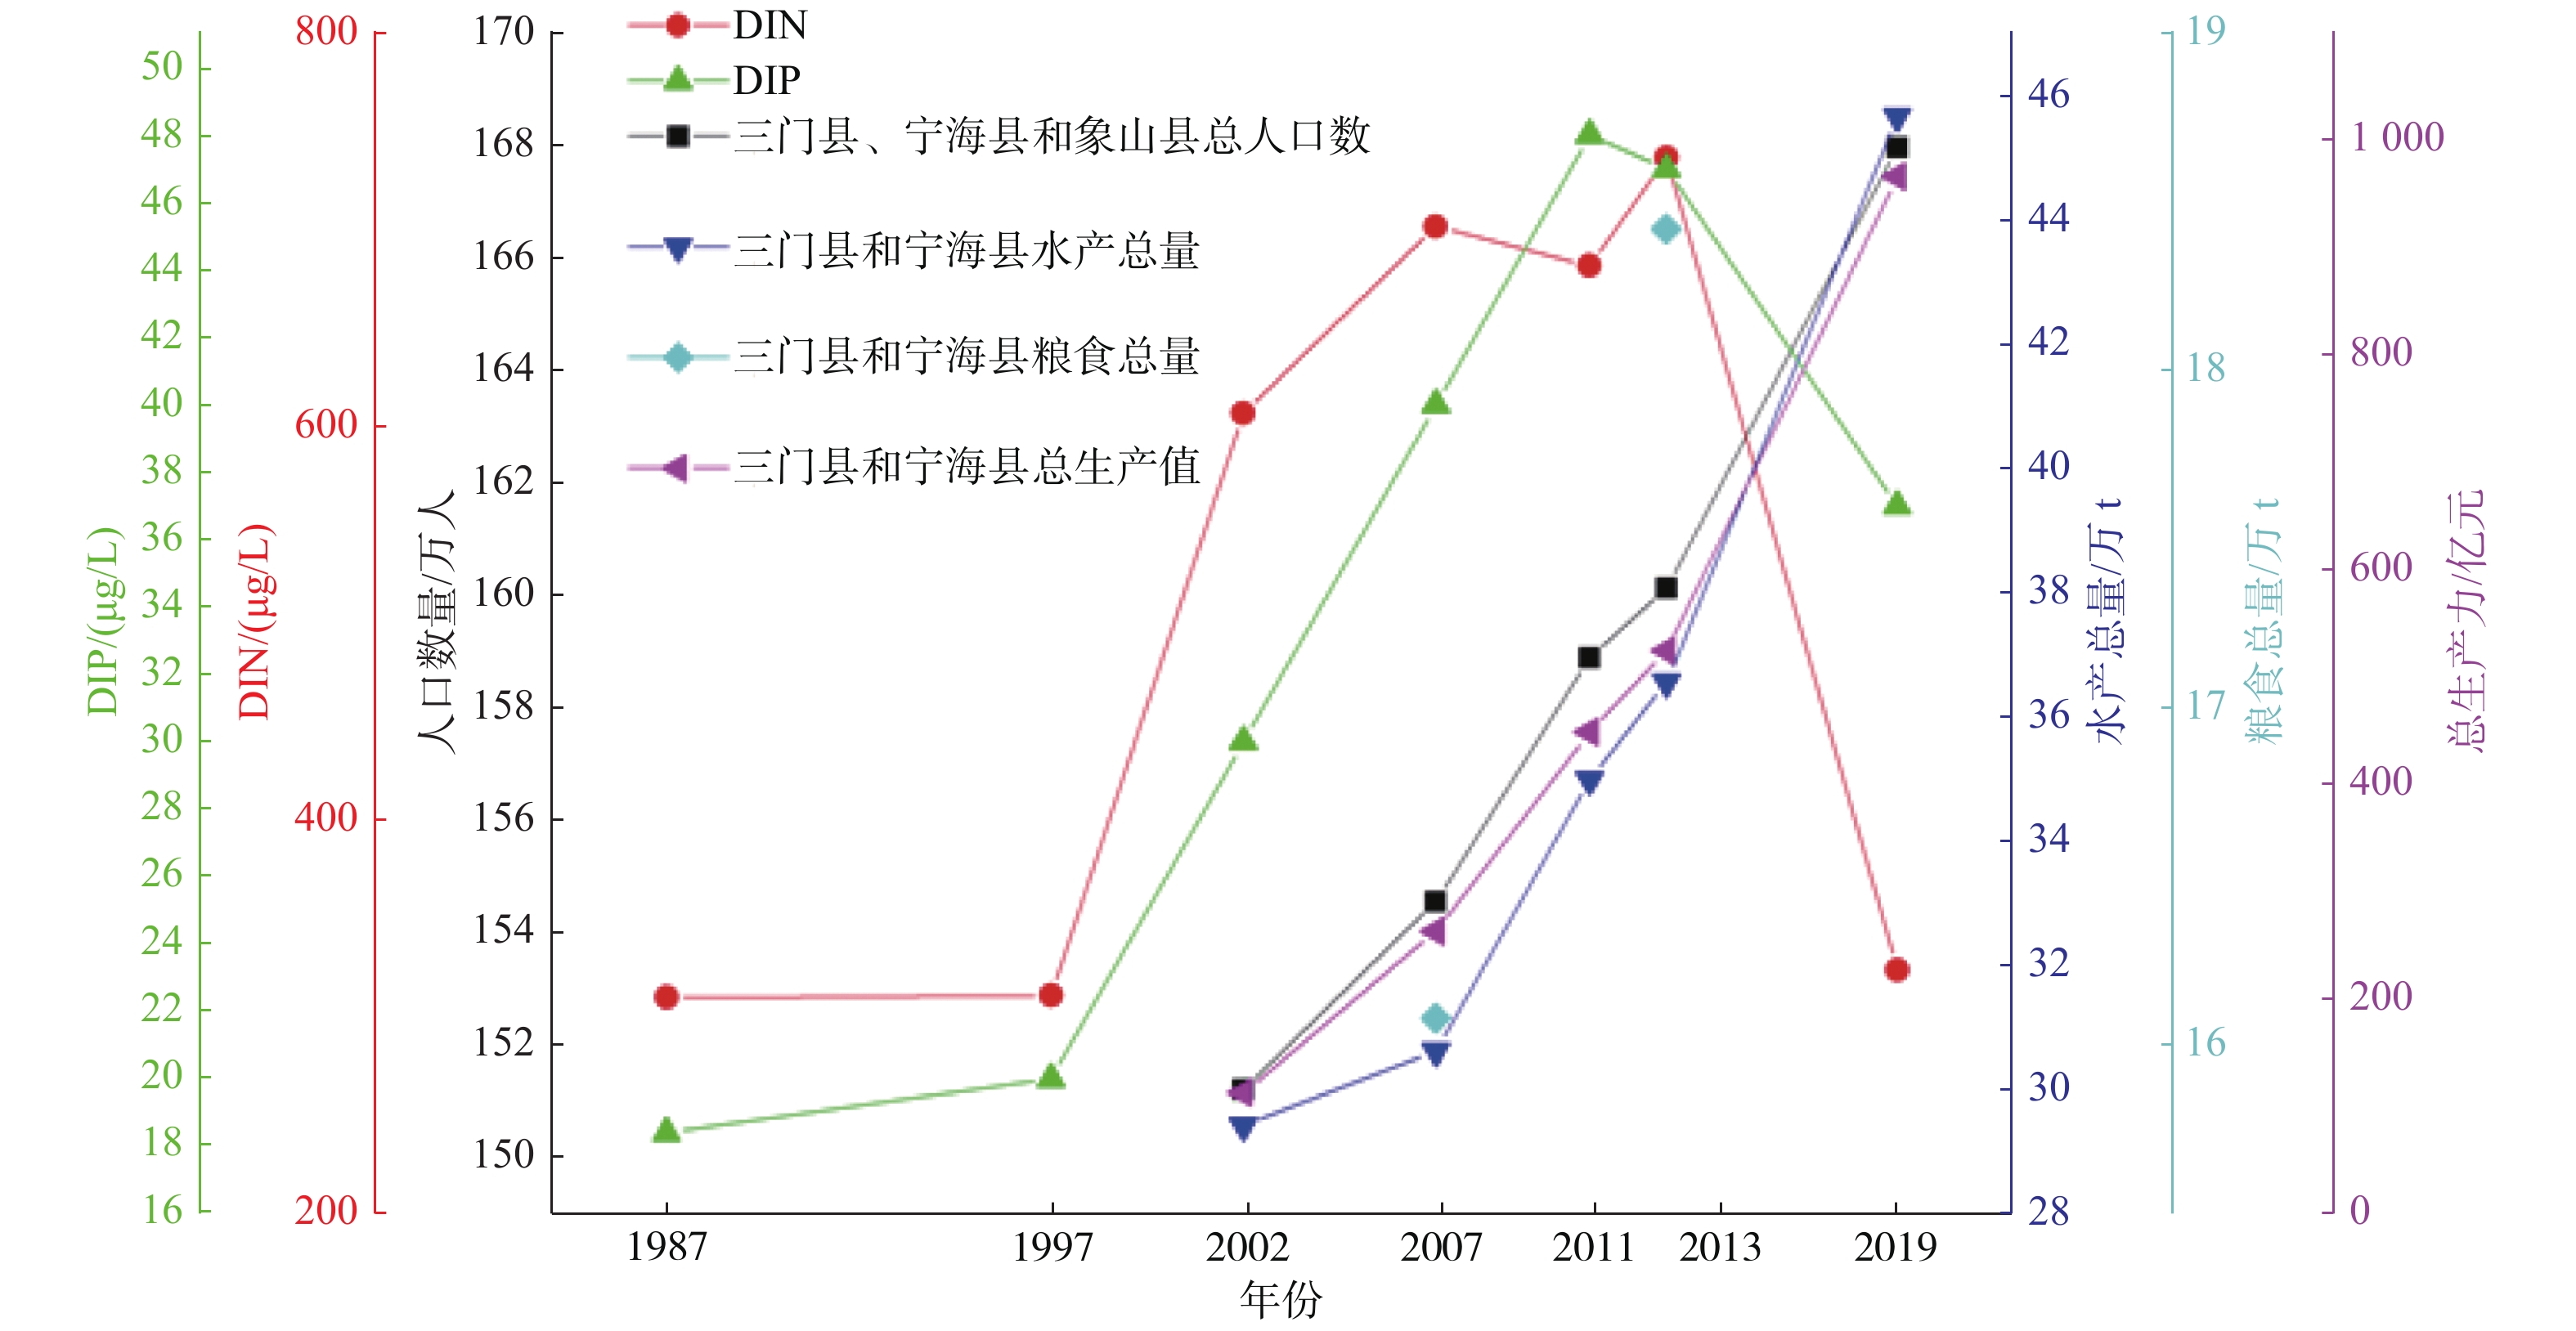
我国沿海重点海湾水体富营养化与陆源输入和海湾开发活动密切相关,海湾特殊的弱交换水动力环境使得水体环境治理面临更为严峻的挑战,浙江省近年来实施陆域生态环境治理“千万工程”和海域“蓝色海湾整治”工程,陆域和海湾水环境提升显著。以浙江省第2大海湾三门湾为研究对象,对近30年三门湾海域水体营养调查监测数据进行对比分析,结合2019年9月在三门湾开展的流域-海域水体质量联合调查取得的54个流域水样、30个海域水样和6个雨水样的营养盐分析结果(NO3−,NO2−,NH4+,PO43−),分析了三门湾水体营养盐的空间分布特征和影响因素,分析营养盐长期变化特征和人类活动的影响。目前三门湾水体富营养化的问题依然突出,湾内海域DIN和DIP含量在0~439和18~59 μg/L,平均值分别为233和37 μg/L,河流DIN和DIP含量在77~1586和3~126 μg/L,平均值分别为466和48 μg/L。河流中氮、磷营养盐含量整体上呈现由上游到下游增长的趋势,其中农业生产对水体NH4+-N、NO3−-N影响大,城镇生活和工业生产排放对水体中NH4+-N、NO2−-N和DIP影响大。海域中氮磷营养盐的高值区主要分布在水体交换弱的港汊顶部和河流入海处,营养盐浓度呈现由近岸高值向外海逐渐降低的趋势,海水养殖是近岸营养盐的主要贡献者。三门湾水体营养盐在1987—2007年中处于持续增长趋势,2010年后随着海陆生态环境治理政策的实施,DIN和DIP呈现明显下降趋势,海湾水环境状况得到较大改善。
Abstract:Some key gulfs in China are facing eutrophication related to terrigenous input and human activities. The weak hydrodynamics of the gulf brings about more serious challenges to the water management organizations. In recent years, many projects have been lunched in Zhejiang province to improve the water environment of gulfs. As the result, water qualities are significantly improved. Sanmen Bay, the second largest in the province has been a key research object of nutrition survey for almost 30 years. Based on the monitoring data in the past 30 years and the joint survey results conducted in September 2019, acquired are 54 samples from river basins, 30 samples from sea water and 6 samples from precipitation. All the samples are analyzed for nutrient contents, such as NO3− and NO2−, NH4+, PO43−. Based on the results and the spatial distribution patterns of the nutrients in the bay, the influence factors on the nutrient spatial distribution patterns are revealed, especially the long-term changes of nutrients and their response to human activities. At present, the eutrophication problem remains prominent in Sanmen Bay. The contents of DIN and DIP in the sea sample range from 0 to 439 μg/L and from 18 to 59 μg/L, with an average of 233 μg/L and 37 μg/L, respectively. The contents of DIN and DIP in the river sample range from 77 to 1 586 μg/L and from 3 to 126 μg/L, with an average of 466 μg/L and 48 μg/L, respectively. The contents of nitrogen and phosphorus increased from the upstream to the downstream. Agriculture has great influences on NH4+-N and NO3−-N, while urban living and industrial production have great influences on NH4+-N, NO2−-N and DIP. The high values of nitrogen and phosphorus in the bay were mainly distributed at the head of the bay and the entrance to the sea where water exchanges are rather weak. The nutrient concentration shows a decreasing trend from the high values nearshore to the low value offshore. The mariculture was the main contributor of nutrients to the environment nearshore. During the period of 1987-2007, Sanmen Bay suffered a continuous increase in water nutrients. After 2010, with the enforcement of marine and land ecological environmental management policies, DIN and DIP have showed an obvious decreasing trend, and the water environment of the bay is greatly improved.
-
Key words:
- Sanmen Bay /
- nutrient /
- human activity /
- land use /
- DIN /
- DIP
-

-
表 1 三门湾水体营养盐含量
Table 1. Water nutrient contents in Sanmen Bay
/(μg/L) 地理位置 NO3− NH4+ NO2− PO43− DIN DIP 范围 平均 范围 平均 范围 平均 范围 平均 范围 平均 范围 平均 河流 石浦河流域 186~1 839 1 075 8~263 79 34~950 603 19~386 197 108~794 511 6~126 64 力洋河流域 343~1 218 727 0~32 12 133~950 344 81~181 119 81~474 281 26~59 39 鹤浦河流域 52~1 607 866 3~1 201 156 52~950 627 8~256 120 77~1 586 507 3~83 39 平均状况 52~1 839 914 0~1 201 101 34~950 569 8~386 148 77~1 586 466 3~126 48 海域 岳井洋 105~191 156 0~140 32 181~950 831 56~176 129 79~439 313 18~58 42 石浦港 63~124 90 0~68 17 181~950 528 56~107 89 79~357 194 18~35 29 蛇盘水道 93~130 117 3~134 88 153~950 751 71~150 116 67~421 324 23~49 38 开放海域 30~79 61 0~6 4 82~155 110 96~141 123 43~68 51 31~46 40 平均状况 30~191 109 0~140 28 23~950 511 56~180 113 0~439 233 18~59 37 大气降雨 0~281 74 6~95 59 29~78 46 1~6 3 20~100 77 0~2 1 注:DIN=NO3−-N+NO2−-N+NH3+-N;DIP=PO43−-P;  下载: 导出CSV
表 2 1987—2019年三门湾海域秋季表层海水营养盐含量调查数据
Table 2. Nutrient content survey data from autumn surface seawater survey in Sanmen Bay from 1987 to 2019
/(μg/L) 年份 季节 NO3−-N NO2−-N NH4+-N DIN DIP 备注 1987 春季 范围 164.6~222 4.2~6.3 2.8~16.2 183~237.3 22.6~53.3 中国海湾志第五分册[12] 平均值 191.045 5.445 8.925 205.425 39.05 夏季 范围 202.4~262.8 9.2~13.9 9.9~19.9 227.4~286.6 17.4~26.7 平均值 223.8 11.333 13.9333 249.067 21 秋季 范围 279.9~311.5 1.6~2.9 8~20.9 302.6~322.4 12.3~30.4 平均值 291.367 2.1 16.367 310 18.4 冬季 范围 179.2~298.9 1.8~5.2 5~25.2 20.14~32.77 16.1~12.71 平均值 224.7 3.9 14.275 246.9 54.725 1997 秋季 范围 / / / 166~454 7~33 施晓来[13] 平均值 / / / 311 20 2002 春季 范围 323~693 1~10 2~35 345~729 17~47 宁修仁等[11] 平均值 454 4 11 468 26 夏季 范围 185~369 6~26 1~45 198~439 3~30 平均值 302 11 8 321 21 秋季 范围 529~641 3~15 4~32 552~671 23~34 平均值 588 7 12 607 30 冬季 范围 475~602 1~4 1~15 482~617 16~28 平均值 567 2 6 575 26 全年 范围 185~693 1~26 1~45 198~729 3~47 平均值 483 6 9 497 26 2007 春季 范围 545~812 1~15 5~14 551~1 102 22~25 曾江宁等[16] 平均值 619 8 12 639 23 夏季 范围 304~574 6~69 1~15 311~658 22~34 平均值 384 18 6 408 30 秋季 范围 529~883 1~13 4~31 534~927 32~45 平均值 690 3 9 702 40 冬季 范围 469~937 1~11 7~110 477~1 058 33~41 平均值 680 4 21 705 38 全年 范围 304~937 1~69 1~110 306~1 116 22~45 平均值 592 8 12 0.612 33 2011 秋季 范围 / / / 530~803 42~53 施来晓[14] 平均值 / / / 682 48 2013 春季 范围 393~710 1~25 6~34 400~769 22~34 杨士瑛[29] 平均值 548 9 11 568 32 夏季 范围 258~431 10~31 5~23 273~485 18~52 平均值 354 21 13 388 35 秋季 范围 578~853 0~5 4~11 582~869 43~51 平均值 729 1 7 737 47 冬季 范围 549~720 1~9 6~36 556~765 25~35 平均值 613 5 17 635 31 2019 秋季 范围 7~43 7~289 0~109 0~439 18~59 本文 平均值 25 155 21 233 37
下载: 导出CSV
-
[1] WANG X,DAIGGER G,DE VRIES W,et al. Impact hotspots of reduced nutrient discharge shift across the globe with population and dietary changes.[J]. Nature Communications,2019,10(1):1-12. doi: 10.1038/s41467-018-07882-8
[2] DANIEL J C,HANS W P,ROBER W H,et al. Controlling eutrophication:nitrogen and phosphorus[J]. Science,2009,323:1014-1015.
[3] WILSON H F,XENOPOULOS M A. Effects of agricultural land use on the composition of fluvial dissolved organic matter[J]. Nature Geoscience,2009,2(1):37-41.
[4] BEMAN J,ARRIGO K,MATSON P. Agricultural runoff fuels large phytoplankton blooms in vulnerable areas of the ocean[J]. Nature,2005,434(7030):211-214.
[5] ENZAI D,CÉSAR T,ADAM F A P,et al. Global patterns of terrestrial nitrogen and phosphorus limitation[J]. Nature Geoscience,2020,13(3):221-226.
[6] AMATO H K,WONG N M,PELC C,et al. Effects of concentrated poultry operations and cropland manure application on antibiotic resistant Escherichia coli and nutrient pollution in Chesapeake Bay watersheds[J]. Science of The Total Environment,2020,735(15):1-11.
[7] HUMBORG C,ITTEKKOT V,COCIASU A,et al. Effect of Danube River dam on Black Sea biogeochemistry and ecosystem structure[J]. Nature,1997,386(6623):385-388.
[8] MEIER H E M,MÜLLER-KARULIS B,ANDERSSON H C,et al. Impact of climate change on ecological quality indicators and biogeochemical fluxes in the Baltic Sea:a multi-model ensemble study[J]. Ambio,2012,41(6):558-573.
[9] SANTOS I R S,BURNETT W C,CHANTON J,et al. Nutrient biogeochemistry in a Gulf of Mexico subterranean estuary and groundwater‐derived fluxes to the coastal ocean[J]. Limnology and Oceanography,2008,53(2):705-718.
[10] 黄潘阳,陈培雄,来向华,等. 三门湾2003—2013年间围涂工程对水动力环境的影响研究[J]. 中国海洋大学学报(自然科学版),2017,47(10):91-98.
[11] 宁修仁. 乐清湾、三门湾养殖生态和养殖容量研究与评价[M]. 北京: 海洋出版社, 2005.
[12] 《中国海湾志》编纂委员会. 中国海湾志第五分册·上海市和浙江省北部海湾[M]. 北京: 海洋出版社, 1992: 234-308.
[13] 施晓来. 春秋季三门湾表层海水氮磷营养盐等要素含量的分布特征[J]. 应用海洋学学报,2013,32(4):461-467. doi: 10.3969/J.ISSN.2095-4972.2013.04.003
[14] 施晓来. 近15 a来三门湾海域氮、磷营养盐分布与富营养化状况的变化分析[J]. 海洋学研究,2013,31(4):63-67. doi: 10.3969/j.issn.1001-909X.2013.04.010
[15] 庞卫文. 三门湾表层海水氮磷营养盐含量及分布特征[J]. 农业与技术,2014,34(8):2. doi: 10.3969/j.issn.1671-962X.2014.08.008
[16] 曾江宁, 潘建明, 梁楚进. 浙江省重点港湾生态环境综合调查报告[M]. 北京: 海洋出版社, 2011.
[17] 许尔琪. 土地利用对水体营养物影响的研究进展[J]. 中国生态农业学报,2019,27(12):1880-1891.
[18] 郑明凤,陈斯典,秦华鹏,等. 降雨径流污染对深圳湾富营养化影响的模拟研究[J]. 中国给水排水,2017,33(9):133-138.
[19] 樊银鹏,胡山鹰,陈定江,等. 中国磷元素代谢模式的演化与分析[J]. 清华大学学报(自然科学版),2008,48(6):1027-1031. doi: 10.3321/j.issn:1000-0054.2008.06.029
[20] 冯绍元,郑耀泉. 农田氮素的转化与损失及其对水环境的影响[J]. 农业环境保护,1996(6):277-280.
[21] COSKUN D,BRITTO D T,SHI W,et al. Nitrogen transformations in modern agriculture and the role of biological nitrification inhibition[J]. Nature Plants,2017,3(6):812-818. doi: 10.1038/nplants.2017.74
[22] CARPENTER S R,CARACO N F,CORRELL D L,et al. Correll nonpoint pollution of surface waters with phosphorus and nitrogen[J]. Ecological Applications,1998,8(3):559-568.
[23] TAYLOR M,QIUWEN C,KIMBERLY VAN M,et al. River dam impacts on biogeochemical cycling[J]. Nature Reviews Earth & Environment,2020,1(4):103-117.
[24] FIORENZA M,BENJAMIN S H,SHAUN W,et al. Cumulative human impacts on Mediterranean and Black Sea marine ecosystems:assessing current pressures and opportunities[J]. Plosone,2017,8(12):103-109.
[25] 徐淑敏,齐占会,史荣君,等. 水产养殖对亚热带海湾氮磷营养盐时空分布的影响−以深澳湾为例[J]. 南方水产科学,2019,15(4):29-38. doi: 10.12131/20190049
[26] 舒廷飞,温琰茂,陆雍森,等. 网箱养殖N、P物质平衡研究−以广东省哑铃湾网箱养殖研究为例[J]. 环境科学学报,2004,24(6):1046-1052. doi: 10.3321/j.issn:0253-2468.2004.06.017
[27] BOUWMAN L,KLEIN K,KLAAS W V,et al. Exploring global changes in nitrogen and phosphorus cycles in agriculture induced by livestock production over the 1900–2050 period[J]. Proceedings of the National Academy of Sciences of the United States of America,2013,110(52):20882-21195.
[28] 陈晓英,张杰,马毅,等. 近40 a来三门湾海岸线时空变化遥感监测与分析[J]. 海洋科学,2015,39(2):43-49. doi: 10.11759/hykx20141011004
[29] 杨士瑛, 陈培雄. 三门湾自然环境特征与资源可持续利用[M]. 青岛: 中国海洋大学出版社, 2018.
-

图(8)
表(2)
计量
- 文章访问数: 2433
- PDF下载数: 112
- 施引文献: 0