

CHARACTERISTICS OF PAHS IN SURFACE SEDIMENTS AND ECOLOGICAL RISK ASSESSMENT: A CASE FROM THE NANDAGANG WETLANDS
-
摘要:
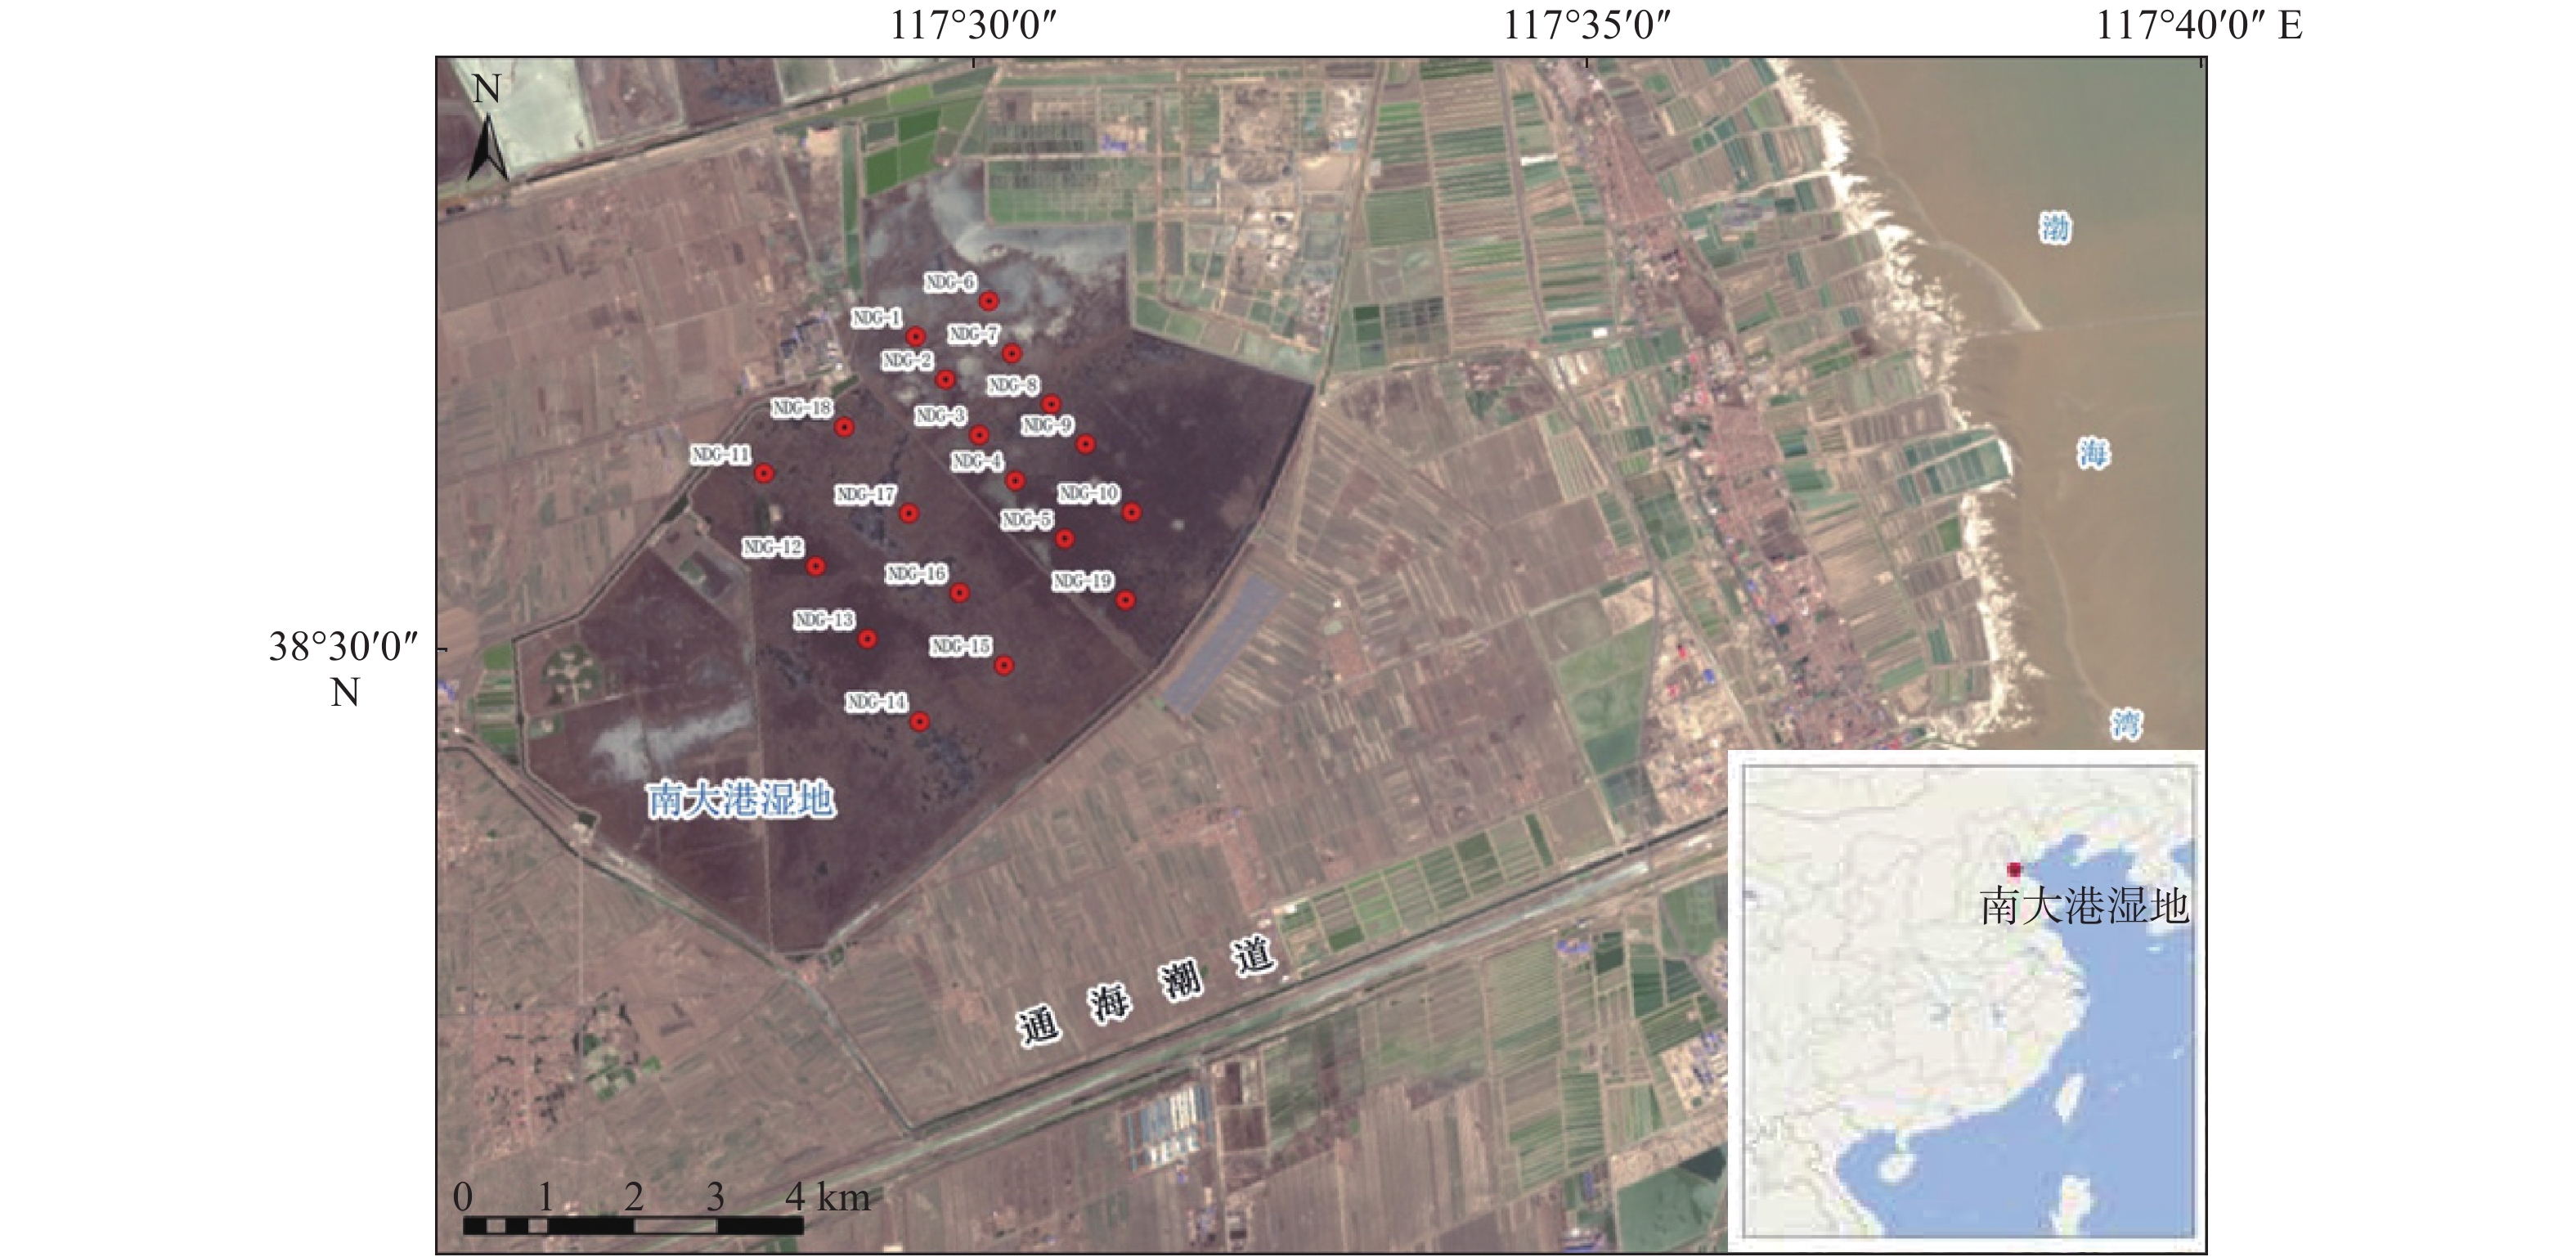
随沿海经济发展及人类开发加剧,滨海湿地受到多环芳烃等污染侵害,值得重视。对南大港湿地19个站点表层沉积物中多环芳烃(PAHs)的含量及其分布特征进行研究,并对其来源和潜在风险进行解析与评价。研究表明,该地区表层沉积物中16种PAHs总含量为7.12~156.10 ng/g(均值63.03 ng/g),与全球空间范围湿地污染程度类比,研究区湿地表层沉积物中PAHs整体污染水平并不高。综合特征比值法、相关性分析及主成分分析法推断出本湿地沉积物中PAHs主要来源为油类的燃烧以及油类泄露的联合作用源,与周边人类活动情况相符。采用效应区间低值法(ERL)和中值法(ERM)对PAHs进行生态风险评价,零星站位中菲、二氢苊浓度位于ERL与ERM之间,其余站点不存在潜在生态危害。南大港湿地中PAHs对湿地生态的毒副作用尚属于安全范围。该研究可为环渤海海岸带污染控制和治理提供基础数据支撑,也为保护良好的海湾滨海湿地生态环境提供科学信息。
Abstract:With the progress in coastal zone development, massive human activities become stronger, which leads to the pollution of marine wetlands. Taking the Nandagang wetlands as a case, the characteristics of 16 polycyclic aromatic hydrocarbons (PAHs) from 19 surface sediments are studied and risk assessment carried out in this research. The results show that the total concentration of 16 PAHs in surface sediments of the Nandagang wetlands ranges from 7.12 to 156.10 ng/g with a mean around 63.03 ng/g, which remains on a relatively low level in comparison with other places in the world in terms of PAHs pollution. The PAHs of the study area are mainly coming from a mixed source of petroleum leakage and oil combustion, based on the data acquired by means of selected PAHs ratios, the two-tailed Pearson correlation and principal components analysis at different sites. The ecological risk assessment revealed by the effects range-low (ERL) and the effects range-median (ERM) suggests that negative effects of the PAHs are limited in the surface sediments from the Nandagang wetlands, except for acenaphthene and fluorene in a few sites which bears potential risk to the environment. The present work may provide some basic data and scientific information for environment protection and management along the Bohai coast.
-
Key words:
- marine wetlands /
- PAHs /
- surface sediments /
- ecological risk assessment /
- Nandagang
-

-
表 1 荧光检测器工作条件
Table 1. Details of fluorescence detector
t/min λ/nm 发射波长 激发波长 0 340 260 13.5 420 260 29.5 482 250  下载: 导出CSV
表 2 世界各湿地表层沉积物中多环芳烃检出量
Table 2. Concentration of PAHs in surface sediments from global wetlands
名称 含量/(ng/g dw) 数据来源 南大港湿地 7.12~156.10 本研究 白洋淀湿地 324.6~1 738 文献[7] 崇明湿地 38.7~136.2 文献[8] 胶州湾湿地 176.1~563.3 文献[10] 红树林湿地 3.16~464.05 文献[11] 辽河湿地 293.4~1 937 文献[13] 青肯泡湿地 36.4~68 799 文献[14] 秦皇岛湿地 161.7~386.3 文献[15] 渤海湾湿地 341.61~4 703 文献[16] Chao Phraya Estuary wetland, Thailand 6~8 399 文献[17] Anzali wetland, Iran 212~2 674 文献[18] Canada River wetland, USA 16~12 000 文献[19] Shadegen wetland, Iran 593~53 394 文献[20]
下载: 导出CSV
表 3 南大港湿地表层沉积物中PAHs各化合物间的相关性分析
Table 3. The relationships of differient PAHs in surface sediments of the Nandagang wetlands
萘 萘 二氢苊 芴 菲 蒽 荧蒽 芘 苯并(a)蒽 屈 苯并(b)荧蒽 苯并(k)荧蒽 苯并(a)芘 二苯并(a,h)蒽 苯并(g,h,i)苝 茚并(1,2,3-cd)芘 二氢苊 0.062 芴 0.481
(*)0.629
(**)菲 −0.001 −0.026 0.478
(*)蒽 −0.092 0.108 0.421 0.845
(**)荧蒽 0.254 0.374 0.587
(**)0.254 0.159 芘 0.037 0.395 0.512
(*)0.256 0.449 0.456 苯并(a)蒽 0.296 0.261 0.342 0.032 −0.054 0.736
(**)−0.035 屈 0.006 0.085 0.123 −0.018 0.145 0.21 0.509
(*)0.229 苯并(b)荧蒽 −0.22 0.374 0.213 0.104 0.361 0.292 .579
(**)0.123 0.480
(*)苯并(k)荧蒽 0.003 0.419 0.553
(*)0.437 0.478
(*)0.648
(**)0.491
(*)0.603
(**)0.600
(**)0.482
(*)苯并(a)芘 −0.24 −0.244 −0.022 0.474
(*)0.494
(*)−0.152 0.1 −0.191 0.322 0.235 0.304 二苯并(a,h)蒽 −0.021 0.103 0.421 0.644
(**)0.604
(**)0.426 0.265 0.169 0.101 0.212 0.551
(*)0.399 苯并(g,h,i)苝 −0.212 −0.182 −0.365 −0.236 −0.151 −0.334 0.003 −0.208 0.574
(*)0.075 0.163 0.277 0.127 茚并(1,2,3-cd)芘 −0.218 0.194 0.478
(*)0.857
(**)0.909
(**)0.318 0.43 0.005 0.096 0.387 0.551
(*)0.492
(*)0.782
(**)−0.145 总和 0.208 0.589
(**)0.83
7(**)0.628
(**)0.654
(**)0.712
(**)0.690
(**)0.416 0.377 0.505
(*)0.817
(**)0.222 0.624
(**)−0.173 0.721
(**)注:** 表示在0.01水平上显著相关,*表示在0.05水平上显著相关
下载: 导出CSV
表 4 南大港湿地表层沉积物中PAHs含量与生态风险限值
Table 4. Concentration ranges and toxicity guidelines for PAHs in surface sediments of the Nandagang wetlands
多环芳烃种类 含量/(ng/g) 平均含量/(ng/g) 生态风险标志水平 ERL ERM 萘 ND-21.97 5.86 160 2 100 二氢苊 ND-50.45 7.17 16 500 芴 ND-6.12 2.48 44 640 菲 ND-64.55 11.88 19 540 蒽 ND-2.82 0.70 240 1 500 荧蒽 ND-30.28 8.29 85.3 1 100 芘 ND-33.66 6.56 600 5 100 苯并(a)蒽 0.21~17.76 2.64 665 2 600 屈 ND-13.95 4.93 261 1 600 苯并(b)荧蒽 ND-8.47 3.41 384 2 800 苯并(k)荧蒽 ND-3.48 1.37 - - 苯并(a)芘 ND-9.96 2.15 - - 二苯并(a,h)蒽 ND-10.63 3.42 430 1 600 苯并(g,h,i)苝 ND-3.83 0.68 63.4 260 茚并(1,2,3-cd)芘 ND-7.69 1.49 - - 总量 7.12~156.10 63.03 4 022 44 792
下载: 导出CSV
-
[1] GU Y G,LI H B,LU H B. Polycyclic aromatic hydrocarbons (PAHs) in surface sediments from the largest deep plateau lake in China:Occurrence,sources and biological risk[J]. Ecological Engineering,2017,101:179-184. doi: 10.1016/j.ecoleng.2017.02.007
[2] 叶磊. 陕西省不同功能区表土中多环芳烃的分布特征及来源解析[D]. 西安: 西安建筑科技大学, 2013.
[3] 凌镇浩. 珠三角大气持久性有机污染物(POPs)的浓度及迁移规律研究[D]. 广州: 中山大学. 2009.
[4] 赵彩平,丁毅,叶云等. 淮河中下游干流贝类体中多环芳烃的分布及风险评价[J]. 安徽农业科学,2010,38(3):1263-1265. doi: 10.3969/j.issn.0517-6611.2010.03.075
[5] 刘强. 辽东半岛东岸泥质区多环芳烃的分布、来源及其对环境变化响应[D]. 南京: 南京大学, 2019.
[6] 薛荔栋,郎印海,刘爱霞,等. 黄海近岸表层沉积物中多环芳烃来源解析[J]. 生态环境学报,2008,17(4):1369-1375. doi: 10.3969/j.issn.1674-5906.2008.04.009
[7] 胡国成,郭建阳,罗孝俊,等. 白洋淀表层沉积物中多环芳烃的含量、分布、来源及生态风险评价[J]. 环境科学研究,2009,22(3):336-347.
[8] WANG Z,LIU Z,YANG Y,et al. Distribution of PAHs in tissues of wetland plants and the surrounding sediments in the Chongming wetland,Shanghai,China[J]. Chemosphere,2012,89(3):221-227. doi: 10.1016/j.chemosphere.2012.04.019
[9] 袁红明,叶思源,高茂生,等. 黄河三角洲南部湿地表层土壤中多环芳烃的分布特征及生态风险评价[J]. 海洋地质前沿,2011,19(2):336-347.
[10] LANG Y,LI G,WANG X,et al. Combination of Unmix and PMF receptor model to apportion the potential sources and contributions of PAHs in wetland soils from Jiaozhou Bay,China[J]. Marine Pollution Bulletin,2015,90(1/2):129-134.
[11] ZHANG D L,LIU N,YIN P,et al. Characterization,sources and ecological risk assessment of polycyclic aromatic hydrocarbons in surface sediments from the mangroves of China[J]. Wetlands Ecology and Management,2017,25(1):105-117. doi: 10.1007/s11273-016-9505-z
[12] 王建华,王艳霞,张义文,等. 南大港湿地及其保护研究[J]. 河北师范大学学报(自然科学版),2003,27(3):309-312.
[13] 廖书林,郎印海,王延松. 辽河口湿地土壤多环芳烃的分布及来源研究[J]. 环境科学,2011,32(4):1094-1100.
[14] ZHANG Y,LIU M,CHEN H,et al. Source identification of polycyclic aromatic hydrocarbons in different ecological wetland components of the Qinkenpao Wetland in Northeast China[J]. Ecotoxicology & Environmental Safety,2014,102(4):160-167.
[15] LIN F,HAN B,DING Y,et al. Distribution characteristics,sources,and ecological risk assessment of polycyclic aromatic hydrocarbons in sediments from the Qinhuangdao coastal wetland,China[J]. Marine Pollution Bulletin,2018,127:788-793. doi: 10.1016/j.marpolbul.2017.09.054
[16] XU Y,LIU T,ZHU X,et al. Quantitative analysis of genetic associations in the biodegradative pathway of PAHs in wetland sediments of the Bohai coast region[J]. Chemosphere,2019,218:282-291.
[17] BOONYATUMANOND R,WATTAYAKORN G,TOGO A,et al. Distribution and origins of polycyclic aromatic hydrocarbons (PAHs) in riverine,estuarine,and marine sediments in Thailand[J]. Marine Pollution Bulletin,2006,52(8):942-956. doi: 10.1016/j.marpolbul.2005.12.015
[18] YANCHESHMEH R A,BAKHTIARI A R,MORTAZAVI S,et al. Sediment PAH:contrasting levels in the Caspian Sea and Anzali Wetland[J]. Marine Pollution Bulletin,2014,84(1/2):391-400.
[19] SARTORI F,WADE T L,SERICANO J L,et al. Polycyclic aromatic hydrocarbons in soil of the Canadian river floodplain in Oklahoma[J]. Journal of Environmental Quality,2010,39(2):568-579. doi: 10.2134/jeq2009.0270
[20] BEMANIKHARANAGH A,BAKHTIARI A R,MOHAMMADI J,et al. Characterization and ecological risk of polycyclic aromatic hydrocarbons (PAHs) and n-alkanes in sediments of Shadegan international wetland,the Persian Gulf[J]. Marine Pollution Bulletin,2017,124(1):155-170. doi: 10.1016/j.marpolbul.2017.07.015
[21] 国文,薛文,姚文君,等. 渤海表层沉积物中多环芳烃赋存特征及来源分析[J]. 海洋环境科学,2015,34(3):330-336.
[22] HUI Y M,ZHENG M H,LIU Z T,et al. Distribution of polycyclic aromatic hydrocarbons in sediments from Yellow River Estuary and Yangtze River Estuary,China[J]. Journal of Environment Science,2009,21:1625-1631. doi: 10.1016/S1001-0742(08)62465-1
[23] YUNKER M B,MACDONALD R W,VINGARZAN R,et al. PAHs in the Fraser River basin:a critical appraisal of PAH ratios as indicators of PAH source and composition[J]. Organic Geochemistry,2002,33(4):489-515. doi: 10.1016/S0146-6380(02)00002-5
[24] KAVOURAS I G,KOUTRAKIS P,TSAPAKIS M,et al. Source apportionment of urban particulate aliphatic and polynuclear aromatic hydrocarbons (PAHs) using multivariate methods[J]. Environmental Science & Technology,2001,35(11):2288-2294.
[25] KHALILI N R,SCHEFF P A,HOLSEN T M. PAH source fingerprints for coke ovens,diesel and,gasoline engines,highway tunnels,and wood combustion emissions[J]. Atmospheric Environment,1995,29(4):533-542. doi: 10.1016/1352-2310(94)00275-P
[26] GOCHT T,BARTH J A C,EPP M,et al. Indications for pedogenic formation of perylene in a terrestrial soil profile:depth distribution and first results from stable carbon isotope ratios[J]. Applied Geochemistry,2007,22(12):2652-2663. doi: 10.1016/j.apgeochem.2007.06.004
[27] 马子惠,梁成华,孟庆欢,等. 基于PSR模型的大港油田土地生态安全评价研究[J]. 环境污染与防治,2015,37(1):41-51.
-


图(3)
表(4)
计量
- 文章访问数: 1734
- PDF下载数: 98
- 施引文献: 0