

Evaluation of eutrophication and impact of river runoff along the coastal zone of Yancheng City, Jiangsu Province
-
摘要:
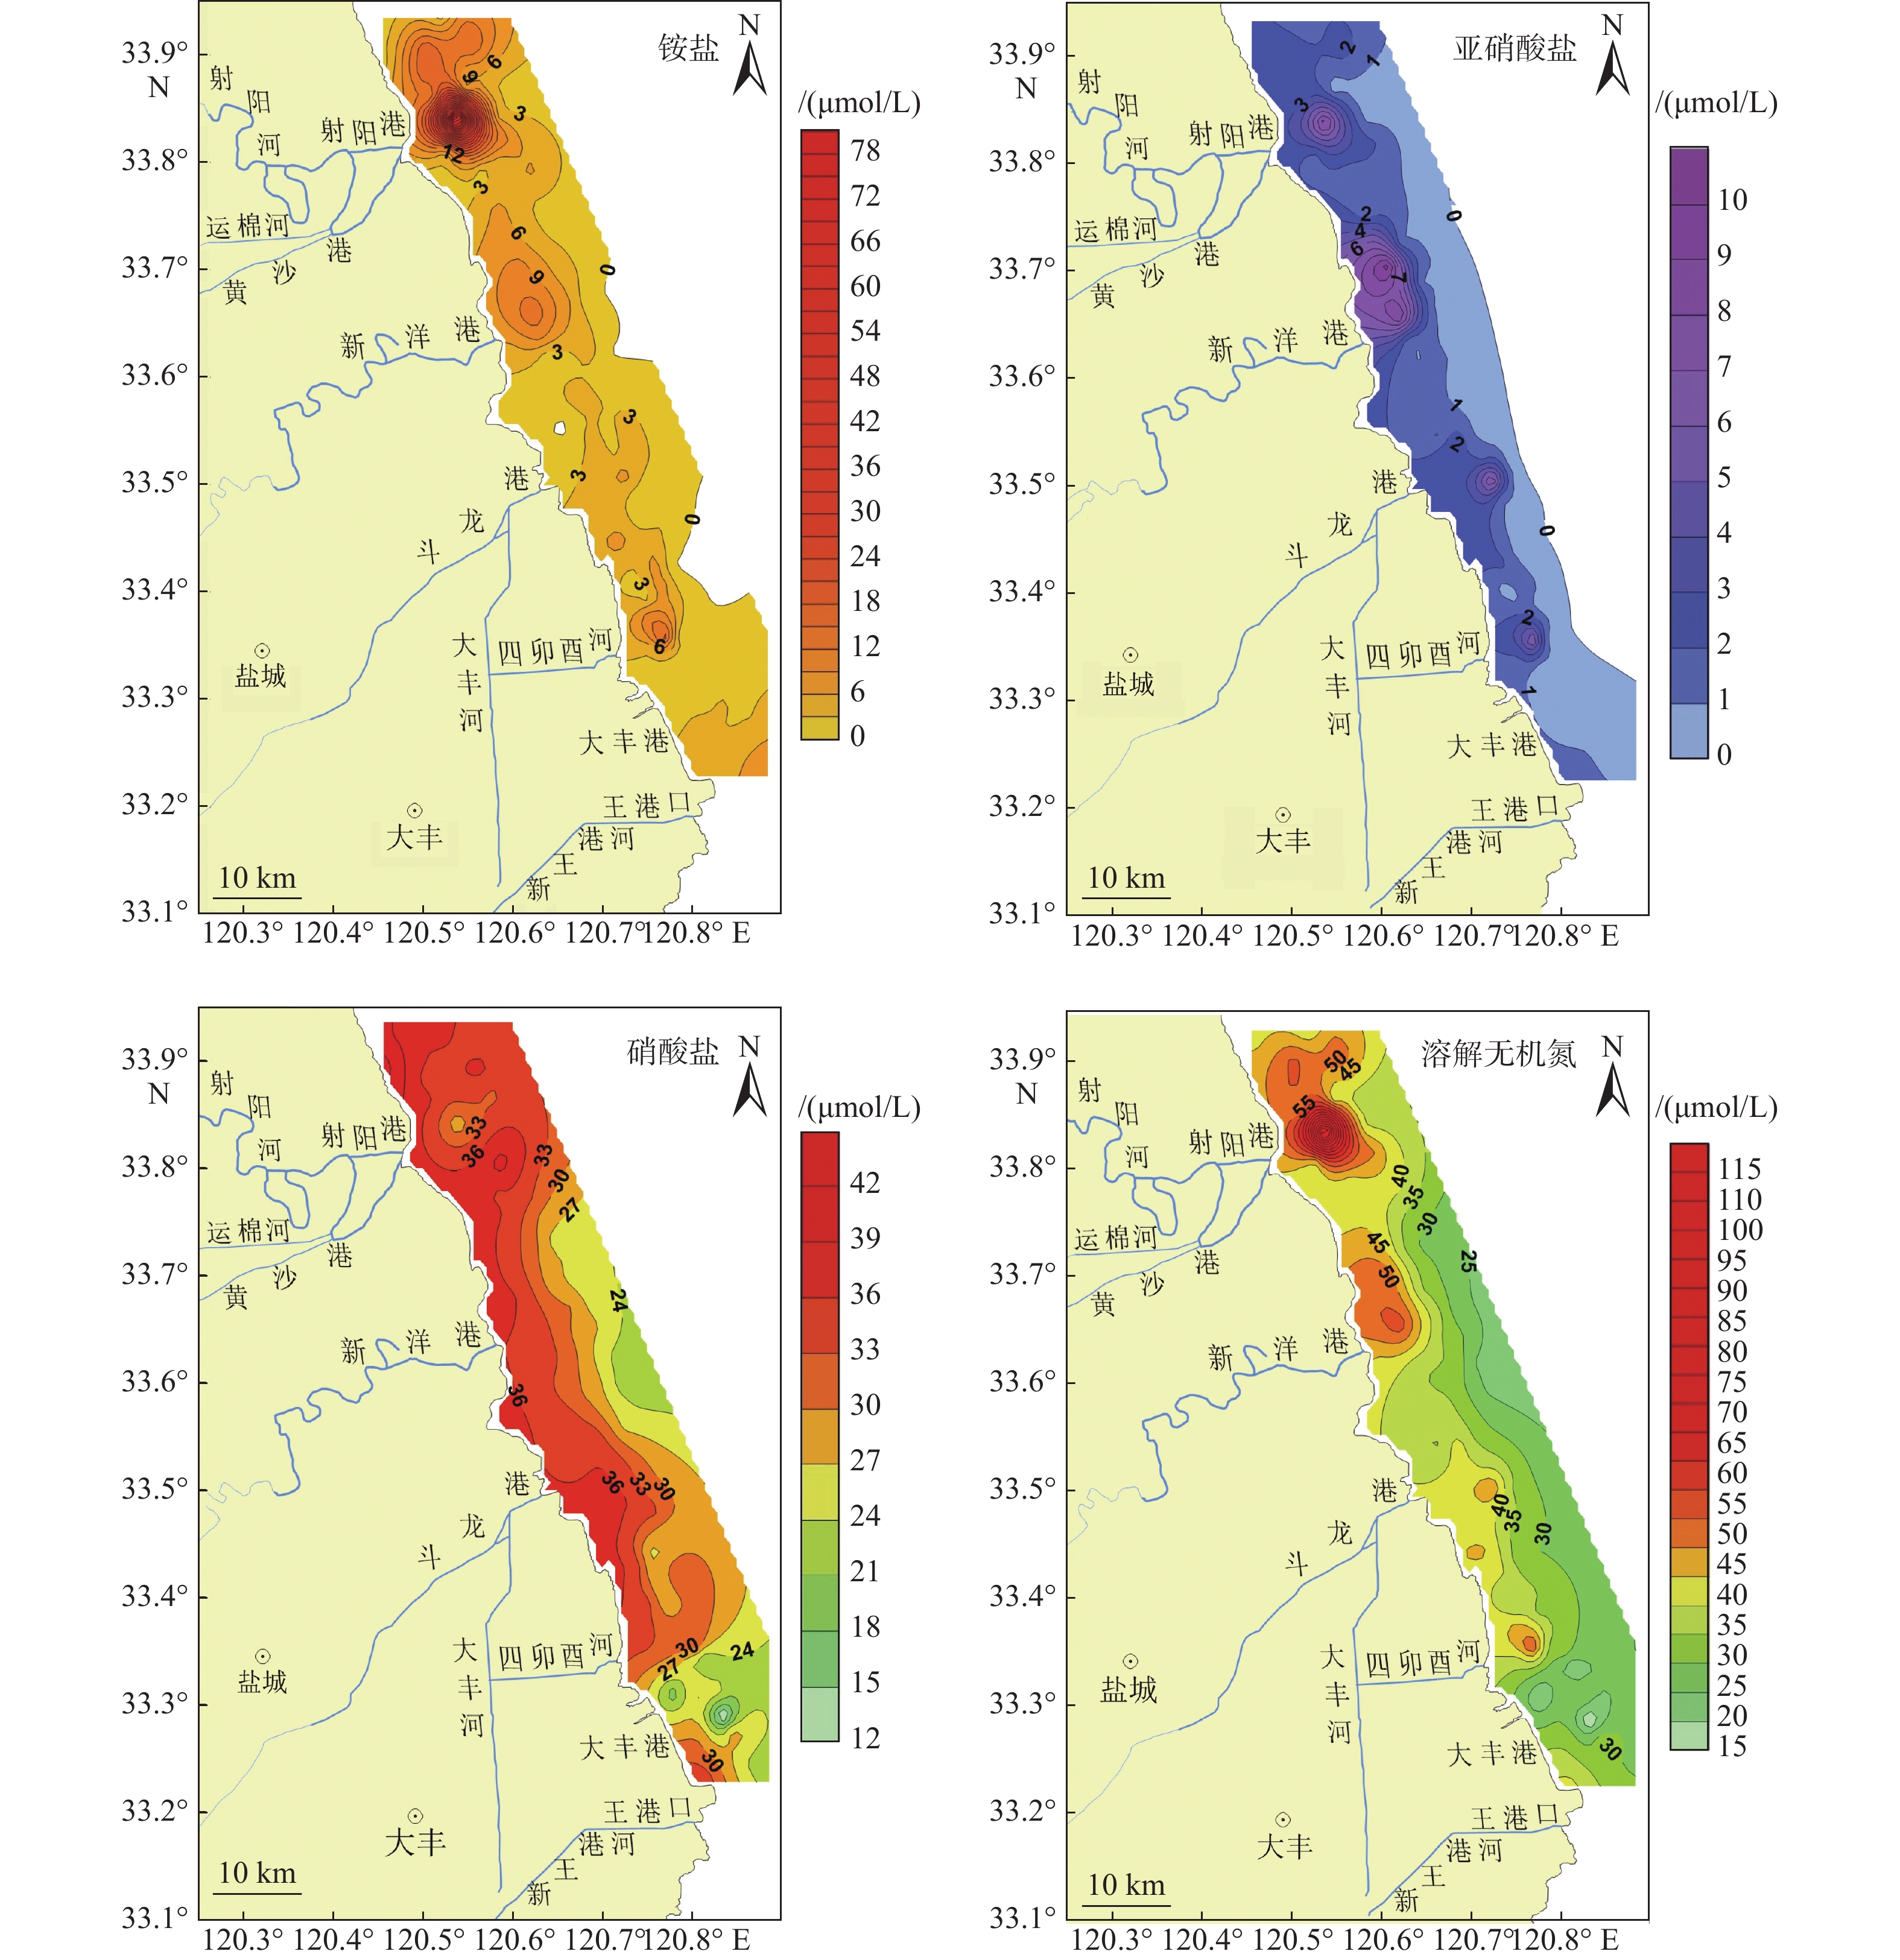
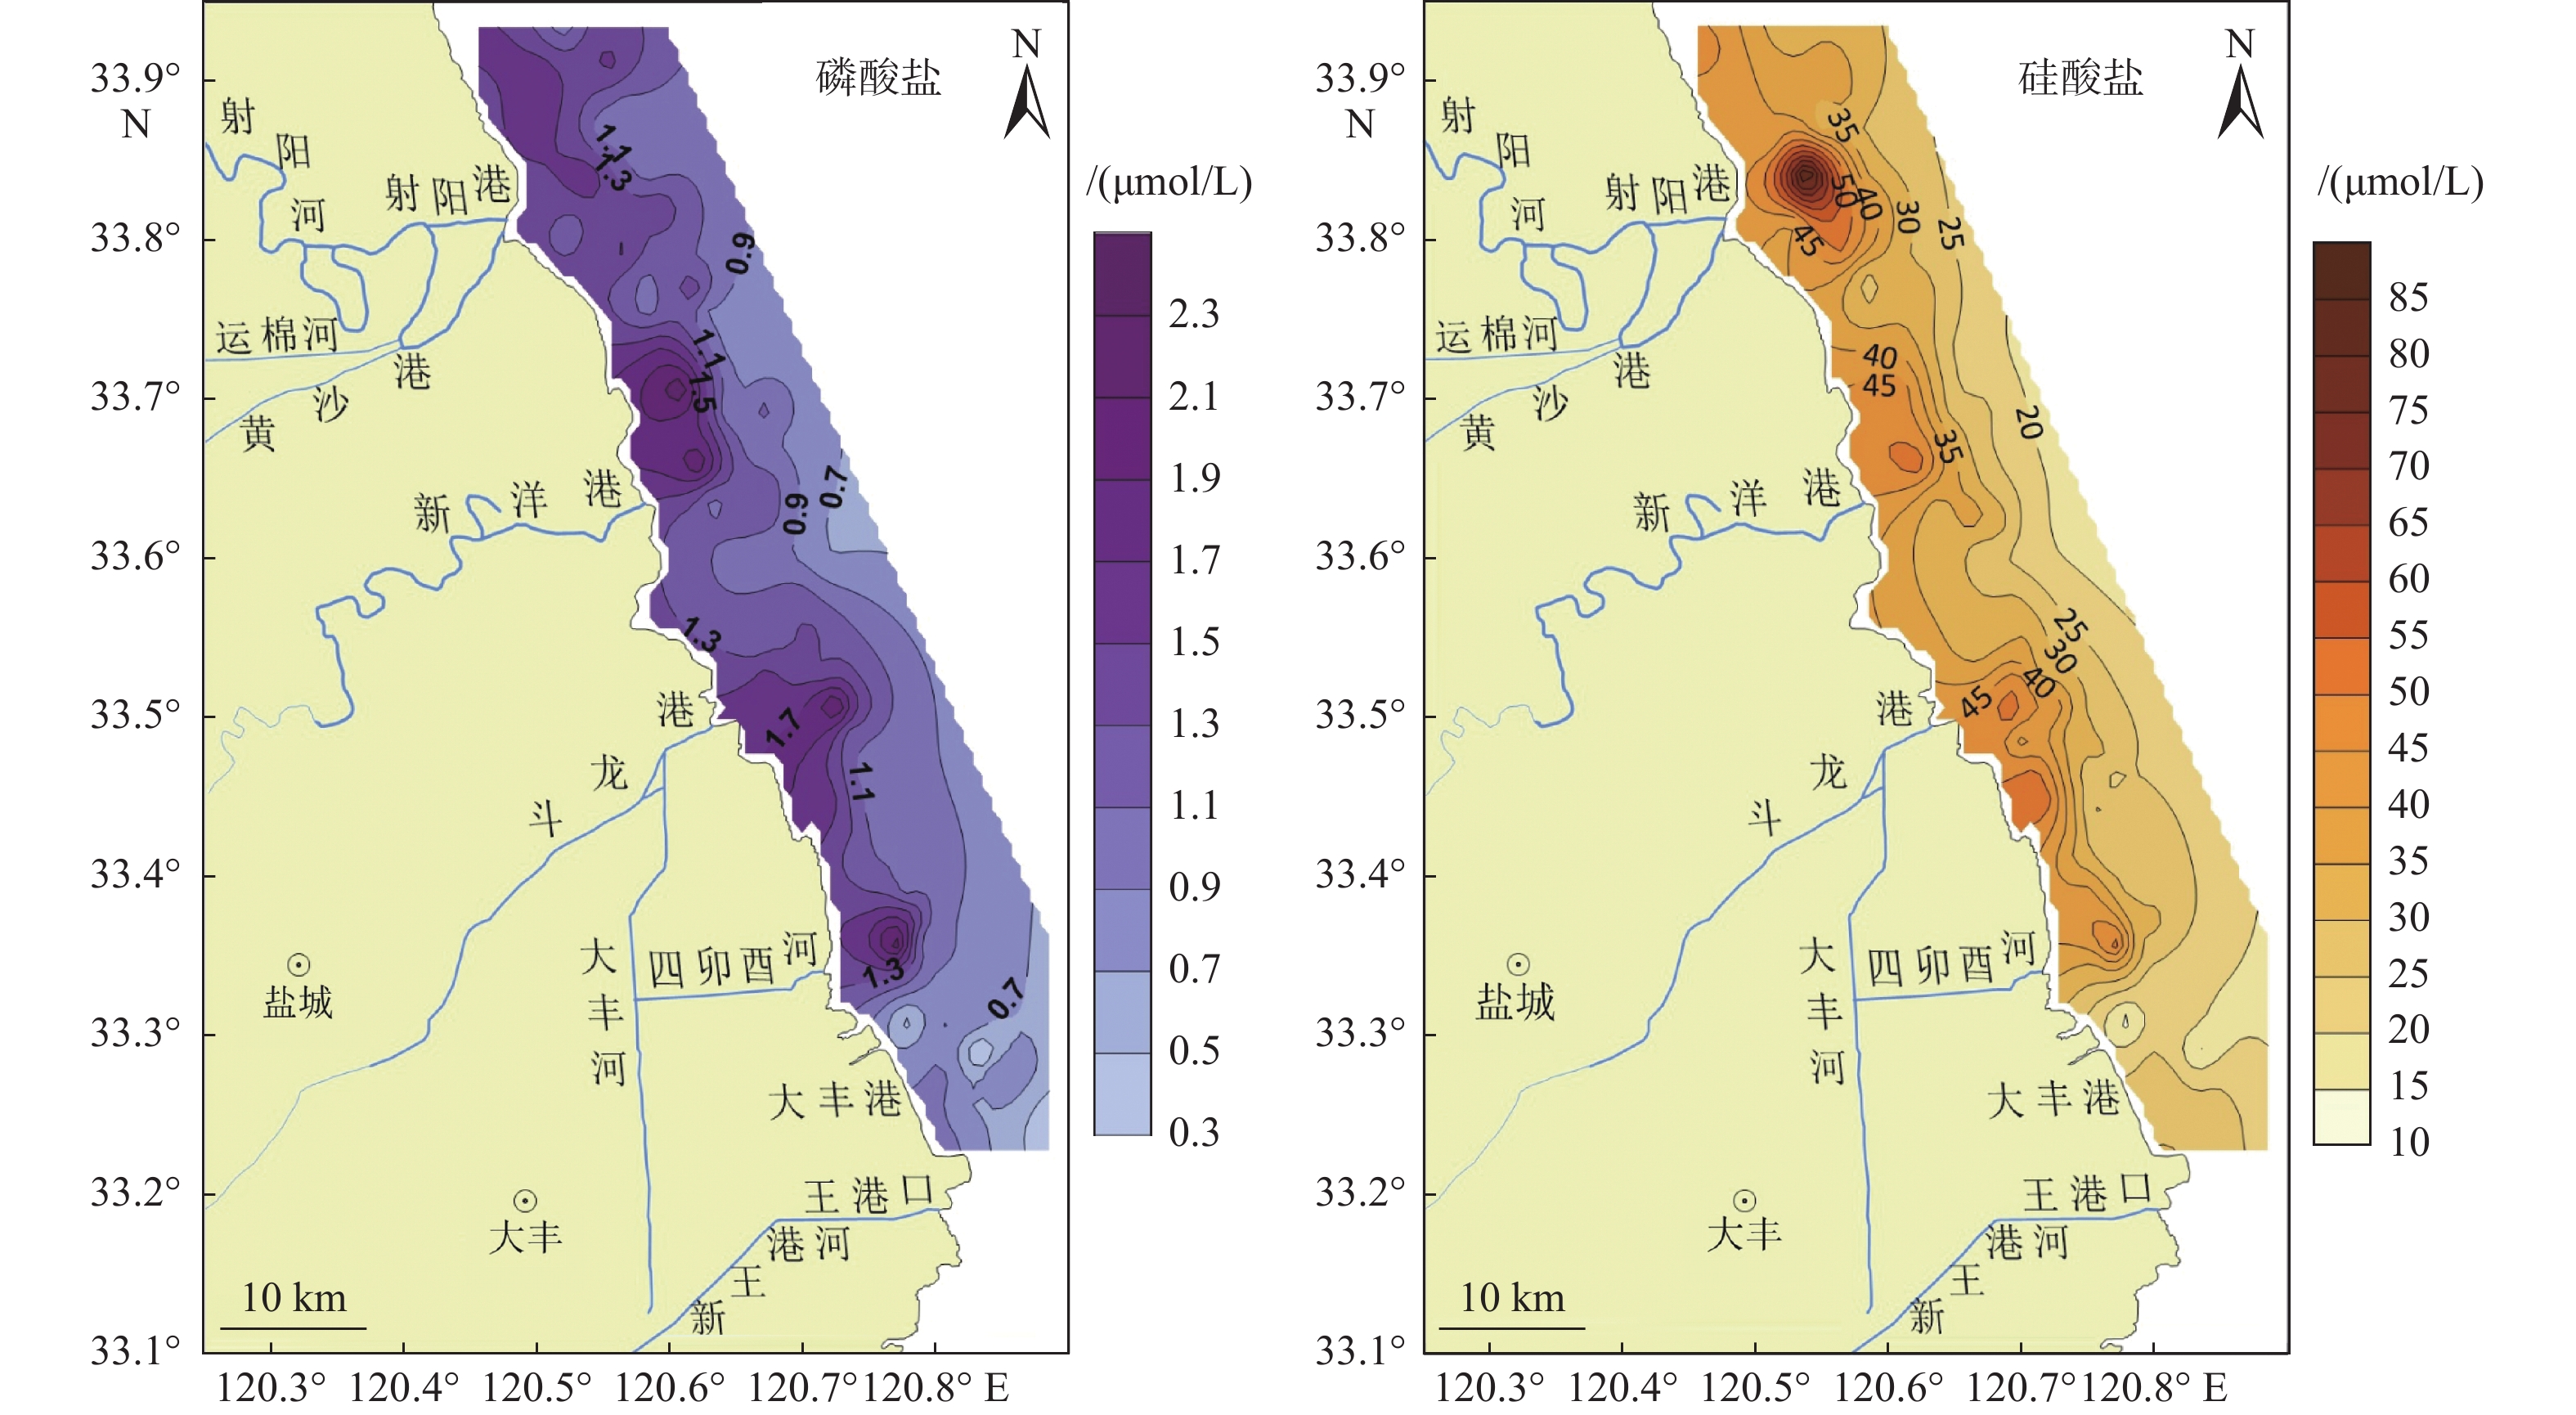
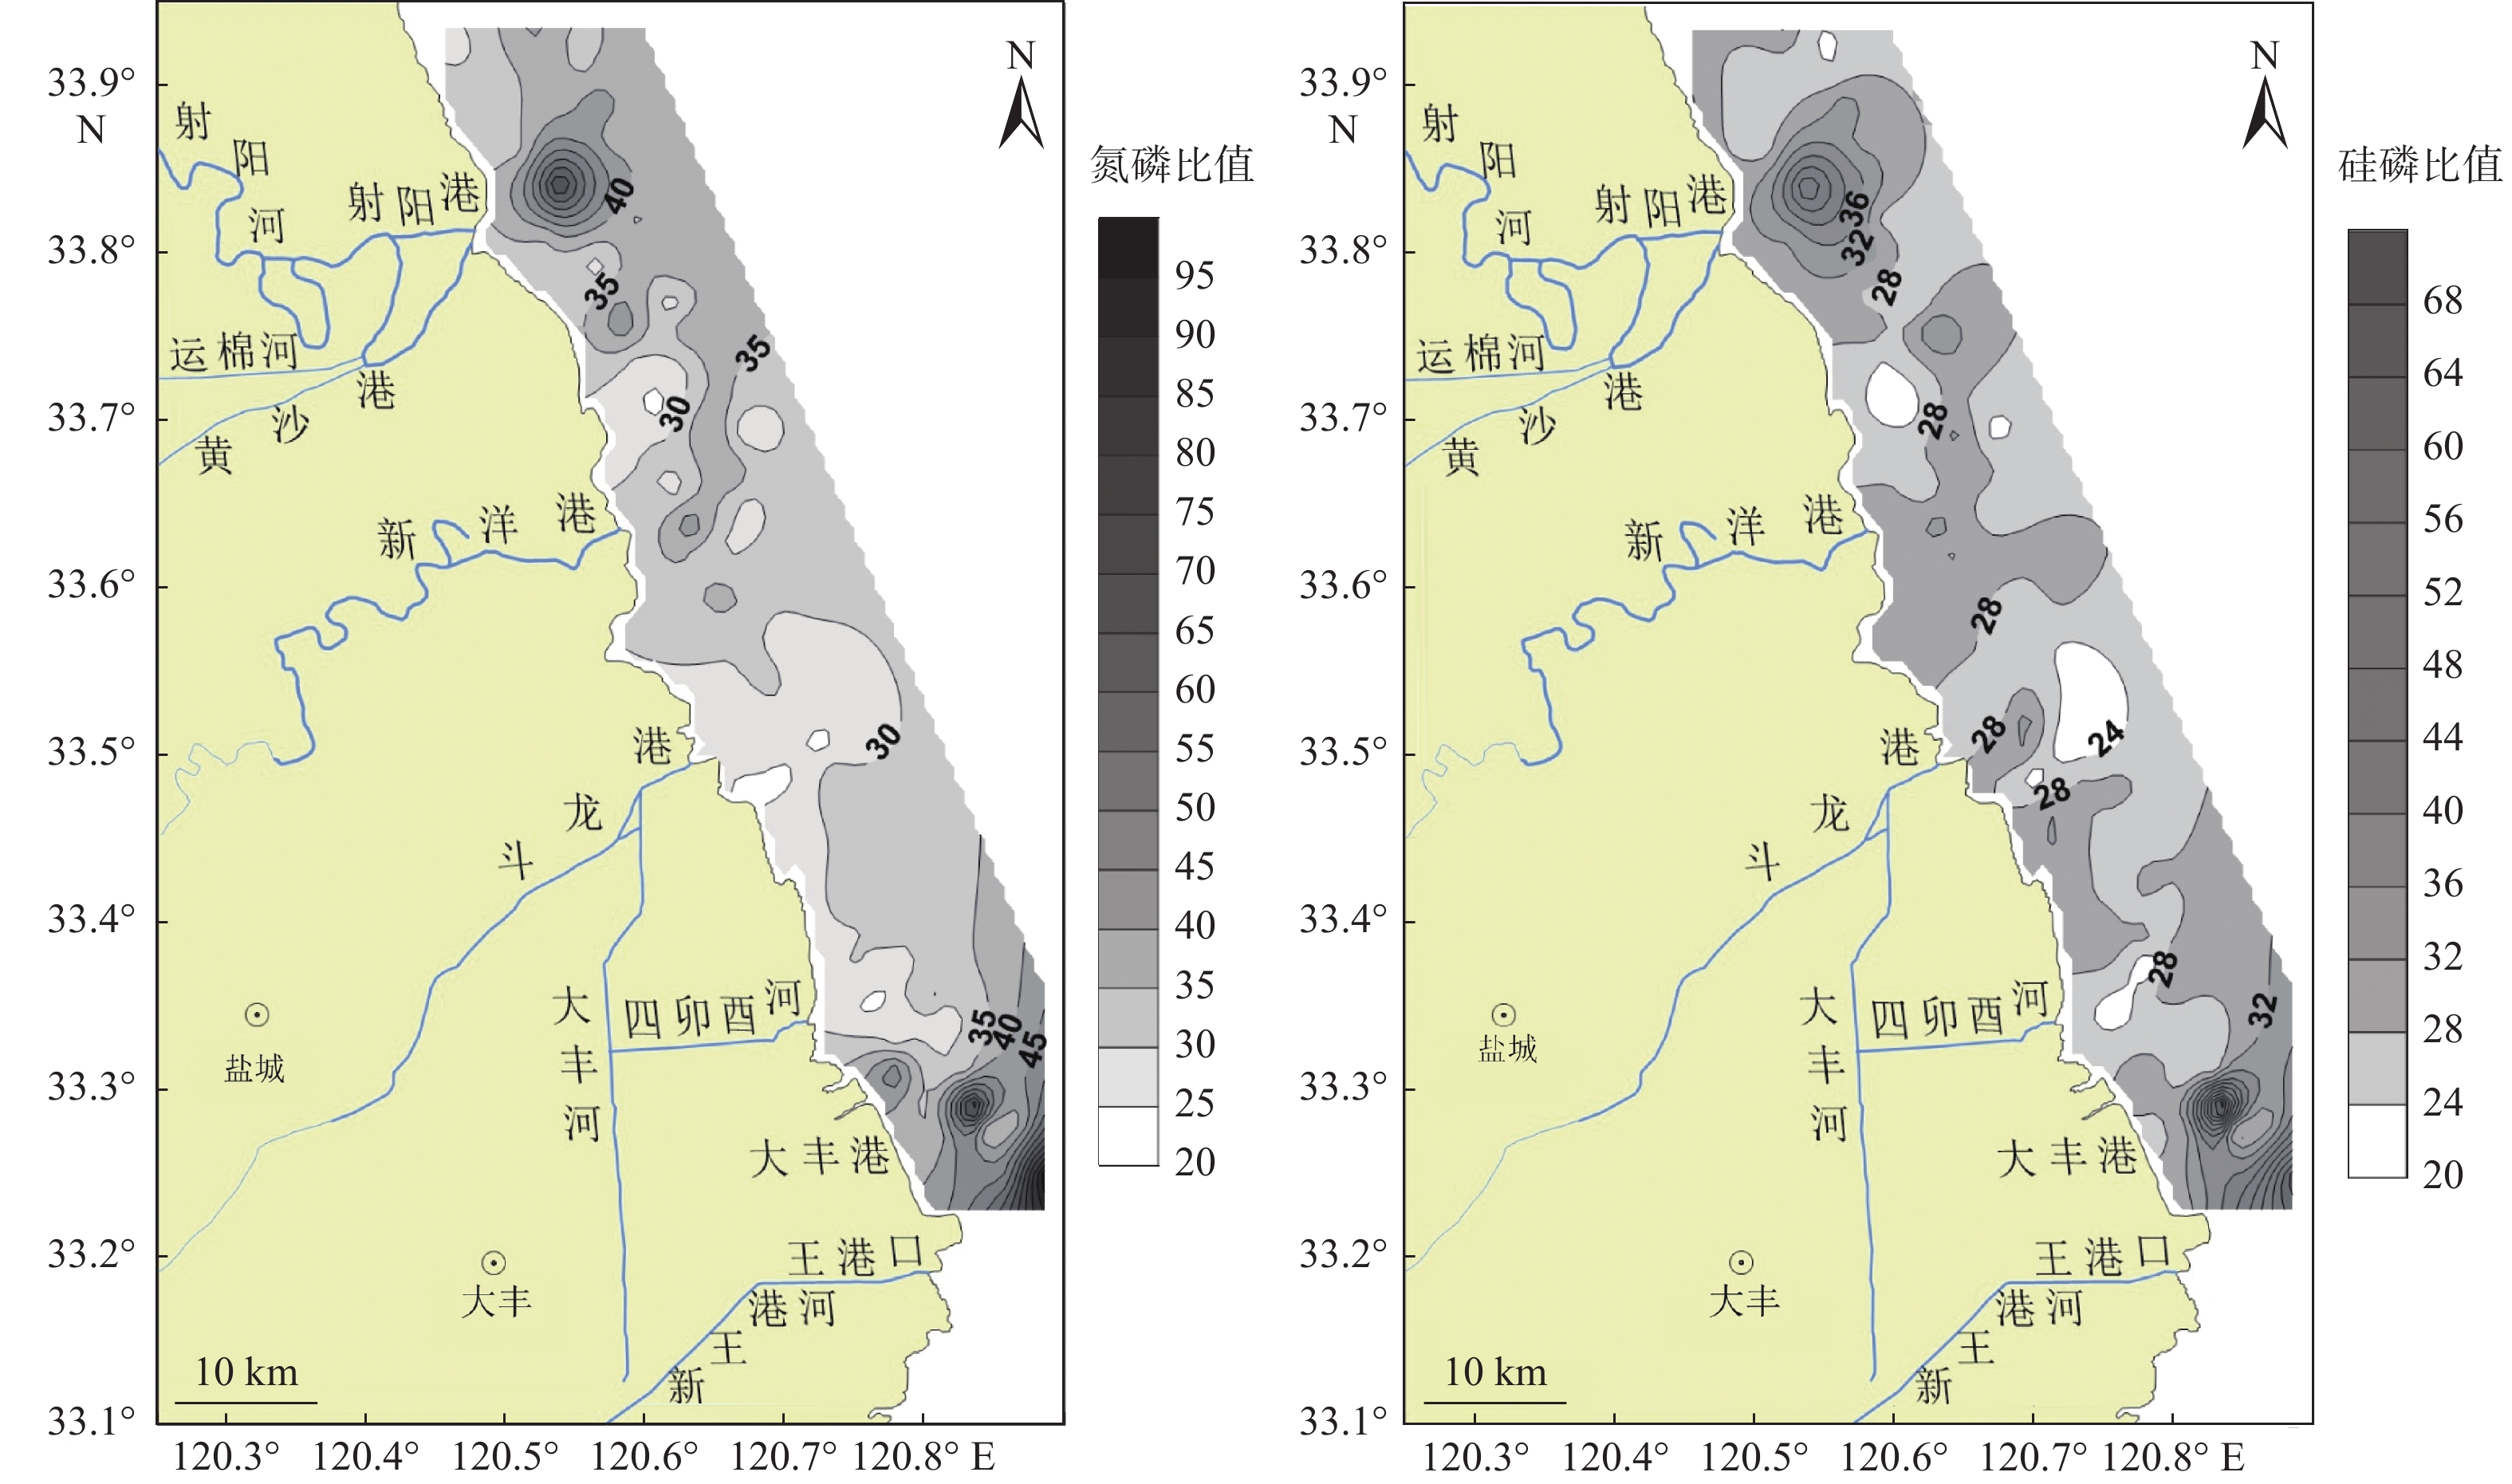
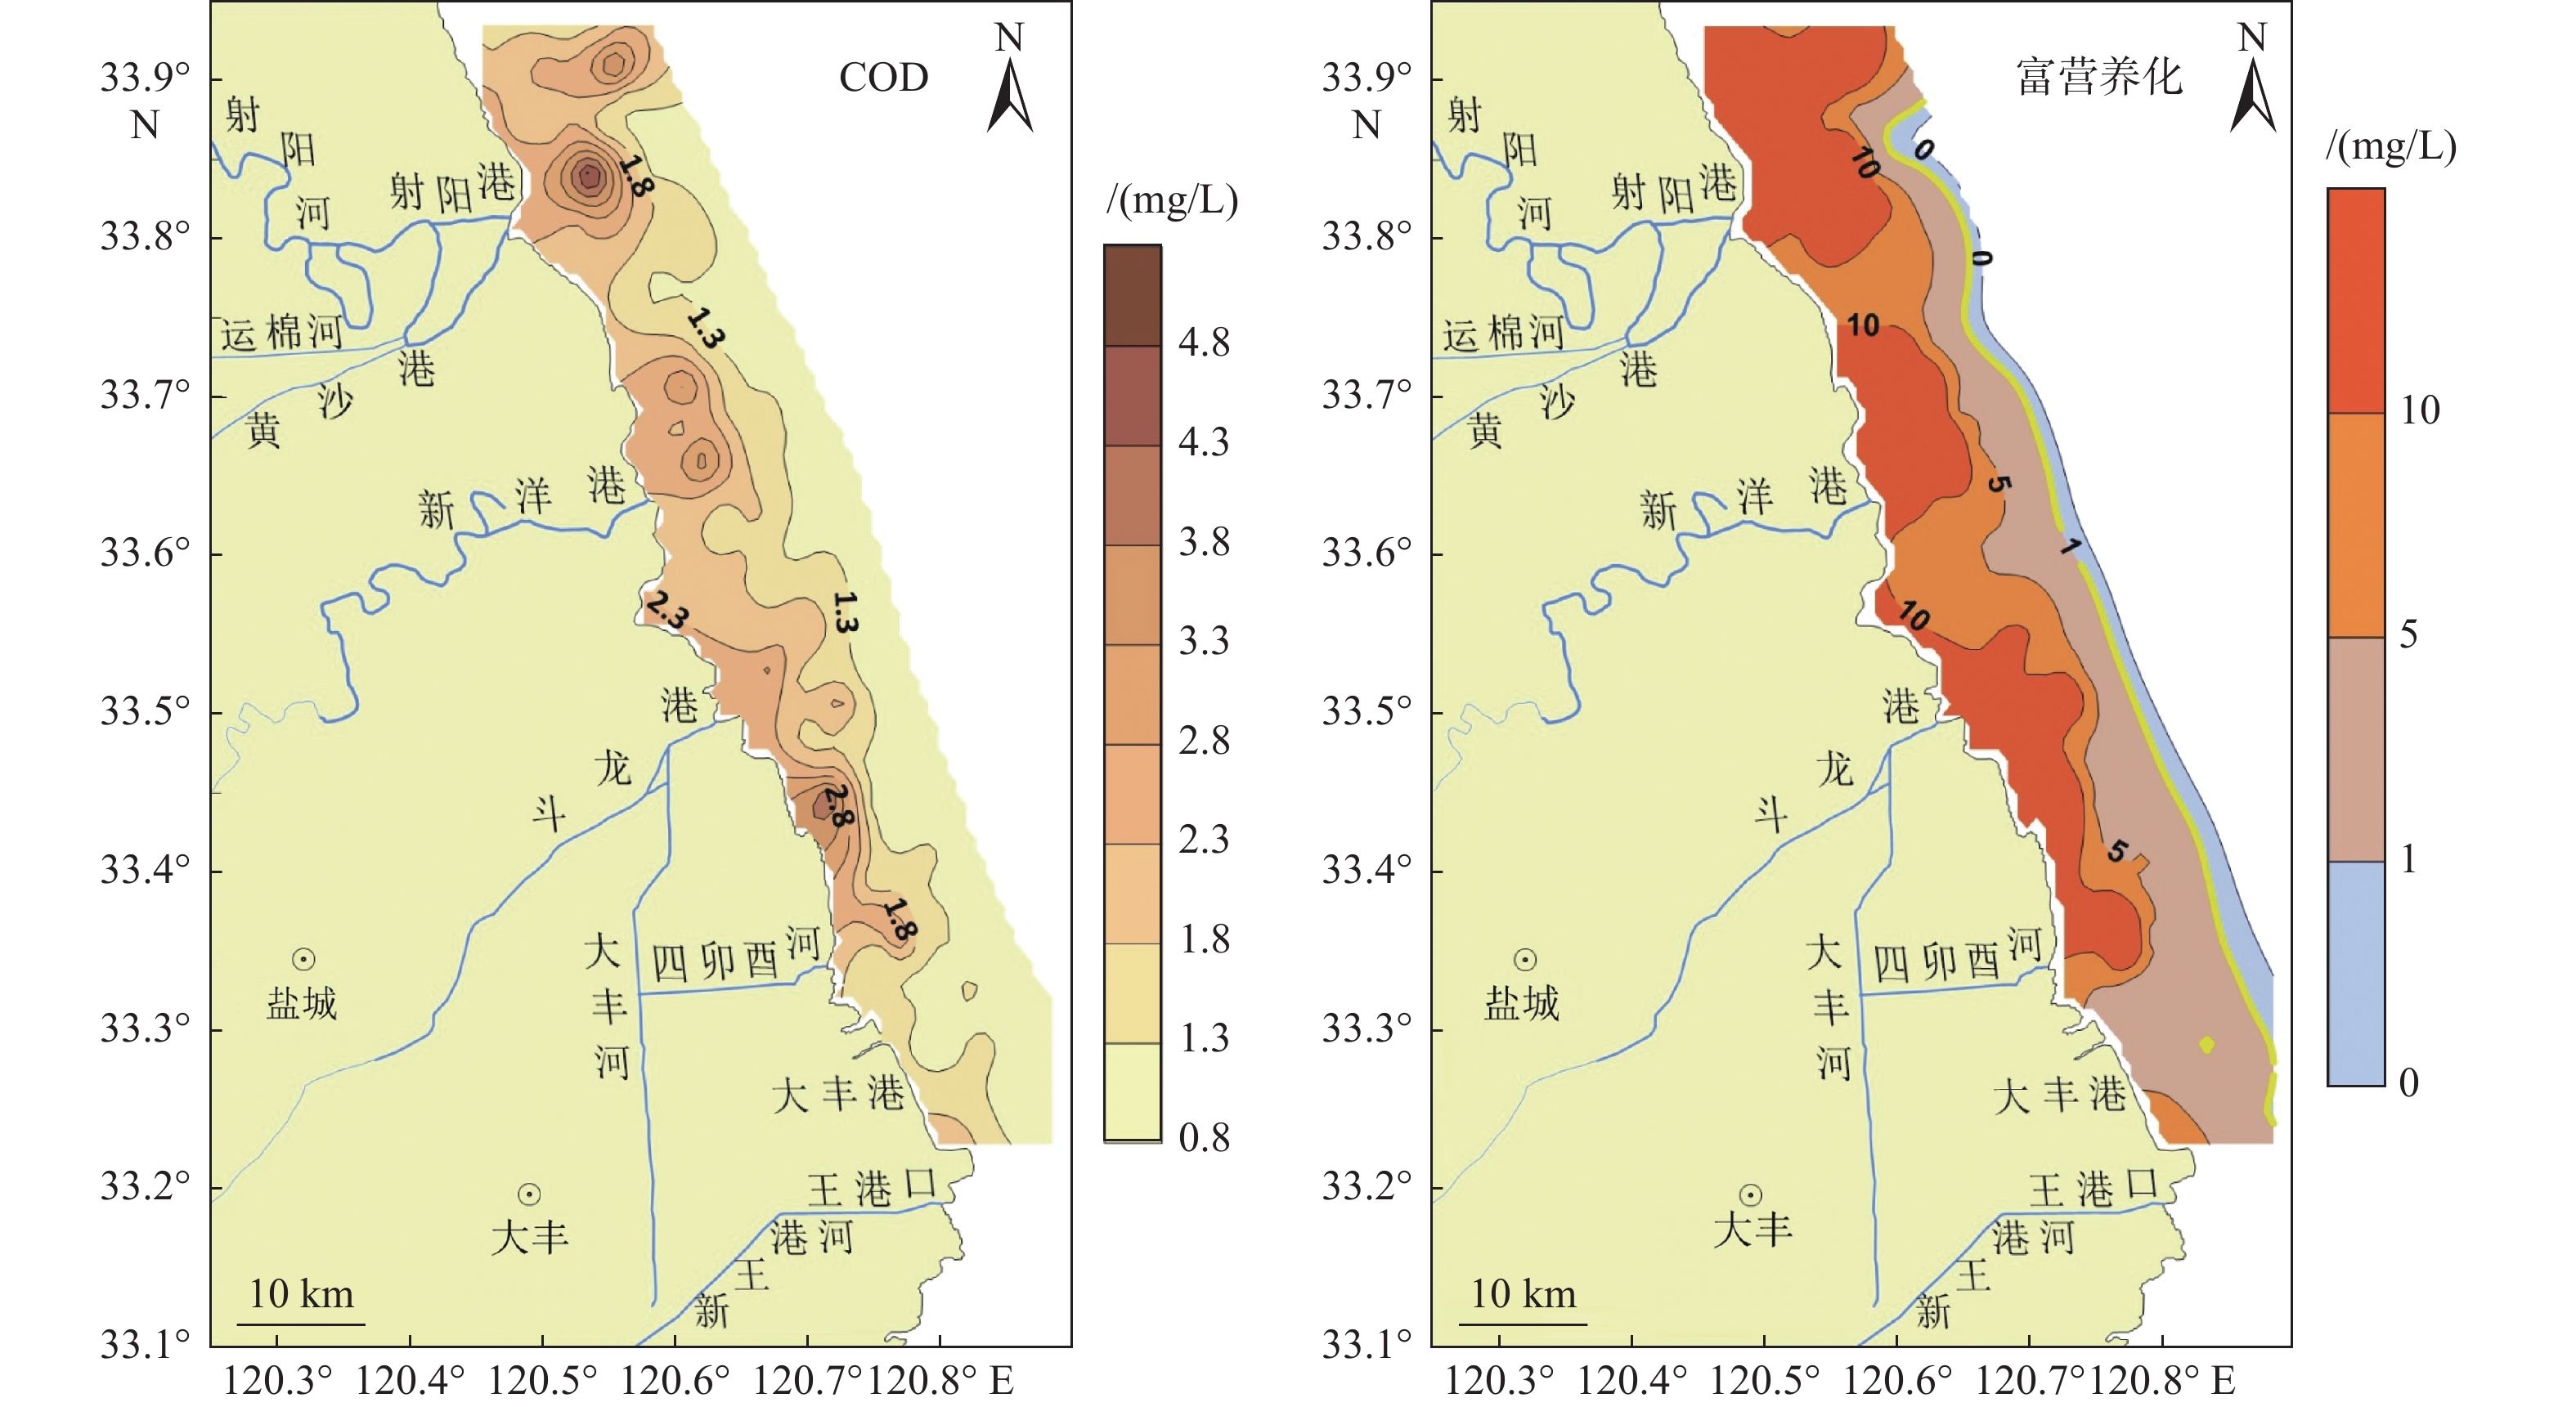
依据2018年江苏盐城近岸海域的营养盐和化学需氧量(COD)等调查数据,采用单因子污染指数法、营养盐结构和限制性分析、富营养化状态指数法等对水域营养盐状况与富营养化特征进行了系统分析和评价。同时,对近岸4条主要河流的溶解无机氮(DIN)、溶解无机磷(DIP)和COD入海通量进行了估算,并探讨了陆源输入对近岸海域的影响。结果表明,该区水体DIN和DIP含量劣于第Ⅲ类海水水质标准的站位占比分别为90%和71%,但COD污染并不显著,78%的调查站位水体COD符合或优于国家Ⅰ类海水水质标准。水体营养盐与COD含量的空间分布趋势相似,表现为近岸高、离岸低、河口与港口局部区域异常高。调查区富营养化极为严重,98%的调查站位富营养化状态指数(E)≥1,重度富营养化(E>10)的站位占比约30%。水体N/P平均为34,远高于Redfield比值,氮磷比例严重失衡,藻类生长可能会受到磷的潜在限制。经估算,近岸4条主要河流年DIN、DIP和COD的入海总量分别为12 901、484和33 077 t,为近岸海域污染物的主要来源;且各项污染物丰水季通量约为枯水季2倍;丰水季河流水体N/P比平均约为24.7,N污染较为严重,可能是造成夏季近岸海域氮磷比例失衡的重要原因之一。
Abstract:Based on in-situ investigation of water nutrients and chemical oxygen demand (COD) along the coast of Yancheng City, Jiangsu Province in 2018, nutrient concentrations, compositions, and spatial distributions were analyzed using single factor pollution index, nutrient ratios, and nutrient limitation. The related eutrophication status was evaluated using eutrophication state index. Meantime, the fluxes of dissolved inorganic nitrogen (DIN), dissolved inorganic phosphorus (DIP), and COD discharged into coast from four local rivers were calculated, and their impacts on the coast were discussed. Results show that DIN and DIP contents in 90% and 71% of sampling stations, respectively, were higher than the Class III seawater quality standard of China, showing apparent DIN and DIP pollutions. Comparatively, COD pollution was not significant because COD contents in 78% of sampling stations were below the Class I seawater quality standard. Spatial distribution patterns of water nutrient and COD were similar, and their contents decreased from nearshore to offshore in general, but increased sharply in some estuaries and ports. The eutrophication in the study area was very serious, because sampling stations with eutrophication state index (E)≥1 accounted for 98%, and stations with severe eutrophication (E>10) accounted for about 30%. Water N/P ratios were about 34 on average, much higher than the Redfield ratio, implying nutrient composition was seriously unbalanced, and algal growth might be potentially limited by phosphorus. Annual fluxes of DIN, DIP, and COD from four inflowing rivers into the coast were estimated to be 12 901, 484, and 33 077 t, respectively, which were the main pollutant sources of coastal waters. In addition, their fluxes in the wet season were about twice higher than those in the dry season, and N/P ratios of river runoff in the wet season were 24.7 in average, suggesting the serious N pollution, which was possibly the major reason for the imbalance of nitrogen and phosphorus in the coastal waters.
-
Key words:
- Yancheng City, Jiangsu Province /
- eutrophication /
- nutrient /
- river runoff /
- nutrient ratio
-

-
营养盐 绝对限制 潜在限制 限制因子 N/P Si/N Si/P N限制 DIN<1 μmol/L <10 >1 P限制 DIP<0.1 μmol/L >22 >22 Si限制 DSi<2 μmol/L <1 <10  下载: 导出CSV
级别 营养级 DIN/(mg/L) DIP/(mg/L) N:P/摩尔比 Ⅰ 贫营养 <0.2 <0.030 8~30 Ⅱ 中度营养 0.2~0.3 0.030~0.045 8~30 Ⅲ 富营养 >0.3 >0.045 8~30 ⅣP 磷限制中度营养 0.2~0.3 - >30 ⅤP 磷中等限制潜在性富营养 >0.3 - 30~60 ⅥP 磷限制潜在性富营养 >0.3 - >60 ⅣN 氮限制中度营养 - 0.030~0.045 <8 ⅤN 氮中等限制潜在性富营养 - >0.045 4~8 ⅥN 氮限制潜在性富营养 - >0.045 <4
下载: 导出CSV
表 3 研究区营养盐历史调查数据汇总及对比
/(μmol/L) Table 3. Summary and comparison of historical data of nutrients in the study area
/(μmol/L) 项目 海区 调查时间 表层水 数据来源 平均值 变化范围 NO3-N 122°—123°E
33°N以南2006年夏季 — 0.20~15.00 文献[41] 120.5°—123°E
33.5°—36°N2008年夏季 1.32 0.02~10.22 文献[39] 120.5°—122.2°E
32.3°—34°N2010年夏季 14.57 4.52~37.13 文献[38] 119.25°—122.17°E
31.75°—35.13°N2014年夏季 23.7 5.61~59.6 文献[14] 120.44°—120.8°E
33.1°—33.95°N2018年夏季 31.31 9.87~43.49 本研究 NH4-N 同上 2006年夏季 — — 文献[41] 2008年夏季 4.28 0.50~10.00 文献[39] 2010年夏季 — — 文献[38] 2014年夏季 1.77 0.47~6.48 文献[14] 2018年夏季 5.30 0.09~86.19 本研究 NO2-N 同上 2006年夏季 — — 文献[41] 2008年夏季 0.18 0.02~1.03 文献[39] 2010年夏季 — — 文献[38] 2014年夏季 1.50 0.05~7.50 文献[14] 2018年夏季 1.63 0.19~10.61 本研究 PO4-P 同上 2006年夏季 — 0.10~0.30 文献[41] 2008年夏季 0.02 0.02~0.07 文献[39] 2010年夏季 0.56 0.21~1.29 文献[38] 2014年夏季 0.42 0.16~1.36 文献[14] 2018年夏季 1.18 0.17~2.31 本研究 SiO3-Si 同上 2006年夏季 — 1.00~5.00 文献[41] 2008年夏季 1.82 0.02~5.15 文献[39] 2010年夏季 10.65 1.83~21.06 文献[38] 2014年夏季 11.96 1.76~24.39 文献[14] 2018年夏季 33.07 12.59~89.37 本研究 注:“—”表示文献中未列出数据。
下载: 导出CSV
表 4 COD单因子污染指数(Pi,j)评价结果
Table 4. Evaluation results of COD pollution index (Pi,j)
海水水质标准 Ⅰ类 Ⅱ类 Ⅲ类 Ⅳ类 超Ⅳ类 站位占比/% 78.21 16.83 1.98 1.98 0.99 指数范围 0.45~0.99 0.68~0.99 0.86~0.91 0.82~0.86 - 均值±标准差 0.69±0.14 0.79±0.09 0.89±0.03 0.84±0.24 -
下载: 导出CSV
表 5 针对江苏盐城近岸海域进行2种富营养化评价的统计结果
Table 5. Statistical results of two eutrophication evaluation methods in coastal waters of Yancheng City, Jiangsu Province
评价方法 评价结果分级 站位占比/% EIM 非富营养化(<1) 2.00 轻度富营养化(1~5) 38.60 中度富营养化(5~10) 29.70 重度富营养化(>10) 29.70 PEAM Ⅲ 12.87 ⅣP 2.97 ⅤP 70.29 ⅥP 1.98 无等级 11.88
下载: 导出CSV
表 6 江苏盐城近岸4条河流丰、枯水季DIN、DIP、COD通量计算结果
Table 6. Estimated fluxes of DIN, DIP, and COD from four rivers into the coast of Yancheng City, Jiangsu Province
河流名称 径流量/亿m3 流域面积/km2 DIP通量/(t/a) DIN通量/(t/a) COD通量/(t/a) 范围 均值 范围 均值 范围 均值 丰水季 射阳河 26.66 4036 115~177 146 2 355~5 496 3 925 7 598~14 192 10 895 新洋港 12.95 2478 74~116 95 1 310~3 452 2 381 4 813~7 032 5 922 斗龙港 7.3 4428 44~70 57 854~1698 1 276 2 107~3 614 2 860 新王港 5.63 596 47~73 60 1 015~1 555 1 285 2 665~2 969 2 817 总和 52.54 11 538 - 358 - 8 867 - 22 494 枯水季 射阳河 14.54 4 036 37~66 51 1347~2336 1 841 3 218~6 955 5 087 新洋港 7.06 2 478 27~37 32 967~1211 1 089 2 495~3 066 2 780 斗龙港 3.98 4 428 17~31 24 343~595 469 1 002~1 861 1 431 新王港 3.07 596 17~21 19 518~752 635 1 124~1 446 1 285 总和 28.65 11 538 - 126 - 4 034 - 10 583
下载: 导出CSV
-
[1] 劳齐斌,刘国强,高劲松,等. 钦州湾养殖区营养盐分布特征及富营养化状况研究[J]. 海洋环境科学,2021,40(3):407-416. doi: 10.12111/j.mes.20200066
[2] DIAZ R J,ROSENBERG R. Spreading dead zones and consequences for marine ecosystems[J]. Science,2008,321(5891):926-929. doi: 10.1126/science.1156401
[3] YAN X L,XU M N,WAN X S,et al. Dual isotope measurements reveal zoning of nitrate processing in the summer Changjiang (Yangtze) River plume[J]. Geophysical Research Letters,2017,44(24):12-289.
[4] 周名江,朱明远. 我国近海有害赤潮发生的生态学、海洋学机制及预测防治研究进展[J]. 应用生态学报,2003,21(7):673-679,2,3. doi: 10.13287/j.1001-9332.2003.0232
[5] 中华人民共和国生态环境部. 2018年中国海洋生态环境状况公报 [EB/OL]. [2022-1-4]. https://www.mee.gov.cn/ywdt/tpxw/201905/t20190529_704840.shtml.
[6] 刘亚林,刘洁生,俞志明,等. 陆源输入营养盐对赤潮形成的影响[J]. 海洋科学,2006,30(6):66-72. doi: 10.3969/j.issn.1000-3096.2006.06.012
[7] 王菊英,郑楠,马德毅. 近海生态系统的人为营养盐输入及其控制对策浅析[J]. 海洋学报,2020,42(6):1-8.
[8] 林晓娟,高姗,仉天宇,等. 海水富营养化评价方法的研究进展与应用现状[J]. 地球科学进展,2018,33(4):373-384. doi: 10.11867/j.issn.1001-8166.2018.04.0373
[9] 曹飞凤,代可,陶琦茹,等. 杭州湾区近岸海域污染状况分析及治理对策研究[J]. 环境科学与技术,2020,43(10):60-69. doi: 10.19672/j.cnki.1003-6504.2020.10.008
[10] 魏传杰. 南黄海水文环境季节变化与湍流混合研究[D]. 青岛: 中国科学院大学(中国科学院海洋研究所), 2018.
[11] 于仁成,吕颂辉,齐雨藻,等. 中国近海有害藻华研究现状与展望[J]. 海洋与湖沼,2020,51(4):768-788. doi: 10.11693/hyhz20200400127
[12] 林森杰,姬南京,罗昊. 海洋有害藻华研究进展[J]. 海洋与湖沼,2019,50(3):495-510. doi: 10.11693/hyhz20180800191
[13] 孙瑜, 陈瑜. 浒苔绿潮成黄海海域常规化生态灾害[N]. 2021-07-08(003).
[14] 张艾芹,江辉煌,顾正平,等. 江苏近岸海域表层海水中营养盐组成、分布及季节变化特征[J]. 海洋湖沼通报,2018:49-59. doi: 10.13984/j.cnki.cn37-1141.2018.02.007
[15] 张丽君. 江苏北部近岸海域营养盐的时空分布与富营养化特征研究[D]. 青岛: 青岛大学, 2016.
[16] 中国国家标准化管理委员会. GB 17378.3—2007 海洋监测规范 第 3 部分: 样品采集、贮存与运输[S]. 北京: 中国标准出版社, 2007.
[17] 裴绍峰,沈志良. 长江口上升流区营养盐的分布及其通量的初步估算[J]. 海洋科学,2008,32(9):64-70,75.
[18] 祝陈坚. 海水分析化学实验[M]. 青岛: 中国海洋大学出版社, 2006.
[19] 周爱国, 蔡鹤生. 地质环境质量评价理论与应用[M]. 武汉: 中国地质大学出版社, 1998.
[20] 中华人民共和国生态环境部. GB 3097—1997 海水水质标准[S]. 北京: 中国标准出版社, 1997.
[21] ANDERSON D M,CEMBELLA A D,HALLEGRAEFF G M,et al. Progress in understanding harmful algal blooms:paradigm shifts and new technologies for research,monitoring,and management[J]. Annual Review of Marine Science,2012,4:143-176. doi: 10.1146/annurev-marine-120308-081121
[22] LIANG Z Y,WU S F,CHEN H L,et al. A probabilistic method to enhance understanding of nutrient limitation dynamics of phytoplankton[J]. Ecological Modelling,2018,368:404-410. doi: 10.1016/j.ecolmodel.2017.11.004
[23] WEI Q S,WANG B D,YAO Q Z,et al. Physical-biogeochemical interactions and potential effects on phytoplankton and Ulva prolifera in the coastal waters off Qingdao(Yellow Sea,China)[J]. Acta Oceanologica Sinica,2019,38(2):11-23. doi: 10.1007/s13131-019-1344-3
[24] 张海波,裴绍峰,祝雅轩,等. 初夏渤海湾营养盐结构特征及其限制状况分析[J]. 中国环境科学,2018,38(9):3524-3530. doi: 10.3969/j.issn.1000-6923.2018.09.039
[25] LAWS E A,PEI S F,BIENFANG P. Phosphate-limited growth of the marine diatom Thalassiosira weissflogii (Bacillariophyceae):evidence of non-monod growth kinetics1[J]. Journal of Phycology,2013,49(2):241-247. doi: 10.1111/jpy.12047
[26] NELSON D M,BRZEZINSKI M A. Kinetics of silicic acid uptake by natural diatom assemblages in two Gulf Stream warm-core rings[J]. Marine Ecology Progress,1990,62(3):283-292.
[27] JUSTIĆ D,RABALAIS N N,TURNER R E,et al. Changes in nutrient structure of river-dominated coastal waters:stoichiometric nutrient balance and its consequences[J]. Estuarine,Coastal and Shelf Science,1995,40(3):339-356. doi: 10.1016/S0272-7714(05)80014-9
[28] DORTCH Q,WHITLEDGE T E. Does nitrogen or silicon limit phytoplankton production in the Mississippi River plume and nearby regions?[J]. Continental Shelf Research,1992,12(11):1293-1309. doi: 10.1016/0278-4343(92)90065-R
[29] 张莹,王玉珏,王跃启,等. 2013年夏季渤海环境因子与叶绿素a的空间分布特征及相关性分析[J]. 海洋通报,2016,35(5):571-578. doi: 10.11840/j.issn.1001-6392.2016.05.011
[30] 俞志明, 沈志良. 长江口水域富营养化[M]. 北京: 科学出版社, 2011.
[31] 冈市友利. 浅海的污染与赤潮的发生, 内湾赤潮的发生机制[R]. 日本水产资源保护协会, 1972: 58-76.
[32] 邹景忠,董丽萍,秦保平. 渤海湾富营养化和赤潮问题的初步探讨[J]. 海洋环境科学,1983(2):45-58.
[33] REDFIELD A C,KETCHUM B H,RICHARDS F A. The influence of organisms on the composition of sea-water[J]. The Sea,1963,2:26-77.
[34] GRUBER N,DEUTSCH C A. Redfield's evolving legacy[J]. Nature Geoscience,2014,7(12):853-855. doi: 10.1038/ngeo2308
[35] 郭卫东,章小明,杨逸萍,等. 中国近岸海域潜在性富营养化程度的评价[J]. 台湾海峡,1998(1):64-70.
[36] 魏潇,李凡,马元庆,等. 2014年山东近岸海域海水氮磷营养盐含量特征及富营养化评价[J]. 海洋湖沼通报,2019,170(5):105-111. doi: 10.13984/j.cnki.cn37-1141.2019.05.013
[37] 孙丽萍. 江苏省污染物入海通量测算及与水质响应关系研究[D]. 南京: 河海大学, 2007.
[38] 高嵩,石晓勇,王婷. 浒苔绿潮与苏北近岸海域营养盐浓度的关系研究[J]. 环境科学,2012,33(7):2204-2209. doi: 10.13227/j.hjkx.2012.07.004
[39] 王婷,石晓勇,张传松,等. 2008 年黄海浒苔绿潮爆发区营养盐浓度变化及分布特征[J]. 海洋通报,2011,30(5):578-582. doi: 10.3969/j.issn.1001-6392.2011.05.017
[40] 张海波,刘珂,苏荣国,等. 2018 年南黄海浒苔绿潮迁移发展规律与营养盐相互关系探究[J]. 海洋学报,2020,42(8):30-39.
[41] 韦钦胜,刘璐,战闰,等. 夏季南黄海海水化学要素的分布特征及影响因素[J]. 中国海洋大学学报(自然科学版),2010,40(1):82-88.
[42] 于仁成,刘东艳. 我国近海藻华灾害现状,演变趋势与应对策略[J]. 中国科学院院刊,2016,31(10):1167-1174.
[43] 王宗灵,傅明珠,周健,等. 黄海浒苔绿潮防灾减灾现状与早期防控展望[J]. 海洋学报,2020,42(8):1-11.
[44] 洪华生. 中国区域海洋学, 化学海洋学[M]. 北京: 海洋出版社, 2012.
[45] 艾洋漪,徐敏,丁言者,等. 大丰近岸海域水质污染特征及来源[J]. 南京师范大学学报(自然科学版),2019,42(4):153-161.
[46] 沈永明. 江苏近岸海域营养盐类污染分布特征与评价[J]. 生态环境学报. 2010: 6-10.
[47] 丁言者. 江苏近岸海域水质变化特征研究[D]. 南京: 南京师范大学, 2014.
[48] PEI S F, SHEN Z L, LAWS E A. Nutrient dynamics in the upwelling area of Changjiang (Yangtze River) Estuary[J]. Journal of Coastal Research, 2009, 25(3): 569-580.
[49] KAWABATA Z,HIRANO Y. Growth pattern and cellular nitrogen and phosphorus contents of the dinoflagellate Peridinium penardii (Lemm. ) Lemm. causing a freshwater red tide in a reservoir[J]. Hydrobiologia,1995,312(2):115-120. doi: 10.1007/BF00020767
[50] ALVAREZ-SALGADO X A,ROSÓN G,PÉREZ F,et al. Nitrogen cycling in an estuarine upwelling system,the Ría de Arousa (NW Spain). I. Short-time-scale patterns of hydrodynamic and biogeochemical circulation[J]. Marine Ecology Progress,1996,135(1/3):259-273.
[51] 中华人民共和国生态环境部. GB 3838—2002地表水环境质量标准[S]. 北京: 中国标准出版社, 2002.
[52] 吴云波, 杨浩明. 射阳河水环境综合整治对策研究与分析[J]. 污染防治技术. 2011: 48-51, 72.
[53] 齐童,刘瑞志,李捷,等. 射阳河近海段水环境质量分析及评价[J]. 青岛农业大学学报(自然科学版),2019,36(2):119-125.
-

图(5)
表(6)
计量
- 文章访问数: 1816
- PDF下载数: 179
- 施引文献: 0