

-
摘要:
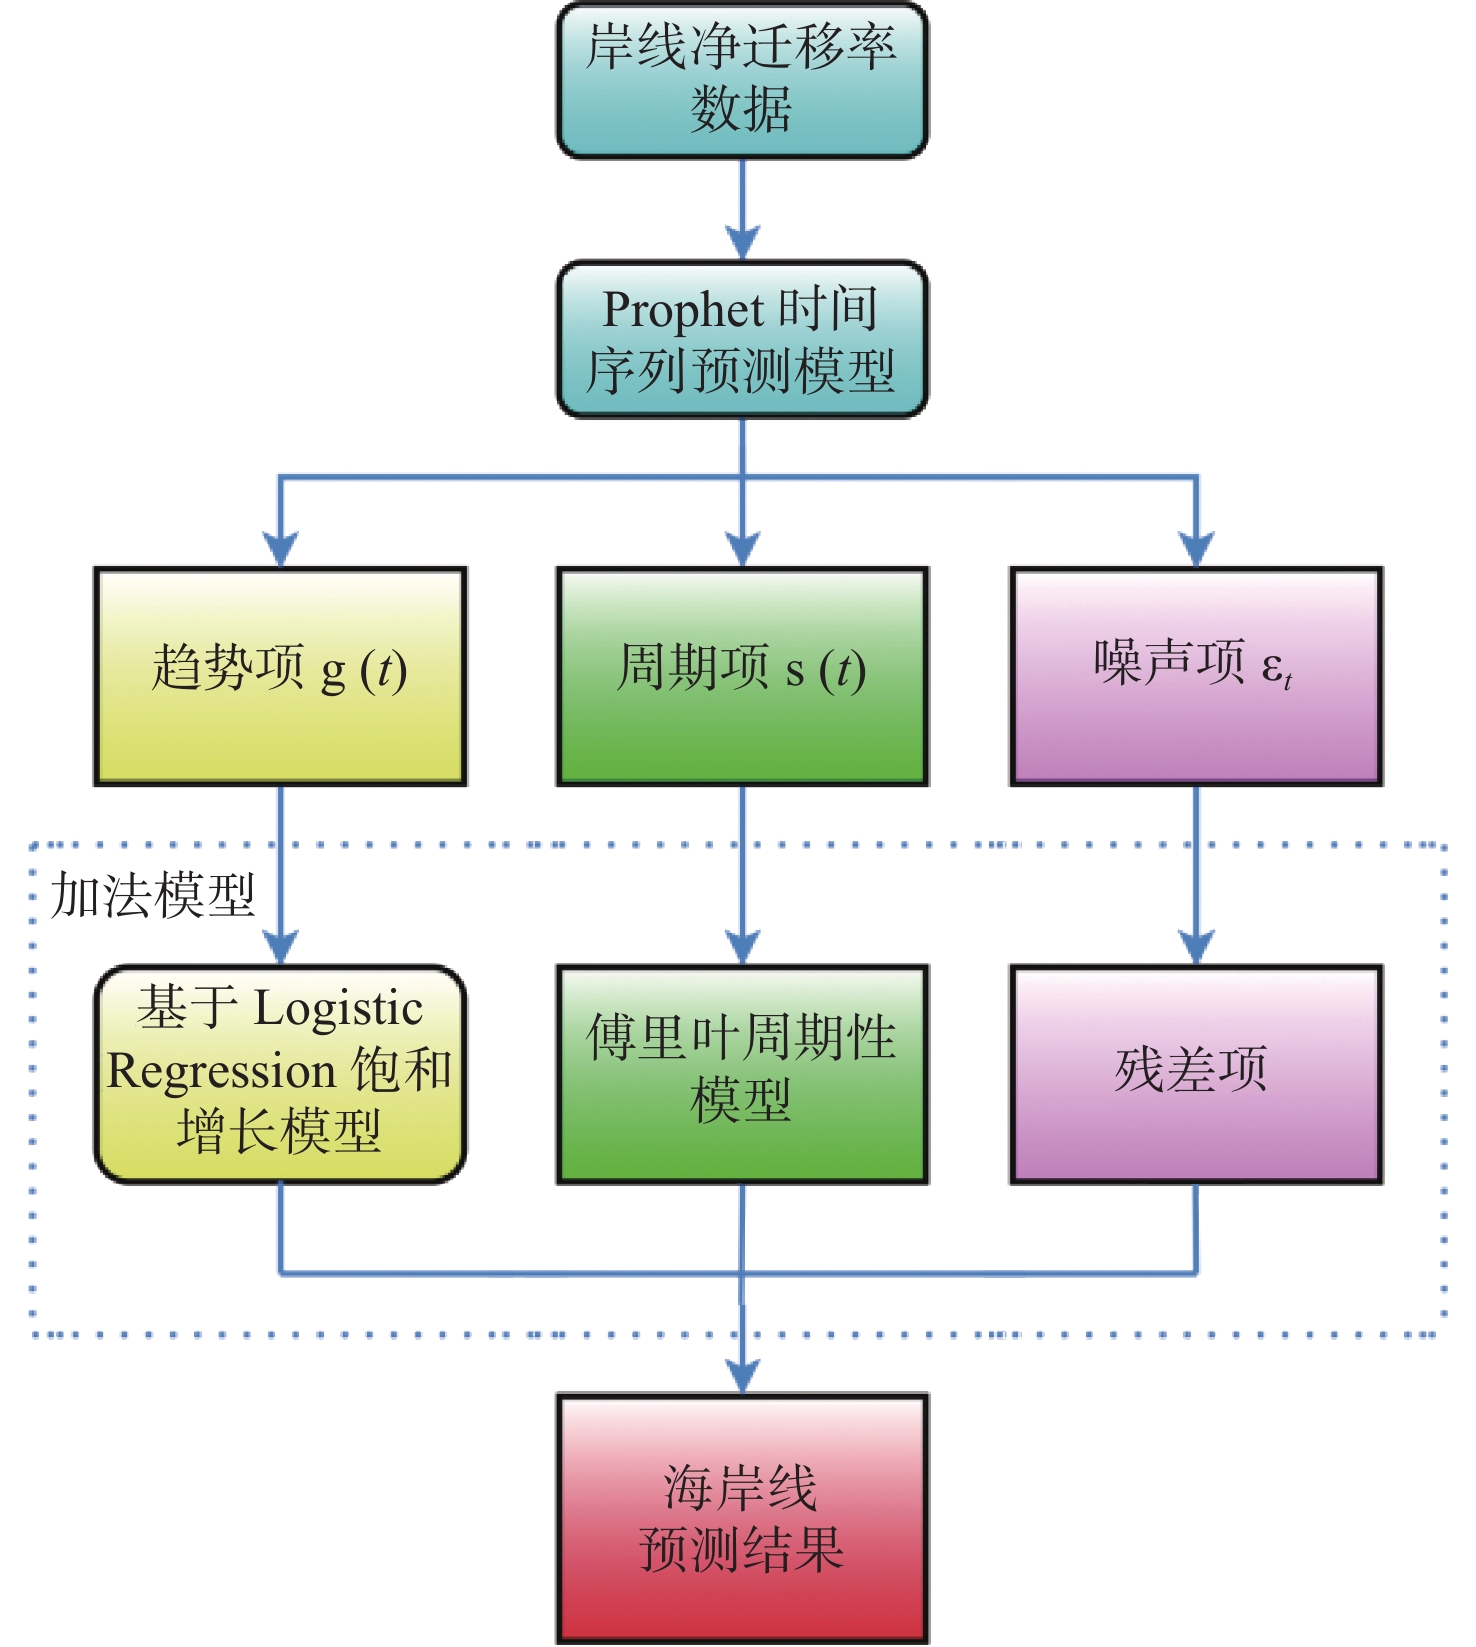
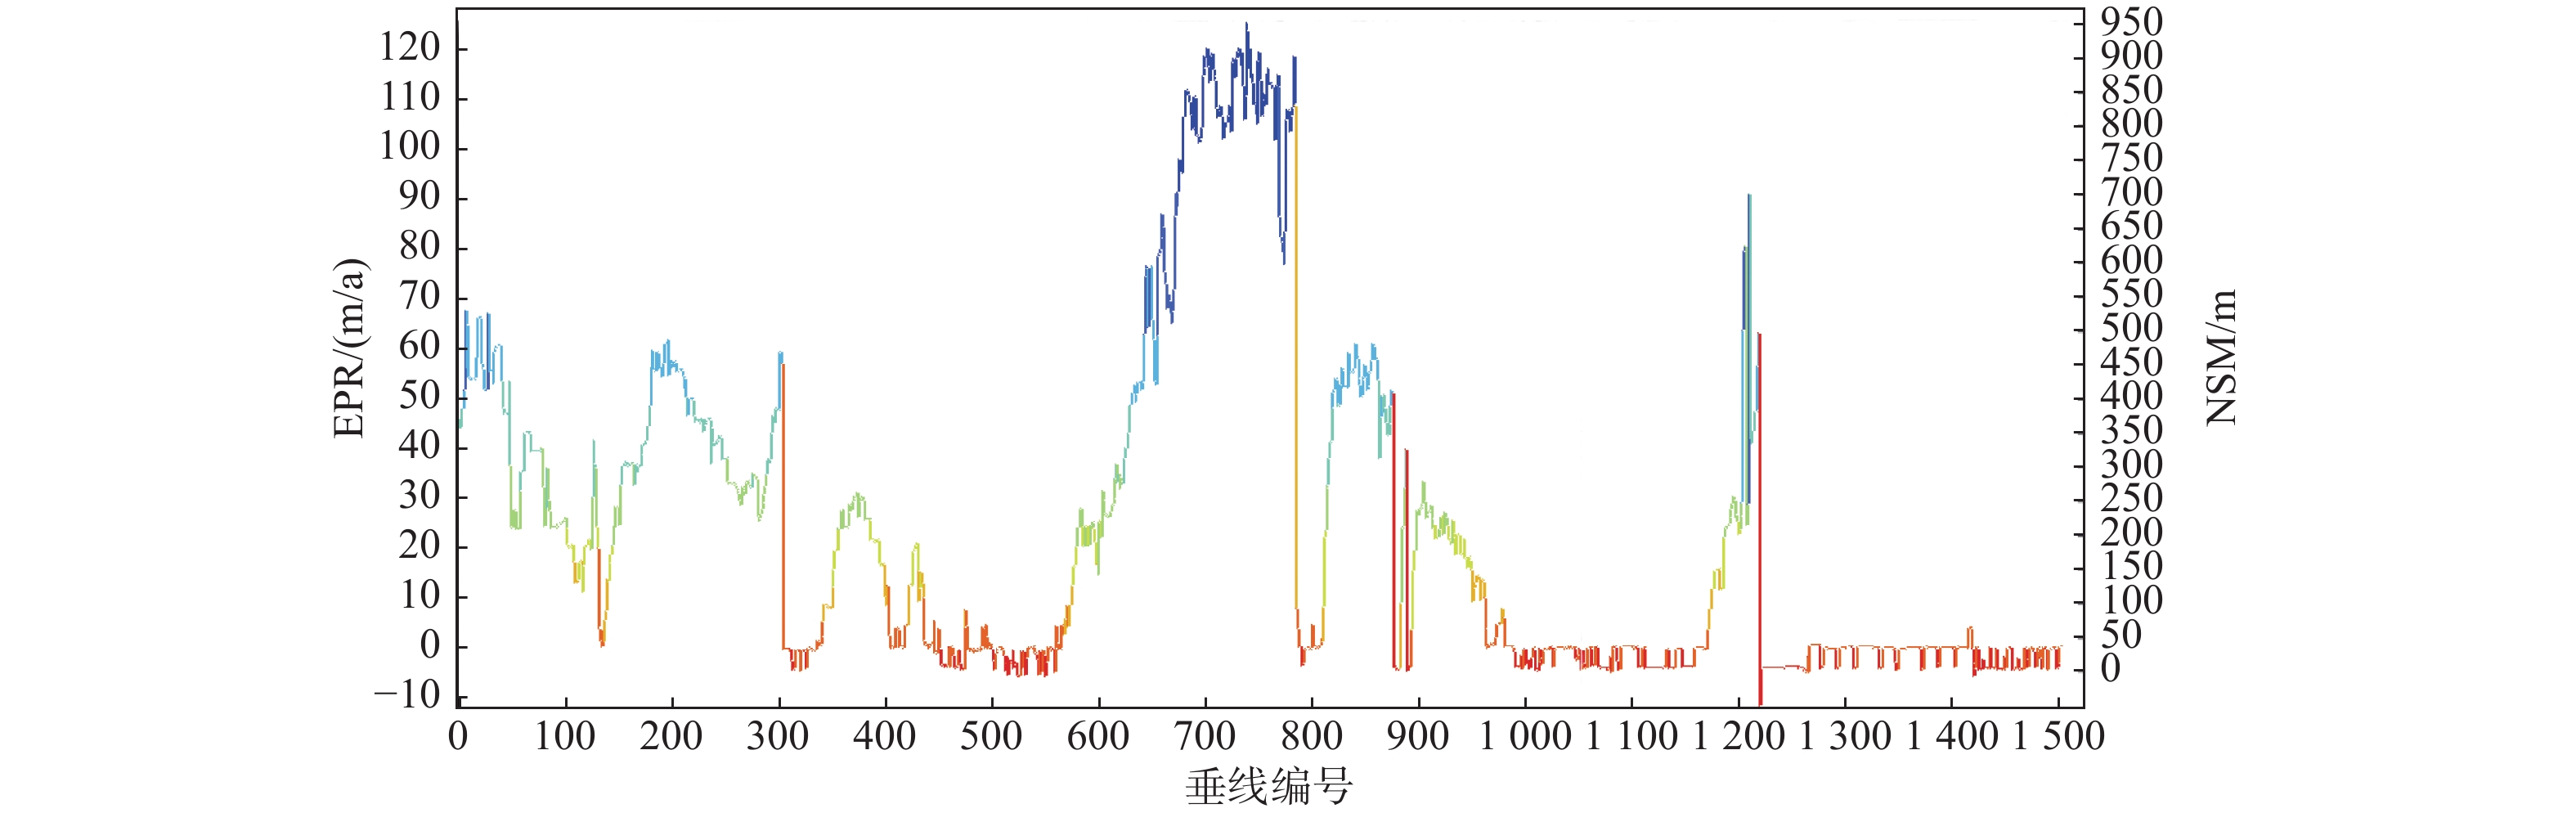
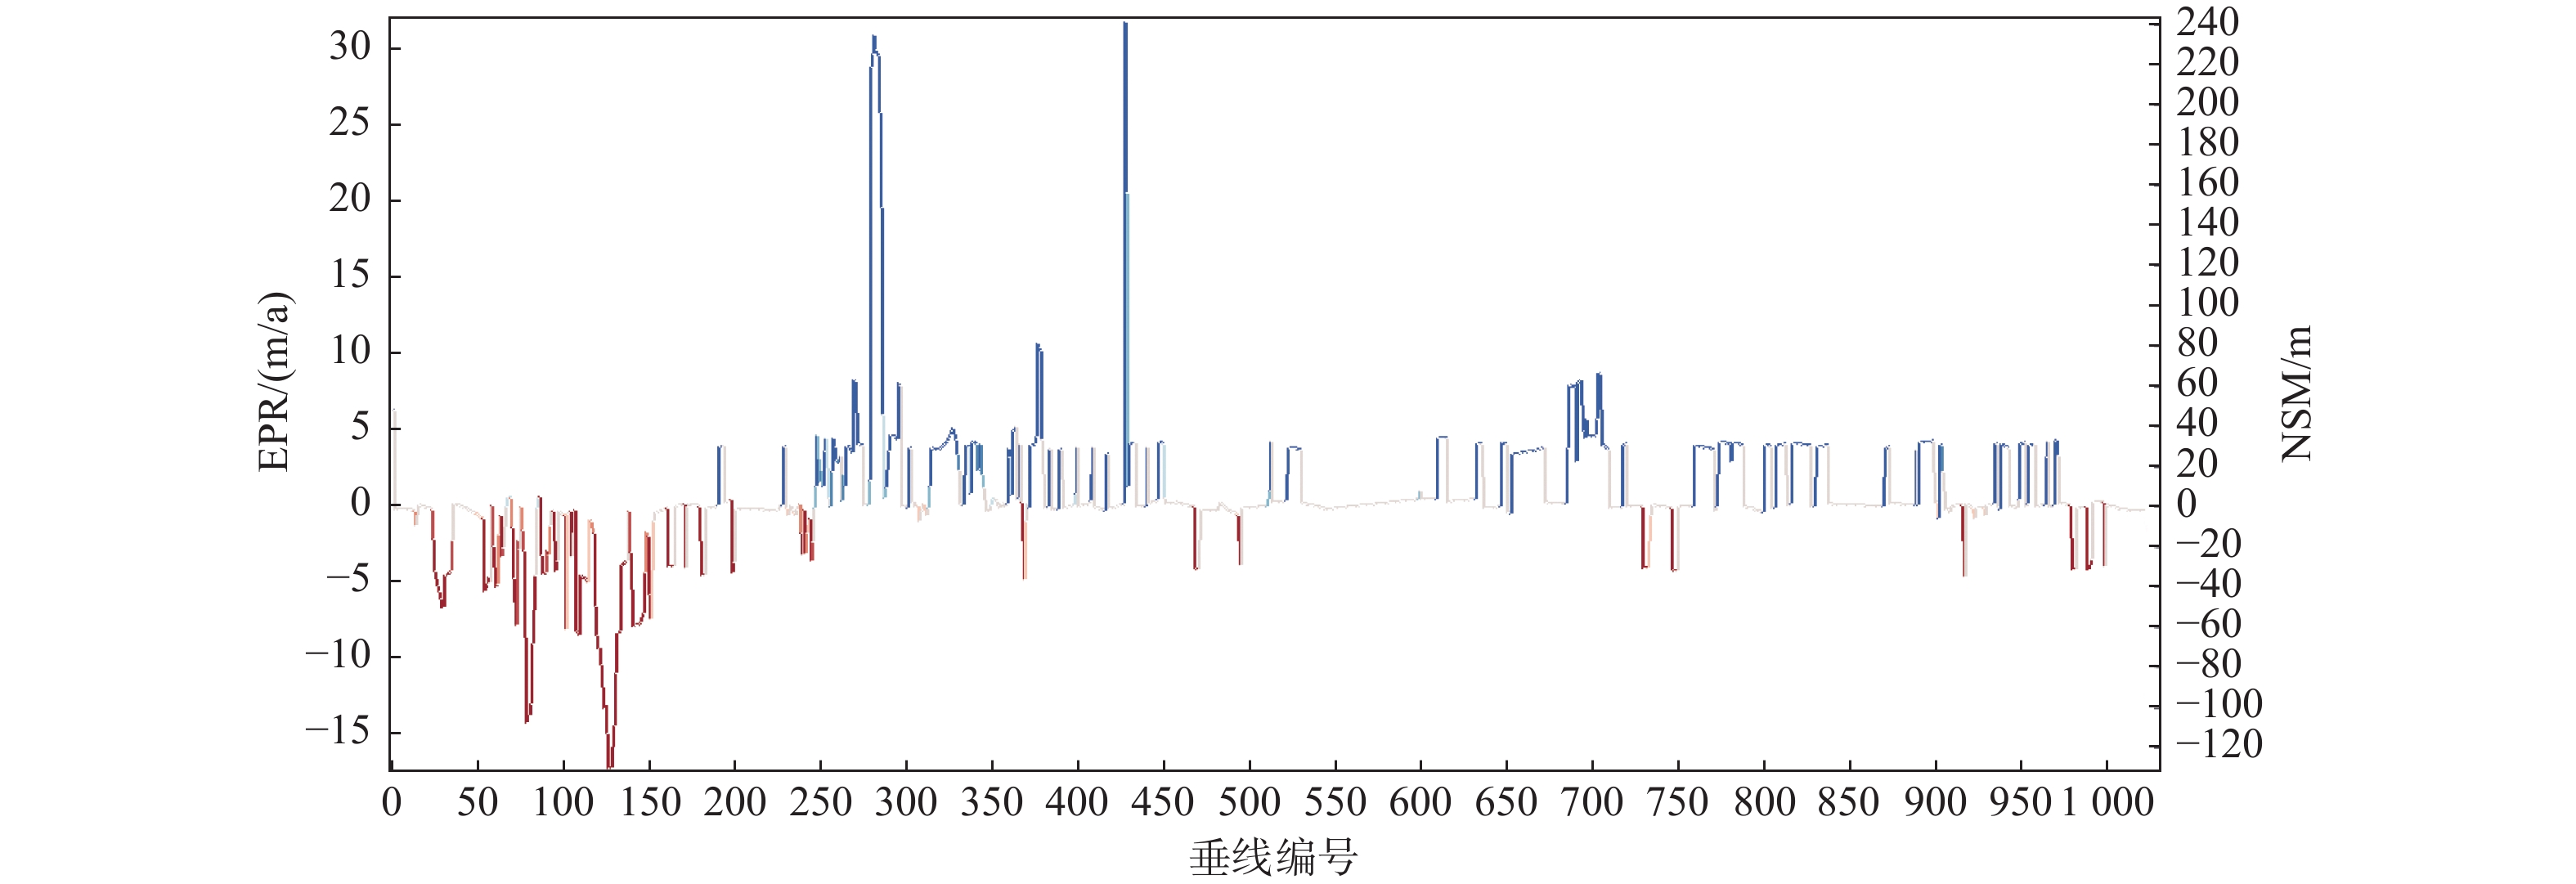
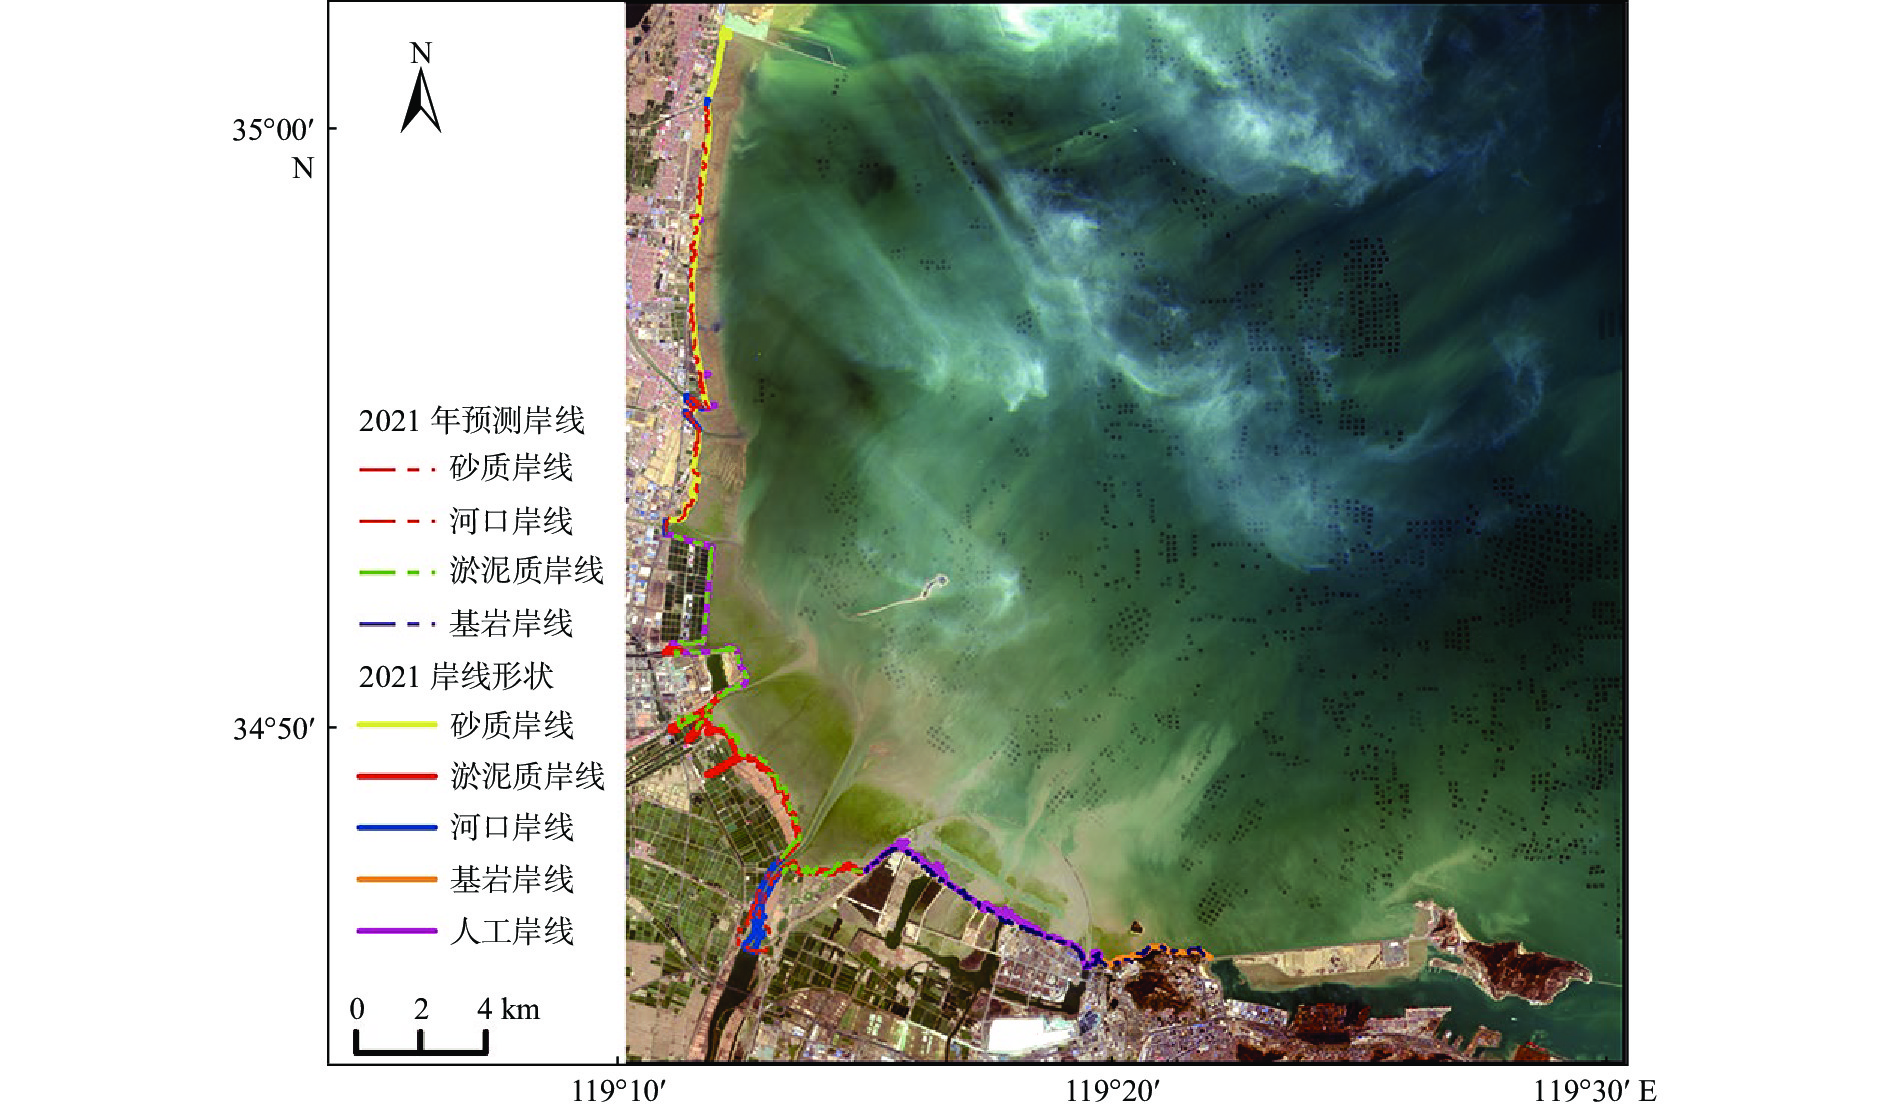
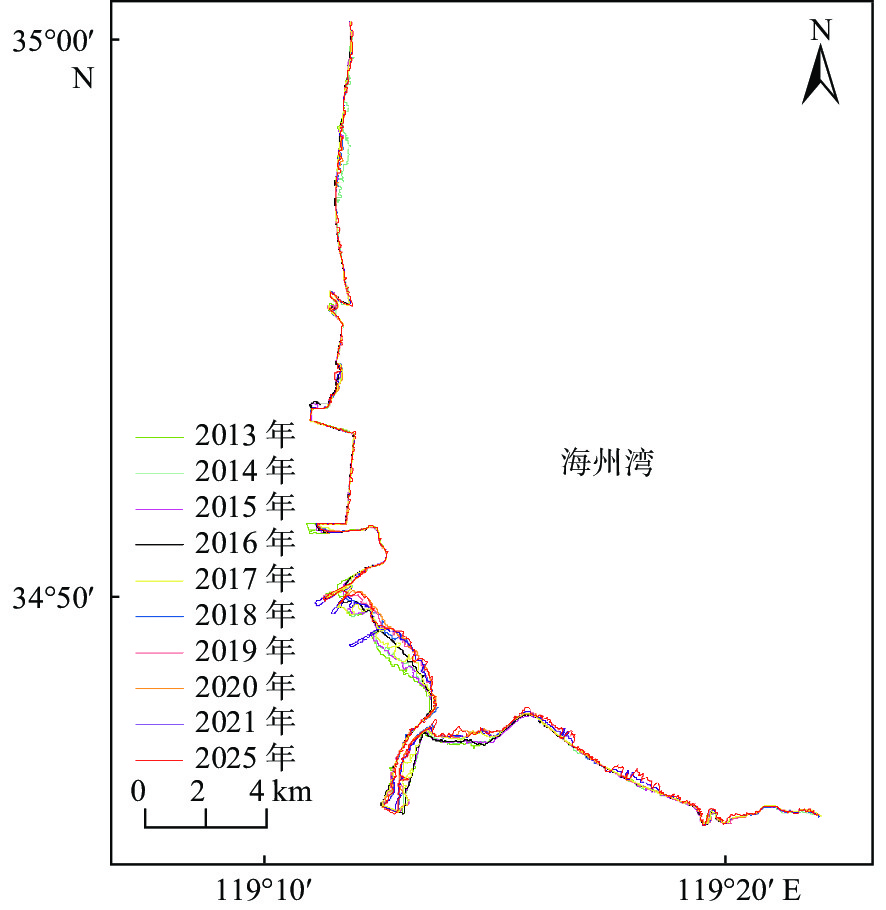
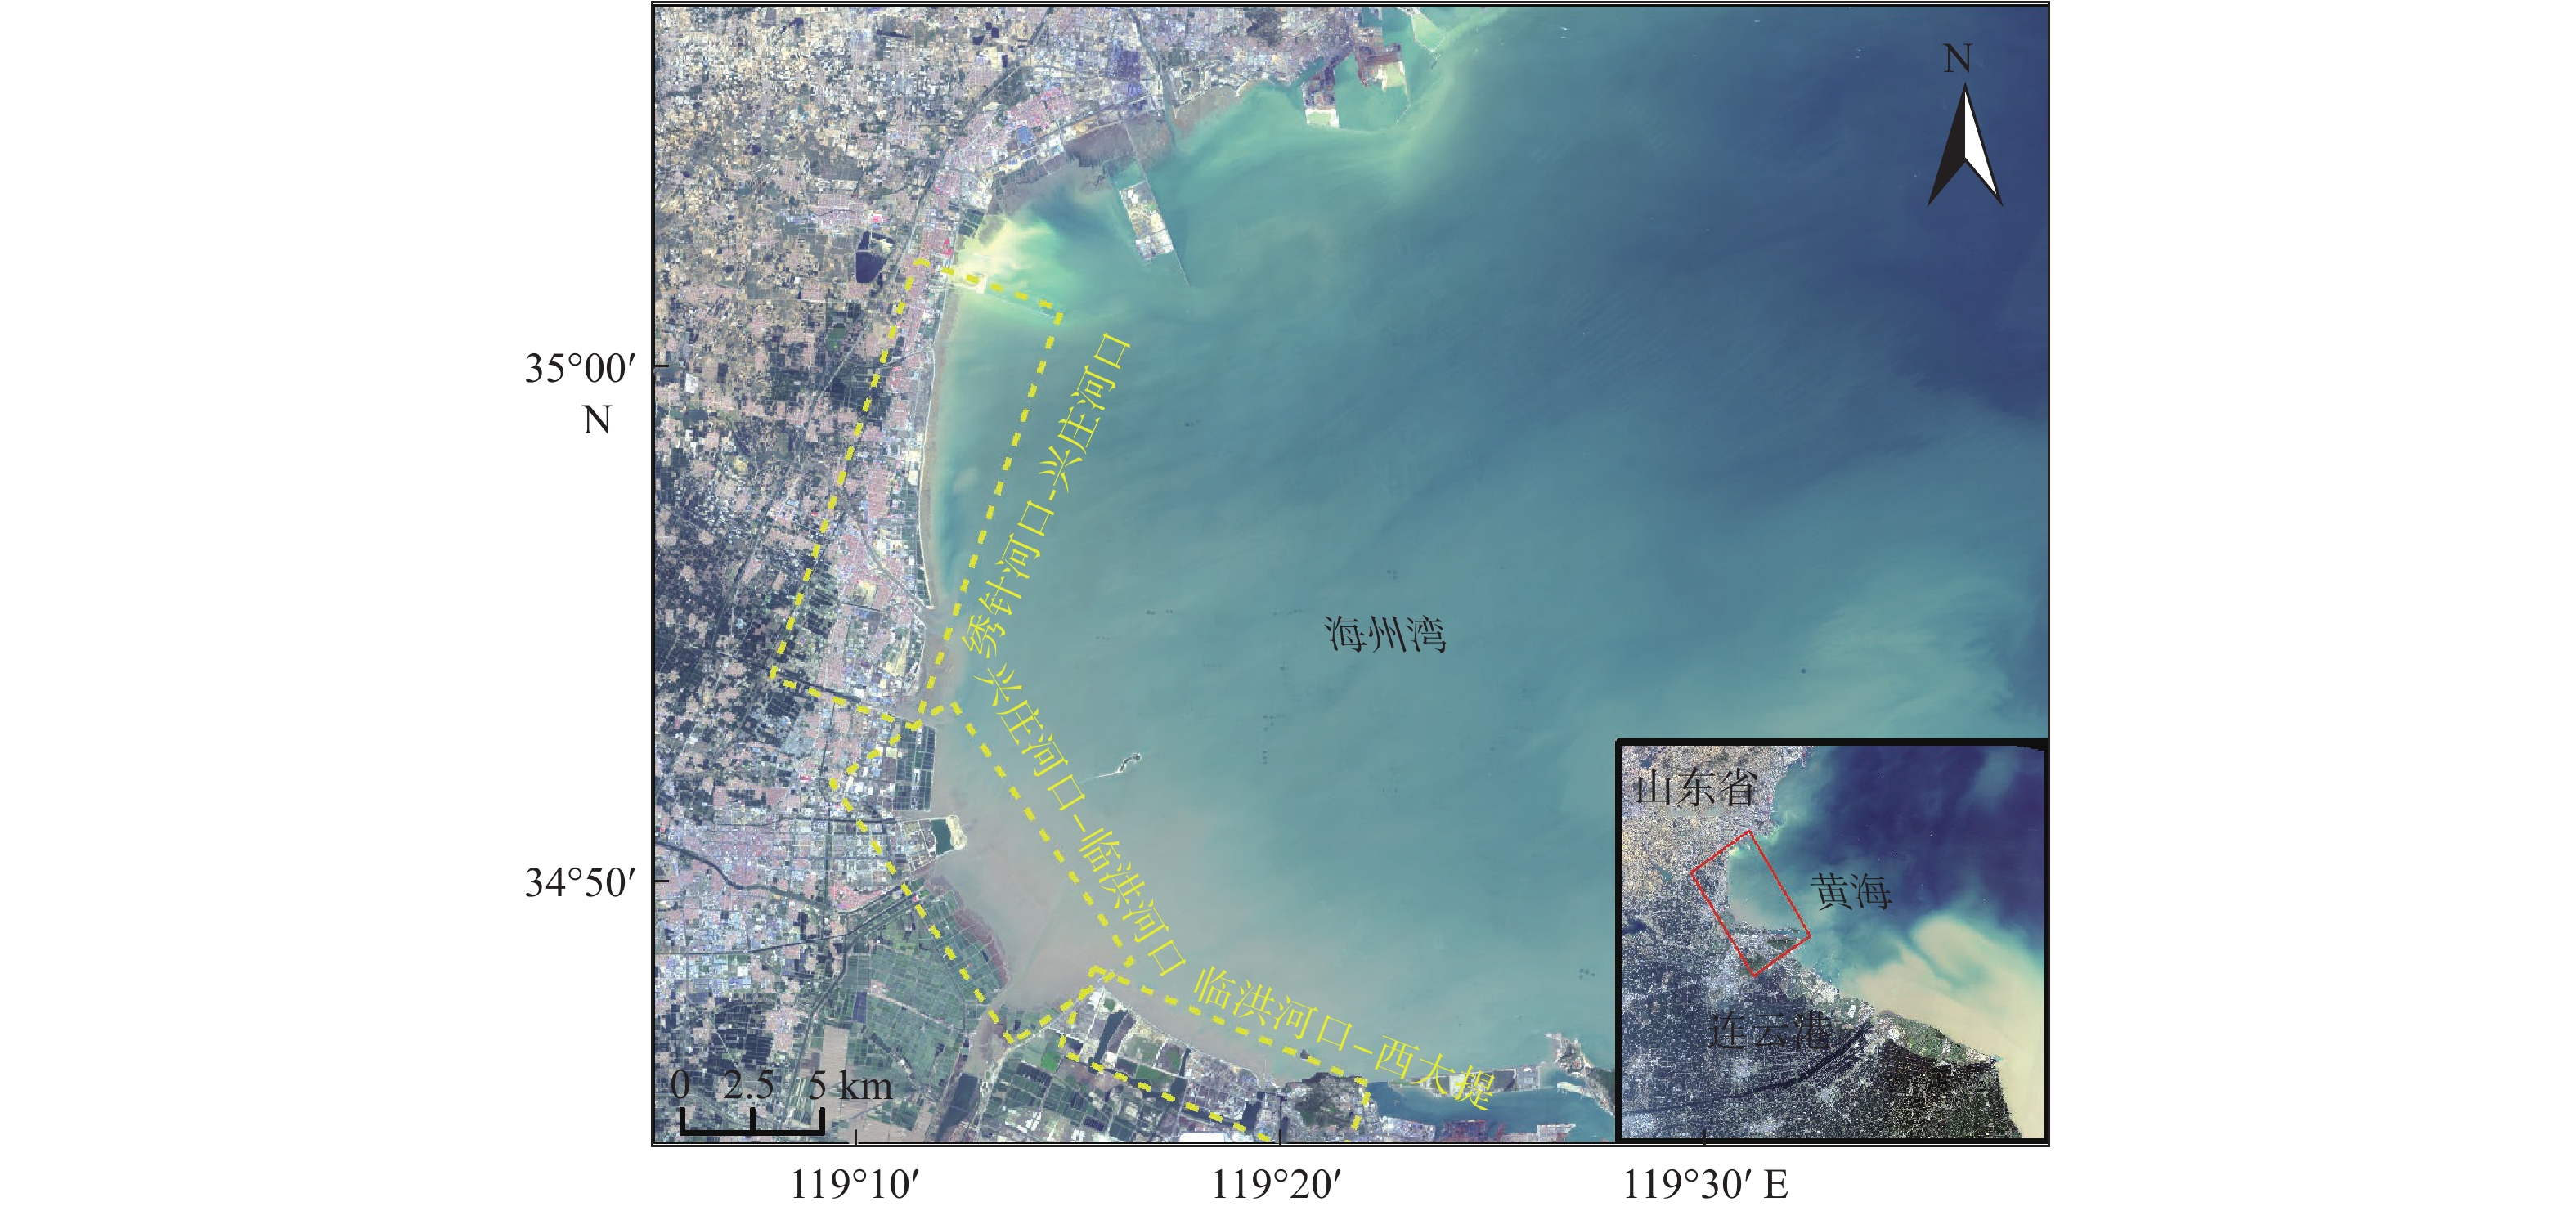
基于2013—2021年间海州湾18期Lansat 8遥感影像,利用海岸线类型多样性指数、岸线变化率(EPR)和净海岸移动量(NSM)对海州湾各类型岸线蚀淤演变情况进行分析,并基于Prophet时间序列预测模型对2025年岸线进行定量预测。结果表明,9年间基岩岸线整体较稳定;琴岛栈桥到临洪河口淤泥质岸线不稳定,岸线明显向海淤积;砂质岸线整体较稳定,无明显蚀淤倾向。预测2025年海州湾淤泥质岸线呈向海延伸趋势,临洪河口附近岸线呈向海延伸趋势,其余岸线均无明显淤蚀变化,较为稳定。
Abstract:The Lansat 8 remote sensing images of Haizhou Bay, Jiangsu, East China, in nine years from 2013 to 2021 were selected to analyze the evolution of erosion and siltation of various types of coastlines in Haizhou Bay in terms of the diversity index of coastline types, shoreline change rate (EPR), and net coastal movement (NSM) of coastline changes in the nine years, and qualitatively predict the coastline of 2025 based on the Prophet model. Results show that the bedrock shoreline was relatively stable as a whole in the past nine years, the muddy shoreline from Qindao pier to Linhong River mouth was unstable with obvious oceanward siltation, and the sandy shoreline was relatively stable as a whole with no obvious erosion and siltation tendency. It is predicted that in 2025, the muddy shoreline of Haizhou Bay and the shoreline in Linhong River mouth will extend seaward, and the remaining shorelines will be relatively stable without obvious siltation and erosion changes.
-
Key words:
- Haizhou Bay /
- remote sensing /
- coastline /
- EPR /
- NSM /
- Prophet model
-

-
表 1 2020年研究区平均大潮高潮位统计
Table 1. Statistics of average spring tide level in the study area in 2020
/m 回归月 大潮平均值1 大潮平均值2 大潮平均值3 大潮平均值4 大潮平均值5 大潮平均值6 大潮平均值7 大潮平均值8 大潮平均值9 大潮平均值10 大潮平均值11 大潮平均值12 每月总
平均值1 5.20 5.07 5.16 4.98 5.18 4.99 5.06 4.80 5.10 4.84 4.92 4.59 4.99 2 5.38 5.27 5.34 5.22 5.35 5.14 5.22 5.03 5.23 4.92 5.02 4.78 5.16 3 5.54 5.47 5.47 5.41 5.51 5.32 5.32 5.21 5.39 5.06 5.07 4.94 5.31 4 5.59 5.46 5.59 5.62 5.50 5.21 5.50 5.51 5.32 4.86 5.31 5.32 5.40 5 5.51 5.63 5.41 5.54 5.53 5.52 5.23 5.38 5.48 5.30 5.00 5.18 5.39 6 5.35 5.58 5.28 5.53 5.37 5.49 5.17 5.42 5.35 5.31 5.01 5.27 5.34 7 5.60 5.36 5.59 5.37 5.56 5.24 5.54 5.26 5.48 5.09 5.44 5.11 5.39 8 5.77 5.61 5.74 5.63 5.73 5.46 5.65 5.49 5.62 5.24 5.48 5.29 5.56 9 5.82 5.78 5.77 5.76 5.79 5.61 5.62 5.59 5.68 5.34 5.38 5.33 5.62 10 5.72 5.76 5.65 5.71 5.71 5.60 5.47 5.52 5.61 5.32 5.21 5.26 5.55 11 5.47 5.57 5.40 5.52 5.46 5.41 5.25 5.35 5.37 5.15 5.02 5.13 5.34 12 5.13 5.27 5.12 5.29 5.10 5.12 5.05 5.19 5.02 4.89 4.92 5.03 5.09  下载: 导出CSV
表 2 2020年潮位数据
Table 2. The tide level data of 2020
连云港潮位站 2020年2月4日 2020年4月24日 潮时 02:36:54 02:36:22 潮高/m 3.77 1.13
下载: 导出CSV
表 3 模型预测精度评价
Table 3. The evaluation on the model prediction accuracy
砂质岸线 河口岸线 淤泥质岸线 临洪河河口岸线 基岩岸线 总岸线 平面位置精度/m 45.26 30.50 50.05 151.67 59.12 32.51 长度误差/% 7.38 4.32 21.45 12.58 18.80 1.36 模型预测精度/% 68.63 54.55 60.19 50.00 48.21 63.86
下载: 导出CSV
-
[1] 王颖,季小梅. 中国海陆过渡带:海岸海洋环境特征与变化研究[J]. 地理科学,2011,31(2):129-135.
[2] SHEIK M. A shoreline change analysis along the coast between Kanyakumari and Tuticorin,India,using digital shoreline analysis system[J]. 地球空间信息科学学报(英文),2011,14(4):282-293.
[3] 巢子豪,高一博,谢宏全,等. 1984—2012年海州湾海岸线时空演变研究[J]. 海洋科学,2016,6:95-100. doi: 10.11759/hykx20151218001
[4] 沈昆明,李安龙,蒋玉波,等. 基于数字岸线分析系统的海岸线时空变化速率分析:以海州湾为例[J]. 海洋学报,2020,42(5):5-11.
[5] 王奎峰,李念春,王薇. 黄河三角洲多年海岸线动态变迁特征及演化规律[J]. 应用海洋学学报,2018,37(3):330-338. doi: 10.3969/J.ISSN.2095-4972.2018.03.004
[6] 王厚军,袁广军,刘亮,等. 海岸线分类及划定方法研究[J]. 海洋环境科学,2021,40(3):430-434. doi: 10.12111/j.mes.20200109
[7] 国家海洋局908专项办公室. 我国近海海洋综合调查与评价专项技术规程[M]. 北京: 海洋出版社, 2006.
[8] 常军,刘高焕,刘庆生. 黄河口海岸线演变时空特征及其与黄河来水来沙关系[J]. 地理研究,2004,23(3):339-346. doi: 10.3321/j.issn:1000-0585.2004.03.007
[9] 张林鹏,于婉,张子莺,等. 基于MNDWI/LSMM/K-T变换的淮河流域面状水体提取的比较研究:以南湾水库为例[J]. 北方环境,2020,32(10):142-144,146.
[10] 孙佩,汪权方,张梦茹,等. 基于NDVI-MNDWI特征空间的水体信息增强方法研究[J]. 湖北大学学报(自然科学版),2018,40(6):574-579. doi: 10.3969/j.issn.1000-2375.2018.06.005
[11] 李明,郑小慎. 二次改进归一化差异水体指数(SMNDWI)提取海岸线的研究[J]. 海洋通报(英文版),2016,18(2):15-27.
[12] 鞠超. 基于面向对象的高分一号遥感图像海岸线自动提取研究[D]. 阜新: 辽宁工程技术大学, 2017.
[13] 祝琳,褚忠信,沈昆明,等. 黄河三角洲近期海岸线演变与预测[J]. 海洋地质前沿,2022,38(8):20-27. doi: 10.16028/j.1009-2722.2021.080
[14] NASSAR K,FATH H,MAHMOD W E,et al. Automatic detection of shoreline change:case of North Sinai coast,Egypt[J]. Journal of Coastal Conservation,2018,22:1057-1083. doi: 10.1007/s11852-018-0613-1
[15] 李帅,汤振权,匡亚红. 湖北省近50年来的气温和降水变化趋势分析[J]. 安徽农业科学,2009,37(4):1652-1655. doi: 10.3969/j.issn.0517-6611.2009.04.108
[16] TAYLOR J S,LETHAM B. Forecasting at scale[J]. The American Statistician,2018,72(1):37-45. doi: 10.1080/00031305.2017.1380080
[17] 许浩然,陈中举,杨兆前,等. 基于Prophet模型的湖北省月降水量预测[J]. 节水灌溉,2022,2:7-12,20. doi: 10.3969/j.issn.1007-4929.2022.02.002
[18] 沈昆明,李安龙,蒋玉波,等. 基于数字岸线分析系统的海岸线时空变化速率分析:以海州湾为例[J]. 海洋学报(中文版),2020,42(5):117-127.
-

图(9)
表(3)
计量
- 文章访问数: 557
- PDF下载数: 75
- 施引文献: 0