

Changes in heavy metal content and their potential ecological risk in the surface sediments of Lingding Bay from 2010 to 2020
-
摘要:
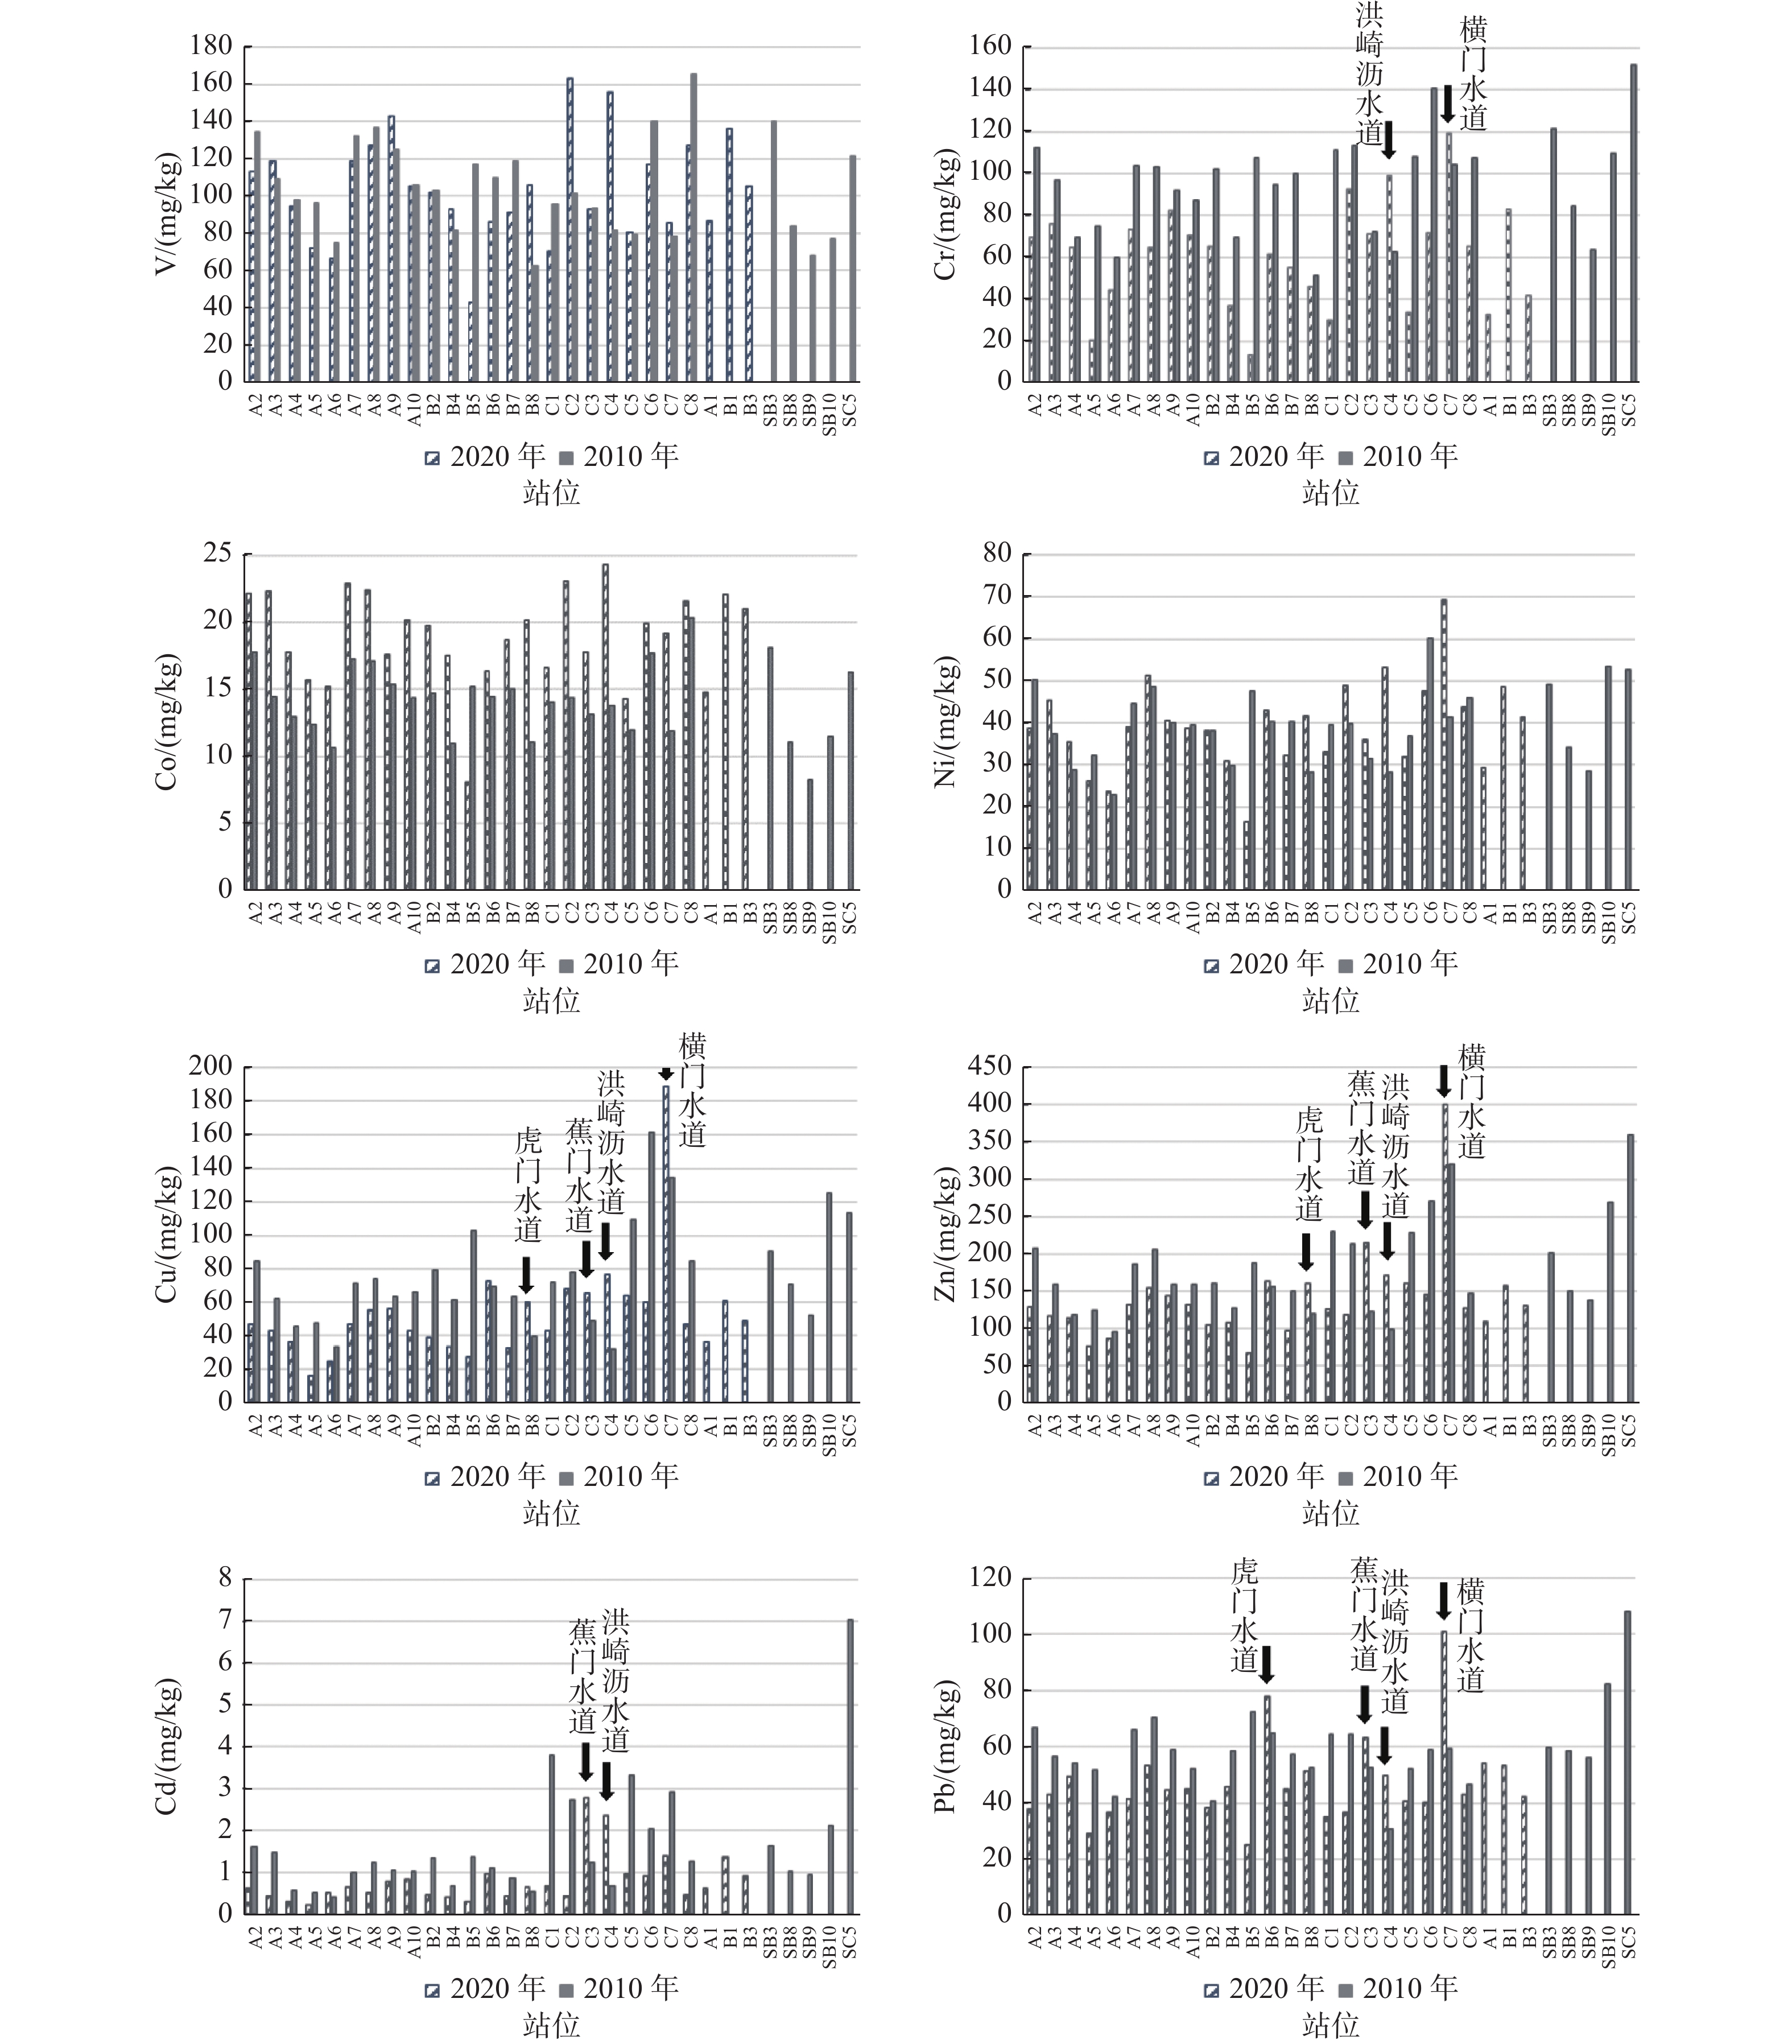
珠江口是中国重金属污染最严重的河口之一,为了解该河口区近十余年来的重金属污染变化状况,分别于2010和2020年在污染物最易聚集的伶仃洋海域开展了表层沉积物调查取样工作,并使用ICP-MS方法测试了所有样本的V、Cr、Co、Ni、Cu、Zn、Cd、Pb等重金属含量。结果显示,2020年所取沉积物中Cd、Cr、Cu、Zn和Pb的平均含量都比2010年样本的含量显著降低,V和Ni的变化甚微,Co的含量则明显上升。富集系数法和潜在生态危害指数法的评价结果也反映出2020年沉积物中Cd、Cu、Pb、Zn以及Cr的富集程度及潜在生态危害总体上较10年前都有不同程度的缓解,但仍有超过50%的样本中Cd呈现中度—显著富集。V和Ni在2个时期的沉积物中均为轻微富集或基本无富集,但2020年属轻微富集的比例相比2010年有所增加。Co的富集程度及潜在生态危害较2010年加剧,但尚属轻微级。空间上看,伶仃洋4大口门水道,尤其是洪奇沥和蕉门水道,仍为珠江口重金属污染的重灾区,其中,Cd依然是富集程度最高、受人为影响最大且潜在生态风险最强的重金属,其次是Cu和Pb。
Abstract:The Pearl River estuary (PRE) is one of the estuaries with the most serious heavy metal pollution in China. To understand the changes of heavy metal pollution in this area in the last 10 years, sampling at surface sediments was carried out in 2010 and 2020 at nearly the same locations and quantities in the Lingding Bay area, where pollutants were most likely to accumulate. In addition, the contents of heavy metals (V, Cr, Co, Ni, Cu, Zn, Cd, and Pb) in all the samples were measured by using ICP-MS. Results show that the average contents of Cd, Cr, Cu, Zn, and Pb in the sediment samples collected in 2020 significantly decreased than those of 2010, except for V and Ni whose contents changed slightly, and Co increased significantly. The evaluation results of the enrichment factor method and potential ecological risk index method reflected that the enrichment degree and potential ecological risk of Cd, Cu, Pb, Zn, and Cr in surface sediment of 2020 have been alleviated to varying degrees compared to that 10 years ago. Cd was in moderate to significant enrichment in over half of the samples. V and Ni were not or slightly enriched in both time periods, but the proportion of slight enrichment in 2020 increased compared to 2010. The enrichment degree and potential ecological risk of Co increased compared to 2010, but it was still at a low level. From a spatial perspective, the four major waterways in Lingding Bay, especially the Hongqili and Jiaomen Waterways, were still the places with the most severe heavy metal pollution in PRE. Among the 8 heavy metals in concentration, Cd concentration was the highest, the greatest human impact and the strongest potential ecological risk, followed by Cu and Pb.
-
Key words:
- Pearl River Estuary /
- Lingding Bay /
- surface sediment /
- heavy metal /
- potential ecological risk
-

-
表 1 伶仃洋表层沉积物重金属含量对比
Table 1. Comparison of heavy metal content in the surface sediments of Lingding Bay
V Cr Co Ni Cu Zn Cd Pb 2010年
(n=28)最大值/(mg/kg) 165.52 151.83 20.36 60.07 161.31 360.06 7.04 108.13 最小值/(mg/kg) 62.24 51.6 8.21 22.82 32.38 96.04 0.40 30.52 平均值/(mg/kg) 104.68 95.56 14.14 39.65 76.23 180.79 1.62 59.25 变异系数 0.25 0.25 0.20 0.23 0.41 0.36 0.84 0.24 2020年
(n=26)最大值/(mg/kg) 163.00 119.00 24.30 69.20 189.00 401.00 2.77 101.00 最小值/(mg/kg) 42.80 13.30 8.04 16.50 16.30 66.90 0.23 25.00 平均值/(mg/kg) 103.87 60.94 18.91 39.41 53.44 140.03 0.81 47.05 变异系数 0.27 0.41 0.19 0.27 0.59 0.44 0.74 0.32 2020年较2010年平均变幅/% 0.77↓ 36.23↓ 33.72↑ 0.61↓ 29.89↓ 22.54↓ 50.30↓ 20.59↓  下载: 导出CSV
表 2 伶仃洋表层沉积物质量等级
Table 2. Classification in surface sediment quality in Lingding Bay
年份 沉积物
质量标准各等级样本占比/% Cr Cu Zn Cd Pb 2010 一类 28.57 7.14 39.29 3.57 67.86 二类 67.86 71.43 57.14 64.29 32.14 三类 3.57 21.43 3.57 32.14 0.00 2020 一类 80.77 19.23 69.23 38.46 88.46 二类 19.23 76.92 26.92 53.85 11.54 三类 0.00 3.85 3.85 7.69 0.00
下载: 导出CSV
表 3 伶仃洋表层沉积物中重金属富集系数统计结果
Table 3. Statistics of enrichment factors of heavy metals in surface sediments of Lingding Bay
富集系数(EF) 富集程度/
受人为影响程度各等级样本占比/% V Cr Co Ni Cu Zn Cd Pb 2020年 ≤1 无 46.15 80.77 7.69 11.54 7.69 15.38 7.69 0.00 1~2 轻微 53.85 19.23 92.31 84.62 61.54 76.92 38.46 88.46 2~5 中度 0.00 0.00 0.00 3.85 26.92 7.69 42.31 11.54 5~20 显著 0.00 0.00 0.00 0.00 3.85 0.00 11.54 0.00 2010年 ≤1 无 67.86 67.86 75.00 28.57 0.00 7.14 0.00 0.00 1~2 轻微 32.14 32.14 25.00 71.43 50.00 67.86 14.29 75.00 2~5 中度 0.00 0.00 0.00 0.00 50.00 25.00 57.14 25.00 5~20 显著 0.00 0.00 0.00 0.00 0.00 0.00 28.57 0.00
下载: 导出CSV
表 4 伶仃洋表层沉积物潜在生态危害系数
$ E_{r}^{i} $ 和潜在生态危害指数RI统计Table 4. Statistics of potential ecological risk factor
$ E_{r}^{i} $ and potential ecological risk index RI
RI V Cr Co Ni Cu Zn Cd Pb 2020年
(n=26)最大值 3.41 3.22 9.27 12.10 33.23 4.24 296.79 17.77 338.56 最小值 0.90 0.36 3.07 2.89 2.87 0.71 24.54 4.40 45.93 平均值 2.18 1.65 7.22 6.89 9.39 1.48 86.39 8.28 123.47 2010年
(n=28)最大值 3.47 4.11 7.77 10.50 28.36 3.81 754.18 19.03 818.98 最小值 1.30 1.40 3.14 3.99 5.69 1.02 42.75 5.37 68.26 平均值 2.19 2.59 5.40 6.93 13.40 1.91 173.82 10.43 216.67 2020较2010年变幅/% 0.46↓ 36.29↓ 33.70↑ 0.58↓ 29.93↓ 22.51↓ 50.30↓ 20.61↓ 43.01↓
下载: 导出CSV
表 5 伶仃洋表层沉积物中元素间的相关性
Table 5. Correlation among all the elements in surface sediments of Lingding Bay
Fe Mn V Cr Co Ni Cu Zn Cd Pb 2010年(n=28) Fe 1 Mn 0.713** 1 V 0.970** 0.753** 1 Cr 0.562** 0.781** 0.624** 1 Co 0.931** 0.799** 0.959** 0.649** 1 Ni 0.692** 0.676** 0.691** 0.898** 0.698** 1 Cu 0.295 0.480** 0.312 0.816** 0.326 0.816** 1 Zn 0.196 0.579** 0.218 0.839** 0.265 0.745** 0.859** 1 Cd 0.046 0.593** 0.105 0.726** 0.18 0.473* 0.570** 0.847** 1 Pb 0.248 0.381* 0.232 0.638** 0.191 0.622** 0.497** 0.729** 0.689** 1 2020年(n=26) Fe 1 Mn 0.653** 1 V 0.971** 0.630** 1 Cr 0.713** 0.637** 0.699** 1 Co 0.853** 0.661** 0.840** 0.698** 1 Ni 0.691** 0.669** 0.640** 0.861** 0.718** 1 Cu 0.245 0.479* 0.181 0.684** 0.237 0.798** 1 Zn 0.191 0.472* 0.109 0.639** 0.223 0.751** 0.964** 1 Cd 0.229 0.651** 0.23 0.456* 0.219 0.394* 0.481* 0.575** 1 Pb 0.148 0.331 0.041 0.551** 0.149 0.650** 0.821** 0.865** 0.479* 1 注:**表示相关性在0.01水平上显著(双尾);*表示相关性在0.05水平上显著(双尾)。
下载: 导出CSV
-
[1] 高斌,曹珂,印萍,等. 近10年三门湾海域表层沉积物重金属含量变化及来源解析[J]. 海洋地质前沿,2023,39(3):51-60.
[2] 胡睿,窦衍光,邹亮,等. 胶州湾海域表层沉积物重金属元素分布特征与风险评价[J]. 海洋地质前沿,2021,37(11):11-21.
[3] 雷雁翔,张斌,吴治国,等. 长岛北部海域表层沉积物重金属分布特征与风险评价及来源分析[J]. 海洋地质前沿,2023,39(3):40-50.
[4] 阎琨,庞国涛,邢新丽,等. 广西钦州湾表层沉积物中重金属的分布、来源及污染评价[J]. 海洋环境科学,2023,42(2):237-245. doi: 10.12111/j.mes.2022-x-0109
[5] 闫兴国,袁庆政,赵明杰,等. 广东吴川市近岸海域表层沉积物重金属分布特征与污染评价[J]. 海洋地质前沿,2022,38(11):82-90.
[6] 义家吉,颜历,王洋,等. 粤东近岸海域表层沉积物重金属污染评价及来源解析[J]. 海洋环境科学,2023,42(2):200-208,216. doi: 10.12111/j.mes.2022-x-0165
[7] 黄镇国,李平日,张仲英. 珠江三角洲形成发育演变[M]. 广州:科学普及出版社广州分社,1982.
[8] 李文胜,窦磊,刘子宁. 珠江三角洲平原区第四纪沉积物地球化学特征及其控制因素[J]. 华南地质与矿产,2016,32(1):68-77.
[9] 汝旋. 人类活动对河流表层沉积物中重金属分布区域差异性的影响评估:以西江为例[D]. 广州:华南理工大学,2018.
[10] WU W H,QU S Y,NEL W,et al. Tracing and quantifying the sources of heavy metals in the upper and middle reaches of the Pearl River Basin:new insights from Sr-Nd-Pb multi-isotopic systems[J]. Chemosphere,2022,288:132630. doi: 10.1016/j.chemosphere.2021.132630
[11] 蓝先洪. 珠江口表层沉积物的地球化学特征[J]. 海洋湖沼通报,1989,4:53-61.
[12] 阳金希,张彦峰,祝凌燕. 中国七大水系沉积物中典型重金属生态风险评估[J]. 环境科学研究,2017,30(3):423-432.
[13] 柯东胜. 珠江口海区表层沉积物中重金属的含量分布及其与环境因素的关系[J]. 海洋学报,1985,7(5):641-645.
[14] 温伟英,何悦强. 珠江口海岸带底质污染现状分析[C]//珠江口海岸带和海涂资源综合调查研究文集(二). 广州:广东科技出版社,1985.
[15] 邱礼生. 珠江口海区表层沉积物中重金属的分布模式[J]. 海洋通报,1989,8(1):36-43.
[16] 刘芳文,颜文,黄小平,等. 珠江口沉积物中重金属及其相态分布特征[J]. 热带海洋学报,2003,22(5):16-24. doi: 10.3969/j.issn.1009-5470.2003.05.003
[17] 甘华阳,梁开,郑志昌. 珠江口表层沉积物中微量元素地球化学[J]. 海洋地质与第四纪地质,2010,30(4):131-139.
[18] 王增焕,林钦,李纯厚,等. 珠江口表层沉积物铜铅锌镉的分布与评价[J]. 环境科学研究,2004,17(4):5-9,24. doi: 10.3321/j.issn:1001-6929.2004.04.002
[19] 马玉,李团结,王迪,等. 珠江口滨海湿地沉积物重金属污染现状及潜在生态危害[J]. 热带地理,2011,31(4):353-356. doi: 10.3969/j.issn.1001-5221.2011.04.003
[20] 陈康,方展强,安东,等. 珠江口沿岸水域表层沉积物中重金属含量分布及污染评价[J]. 应用海洋学学报,2013,32(1):20-28.
[21] 王建华,黄楚光,倪志鑫,等. 珠江口伶仃洋沉积物中重金属元素分布、赋存形态及来源分析[J]. 海洋通报,2014,33(3):259-267. doi: 10.11840/j.issn.1001-6392.2014.03.003
[22] 倪志鑫,张霞,蔡伟叙,等. 珠江口沉积物中重金属分布、形态特征及风险分析[J]. 海洋环境科学,2016,35(3):321-328.
[23] 刘解答,郭亮,柯志新. 珠江口表层沉积物中重金属污染及生态风险评价[J]. 水生态学杂志,2017,38(1):46-53.
[24] XIAO H,SHAHAB A,YE F,et al. Source-specific ecological risk assessment and quantitative source apportionment of heavy metals in surface sediments of Pearl River Estuary,China[J]. Marine Pollution Bulletin,2022,179:113726. doi: 10.1016/j.marpolbul.2022.113726
[25] 徐方建,闫慧梅,田旭,等. 海南岛东部陆架表层沉积物重金属污染评价[J]. 中国环境科学,2016,36(5):1530-1539. doi: 10.3969/j.issn.1000-6923.2016.05.036
[26] ZOLLER W H,GLADNEY E S,DUCE R A. Atmospheric concentrations and sources of trace metals at the South pole[J]. Science,1974,183(4121):198-200. doi: 10.1126/science.183.4121.198
[27] HAKANSON L. An ecological risk index for aquatic pollution control. a sedimentological approach[J]. Water Research,1980,14(8):975-1001. doi: 10.1016/0043-1354(80)90143-8
[28] 徐争启,倪师军,庹先国,等. 潜在生态危害指数法评价中重金属毒性系数计算[J]. 环境科学与技术,2008,31(2):112-115. doi: 10.3969/j.issn.1003-6504.2008.02.030
[29] 付淑清,韦振权,袁少雄,等. 珠江口沉积物与土壤的重金属特征及潜在生态危害评价[J]. 安全与环境学报,2019,19(2):600-606.
[30] 张秀芝,鲍征宇,唐俊红. 富集因子在环境地球化学重金属污染评价中的应用[J]. 地质科技情报,2006,25(1):65-72.
[31] SUTHERLAND R A. Bed sediment-associated trace metals in an urban stream,Oahu,Hawaii[J]. Environmental Geology,2000,39(6):611-627. doi: 10.1007/s002540050473
[32] BLASER P,ZIMMERMANN S,LUSTER J,et al. Critical examination of trace element enrichments and depletions in soils:As,Cr,Cu,Ni,Pb,and Zn in Swiss forest soils[J]. Science of the Total Environment,2000,249(1/2/3):257-280.
[33] 广东省海洋与渔业厅. 广东省海洋环境状况公报[R].广州:广东省海洋与渔业厅, 2002-2017.
[34] 陈耀泰. 珠江口沉积分区[J]. 中山大学学报(自然科学版),1995,34(3):109-114.
[35] 闻平,刘沛然,雷亚平,等. 近 50 年伶仃洋滩槽冲淤变化趋势分析[J]. 中山大学学报(自然科学版),2003,42(增刊2):240-243.
[36] IP C C M,LI X D,ZHANG G,et al. Over one hundred years of trace metal fluxes in the sediments of the Pearl River Estuary,South China[J]. Environmental Pollution,2004,132(1):157-172. doi: 10.1016/j.envpol.2004.03.028
[37] 刘志勇,潘少明,程功弼,等. 珠江口沉积物(210)Pb分布特征及环境意义[J]. 沉积学报,2010,28(1):166-175.
[38] 王爱军,叶翔,李团结,等. 近百年来珠江口淇澳岛滨海湿地沉积物重金属累积及生态危害评价[J]. 环境科学,2011,32(5):1306-1314.
[39] 唐诚,赵艳,张华,等. 珠江口近30年海底表层沉积物粒度分布及其环境变化[J]. 海洋科学,2013,37(5):61-70.
[40] 陈斌,尹晓娜,姜广甲,等. 珠江口外陆架海域表层沉积物重金属潜在生态风险评价及来源分析[J]. 应用海洋学学报,2021,40(3):520-528.
[41] 黄楚光,王建华,曹玲珑,等. 珠江口外内陆架表层沉积物重金属元素形态特征、控制因素及生态风险分析[J]. 海洋湖沼通报,2014,3:175-185.
[42] 东省土壤普查办公室编著. 广东土壤[M]. 北京:科学出版社,1993.
[43] 张甘霖,龚子同. 淹水条件下土壤中元素迁移的地球化学特征[J]. 土壤学报,1993,30(4):355-365.
[44] 张亚宁,朱维晃,董颖,等. 氧化还原和微生物作用对沉积物中重金属迁移转化的影响[J]. 环境工程,2023,41(6):101-108.
[45] 范成新,刘敏,王圣瑞,等. 近20年来我国沉积物环境与污染控制研究进展与展望[J]. 地球科学进展,2021,36(4):346-374.
[46] 中华人民共和国生态环境部. 中国海洋生态环境状况公报[R].北京:中华人民共和国生态环境部,2001-2021.
[47] 陶平,邵秘华,鲍永恩,等. 海洋地球化学[M]. 北京:科学出版社,2020.
-
图(3)
表(5)
计量
- 文章访问数: 648
- PDF下载数: 66
- 施引文献: 0