

Changes in vegetation front and evolution trend of landscape pattern of tidal salt marsh wetland in Yancheng in recent 40 years
-
摘要:
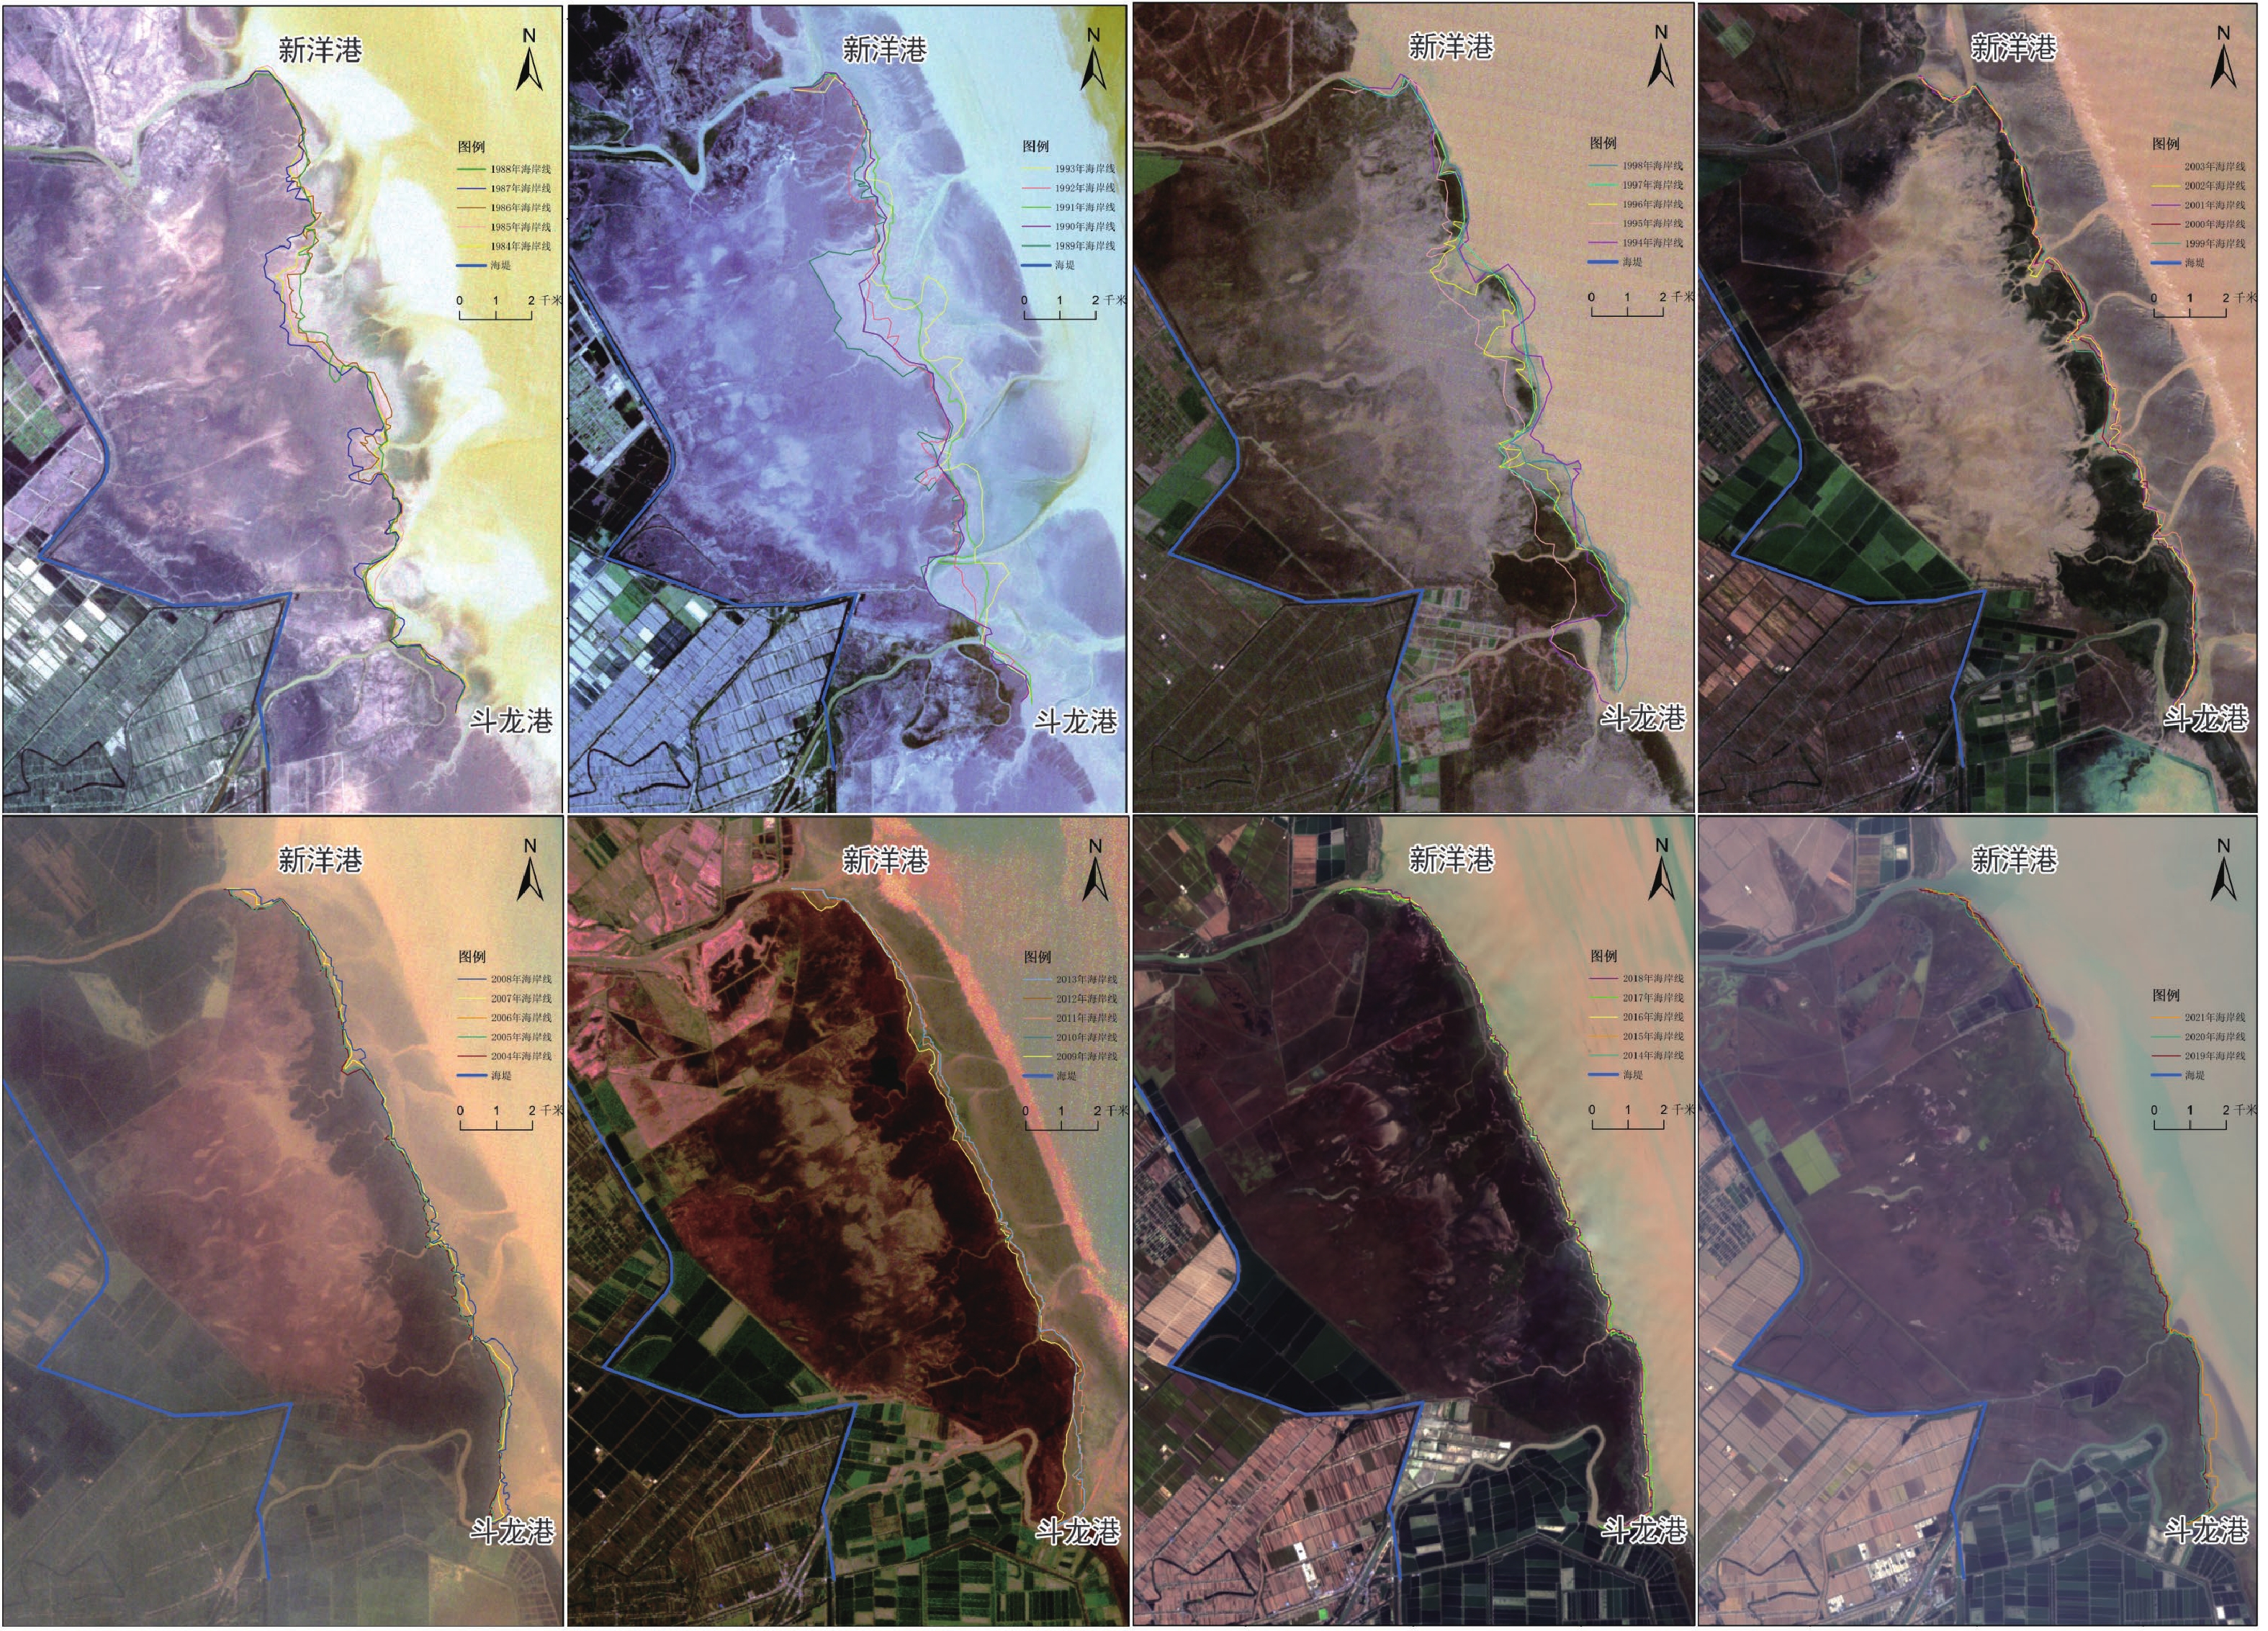
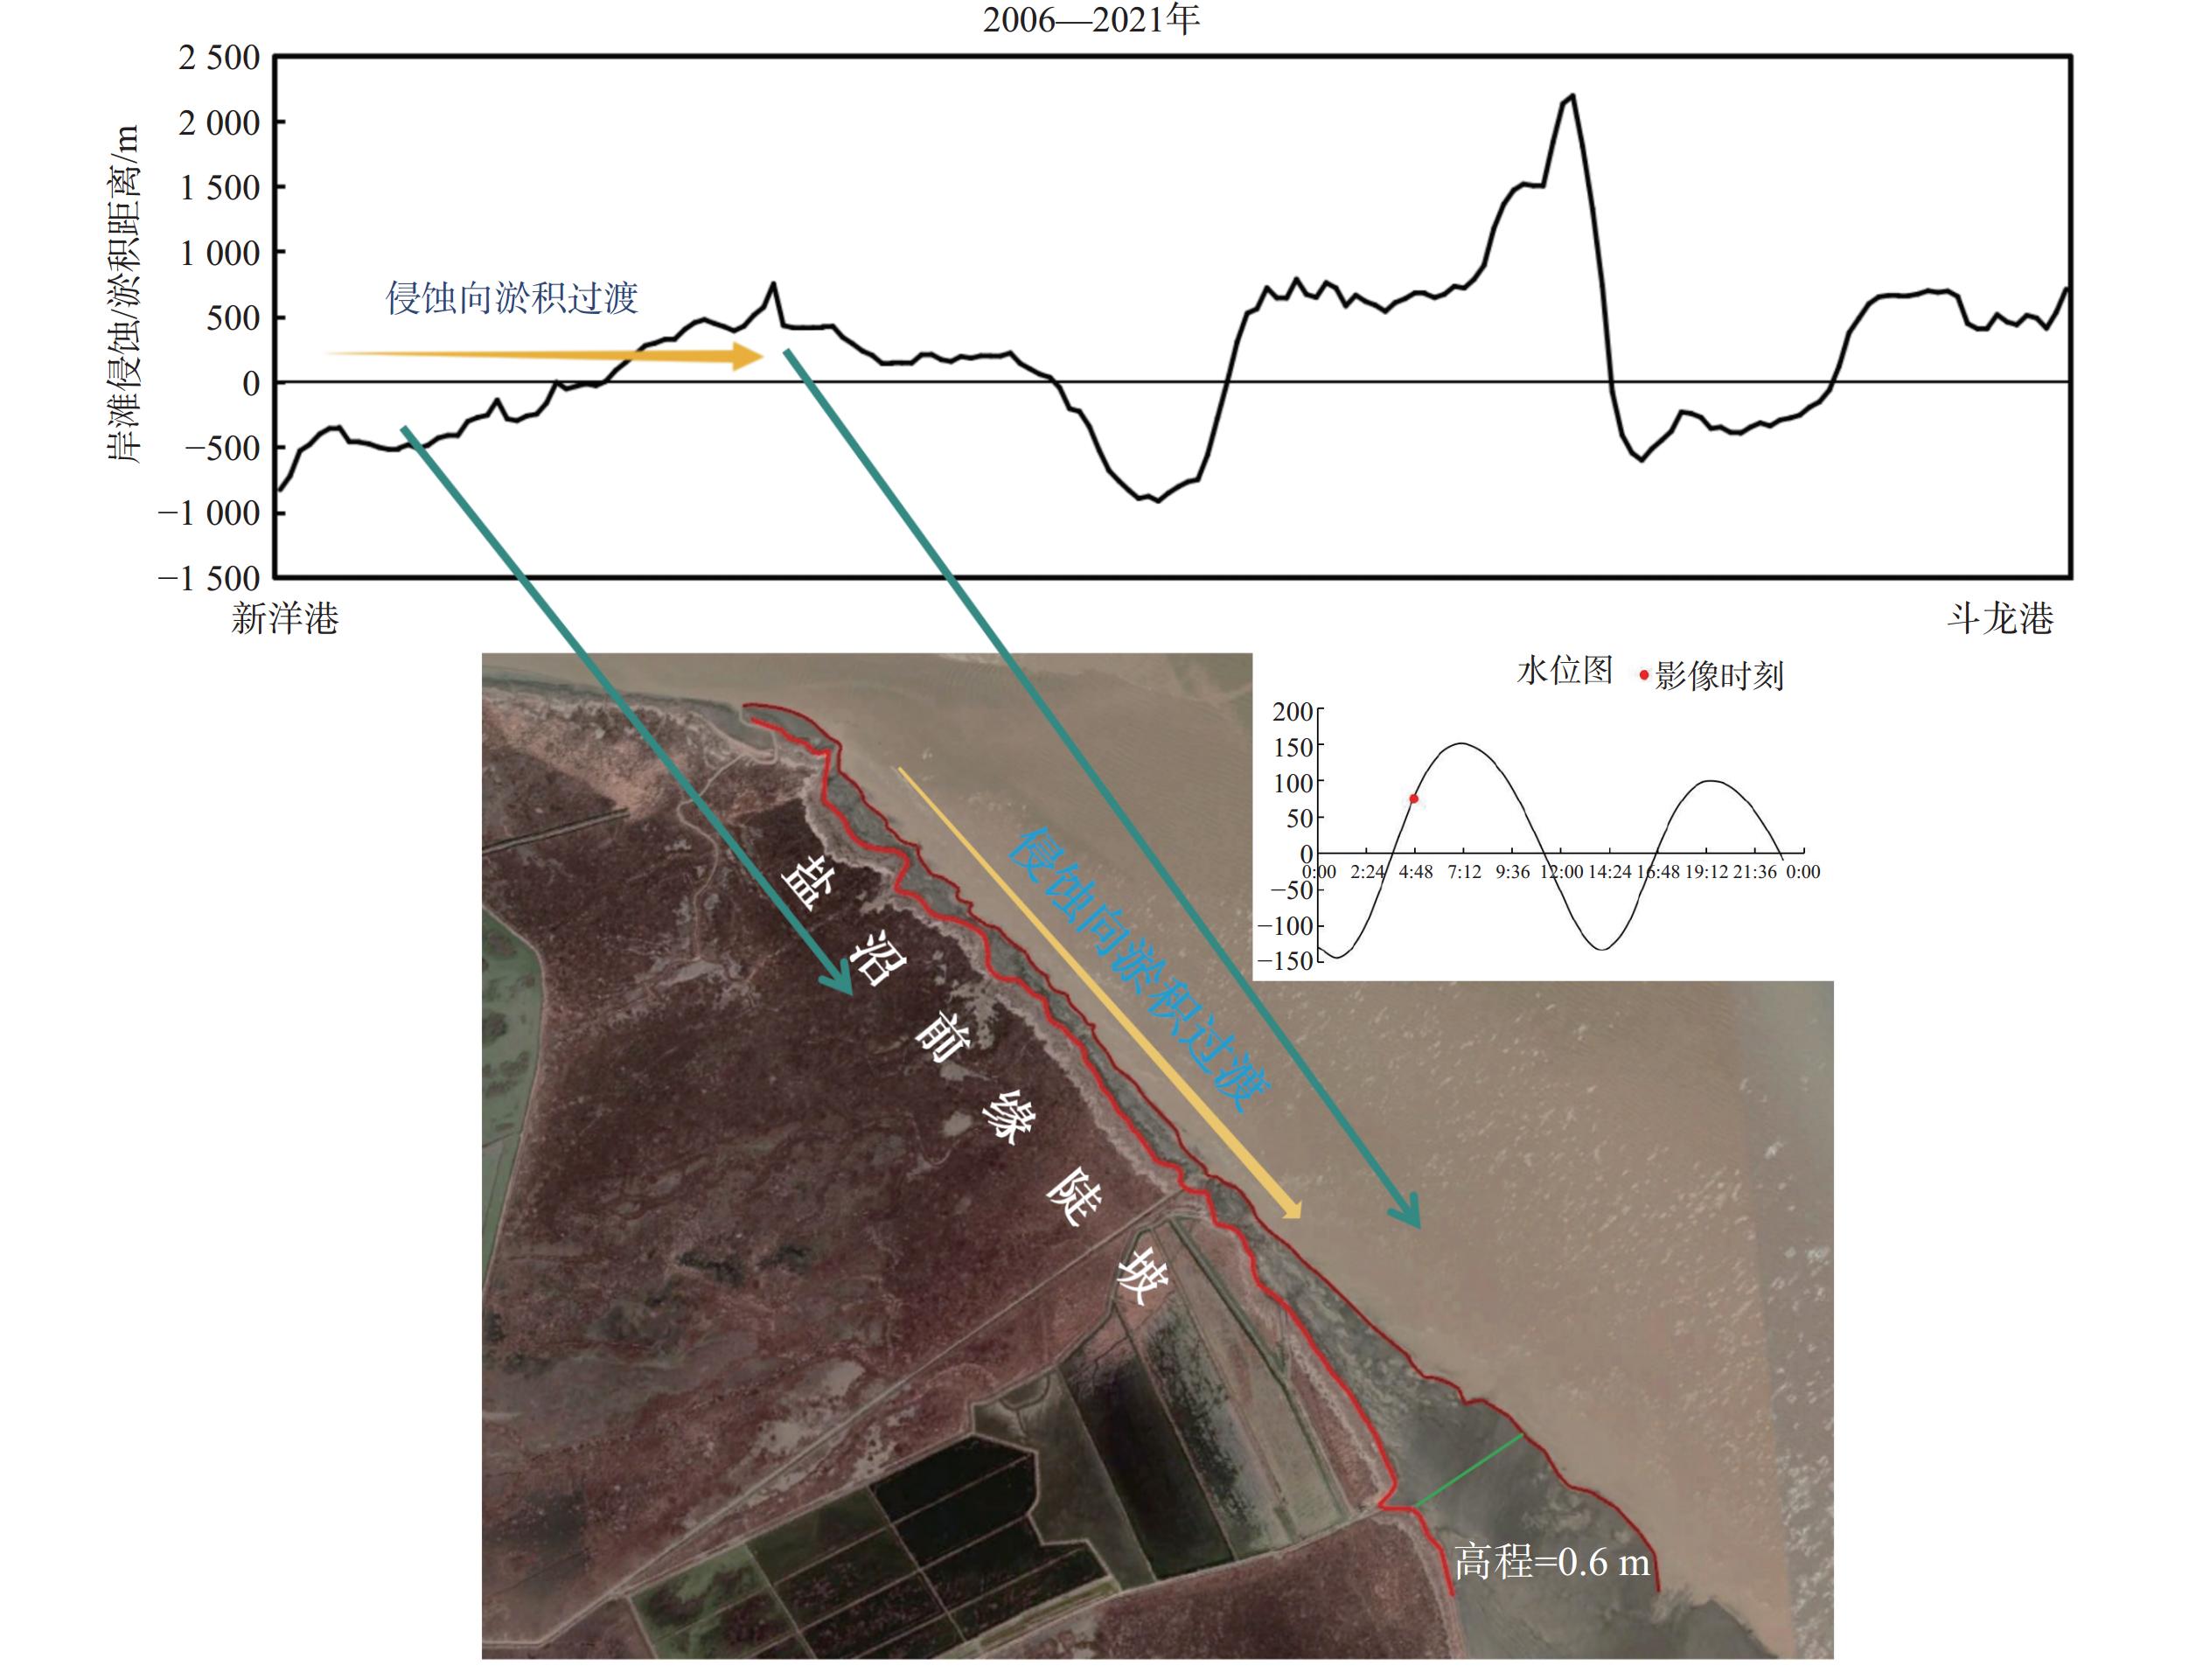
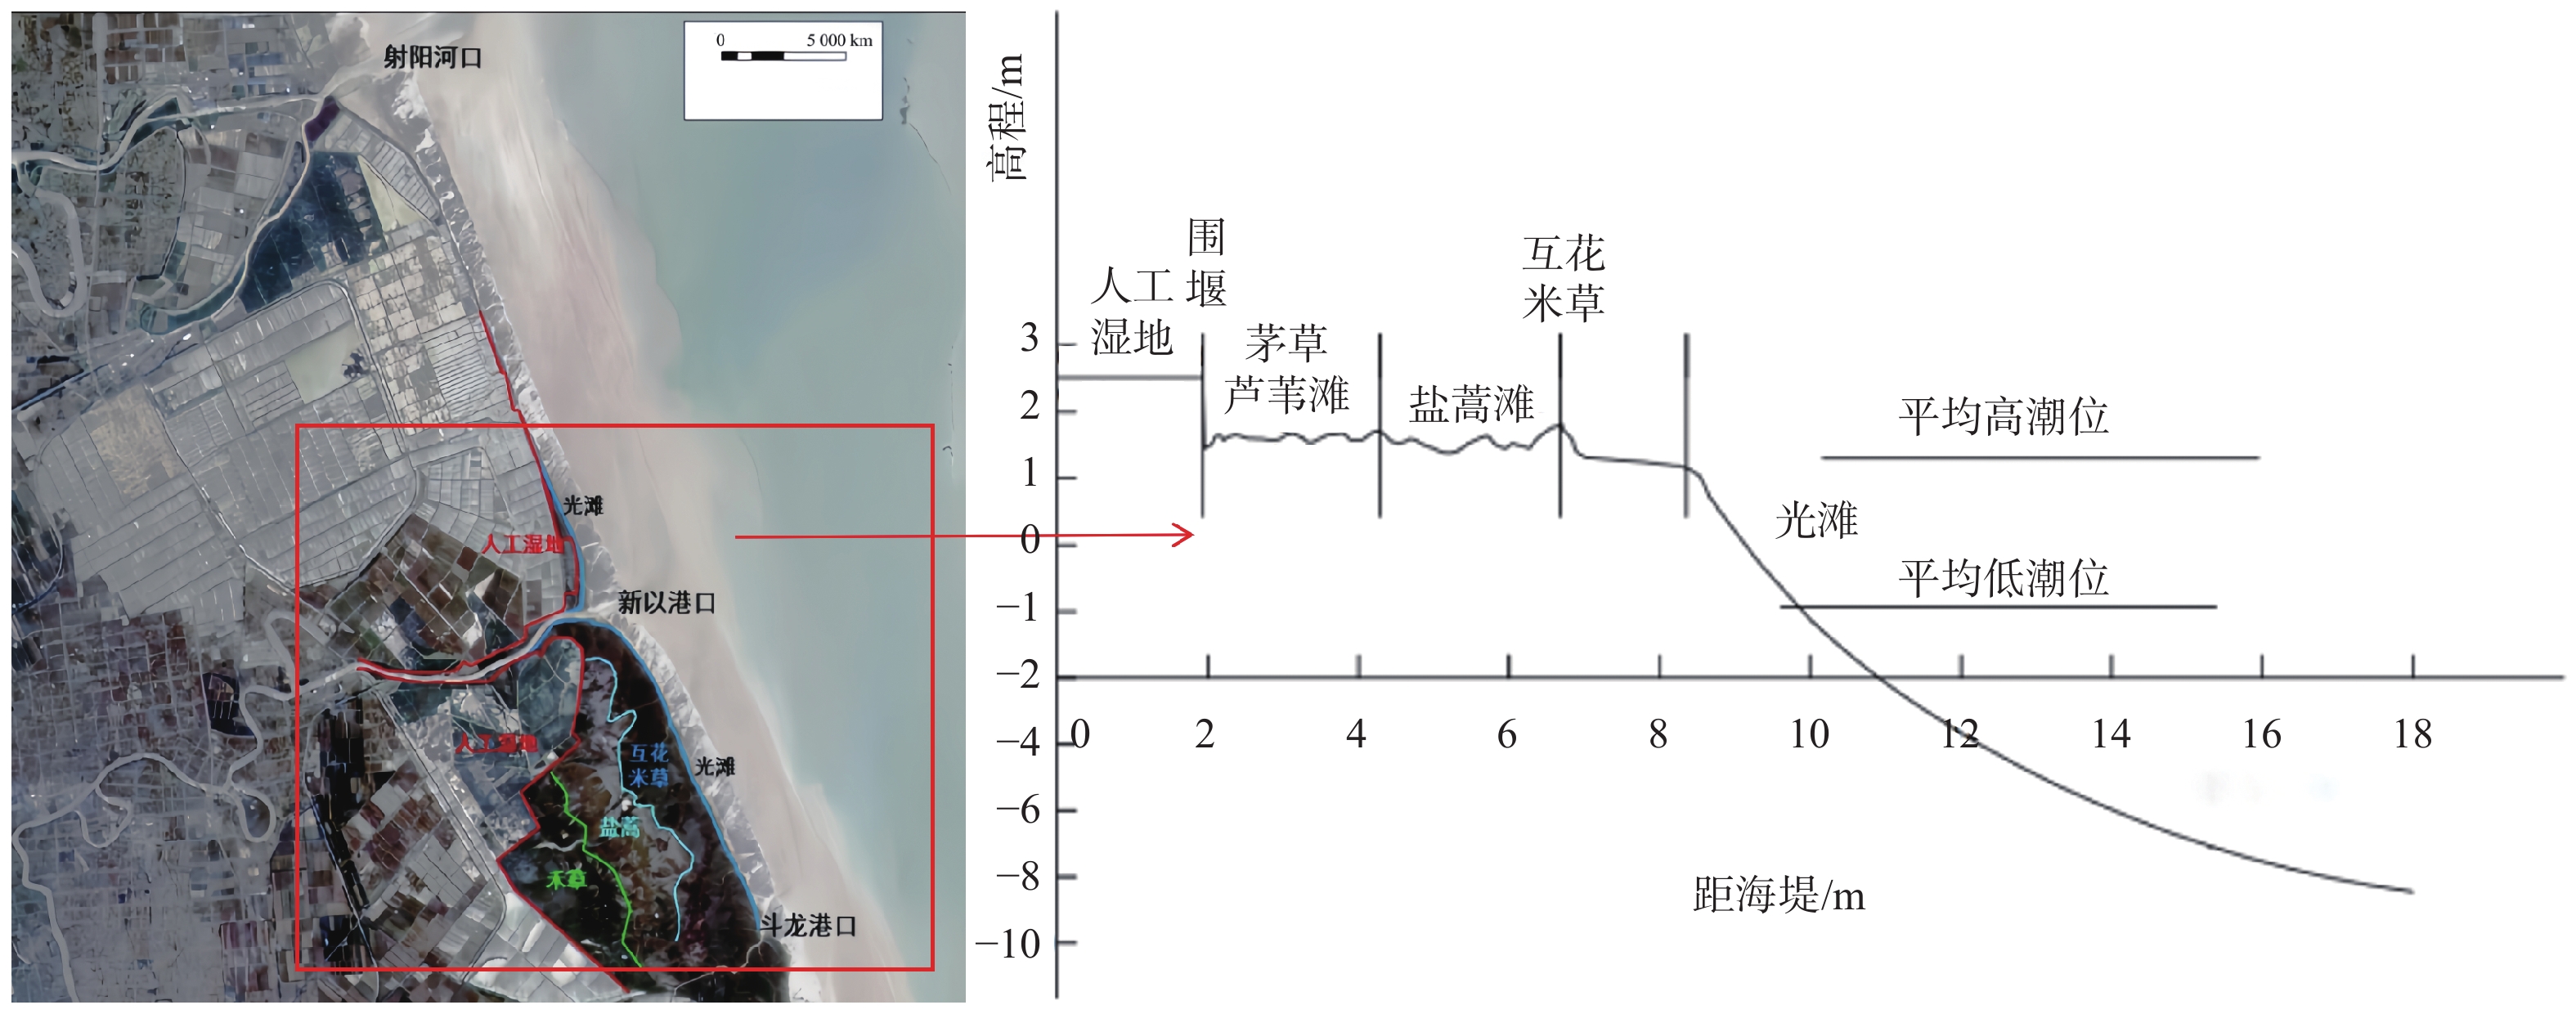
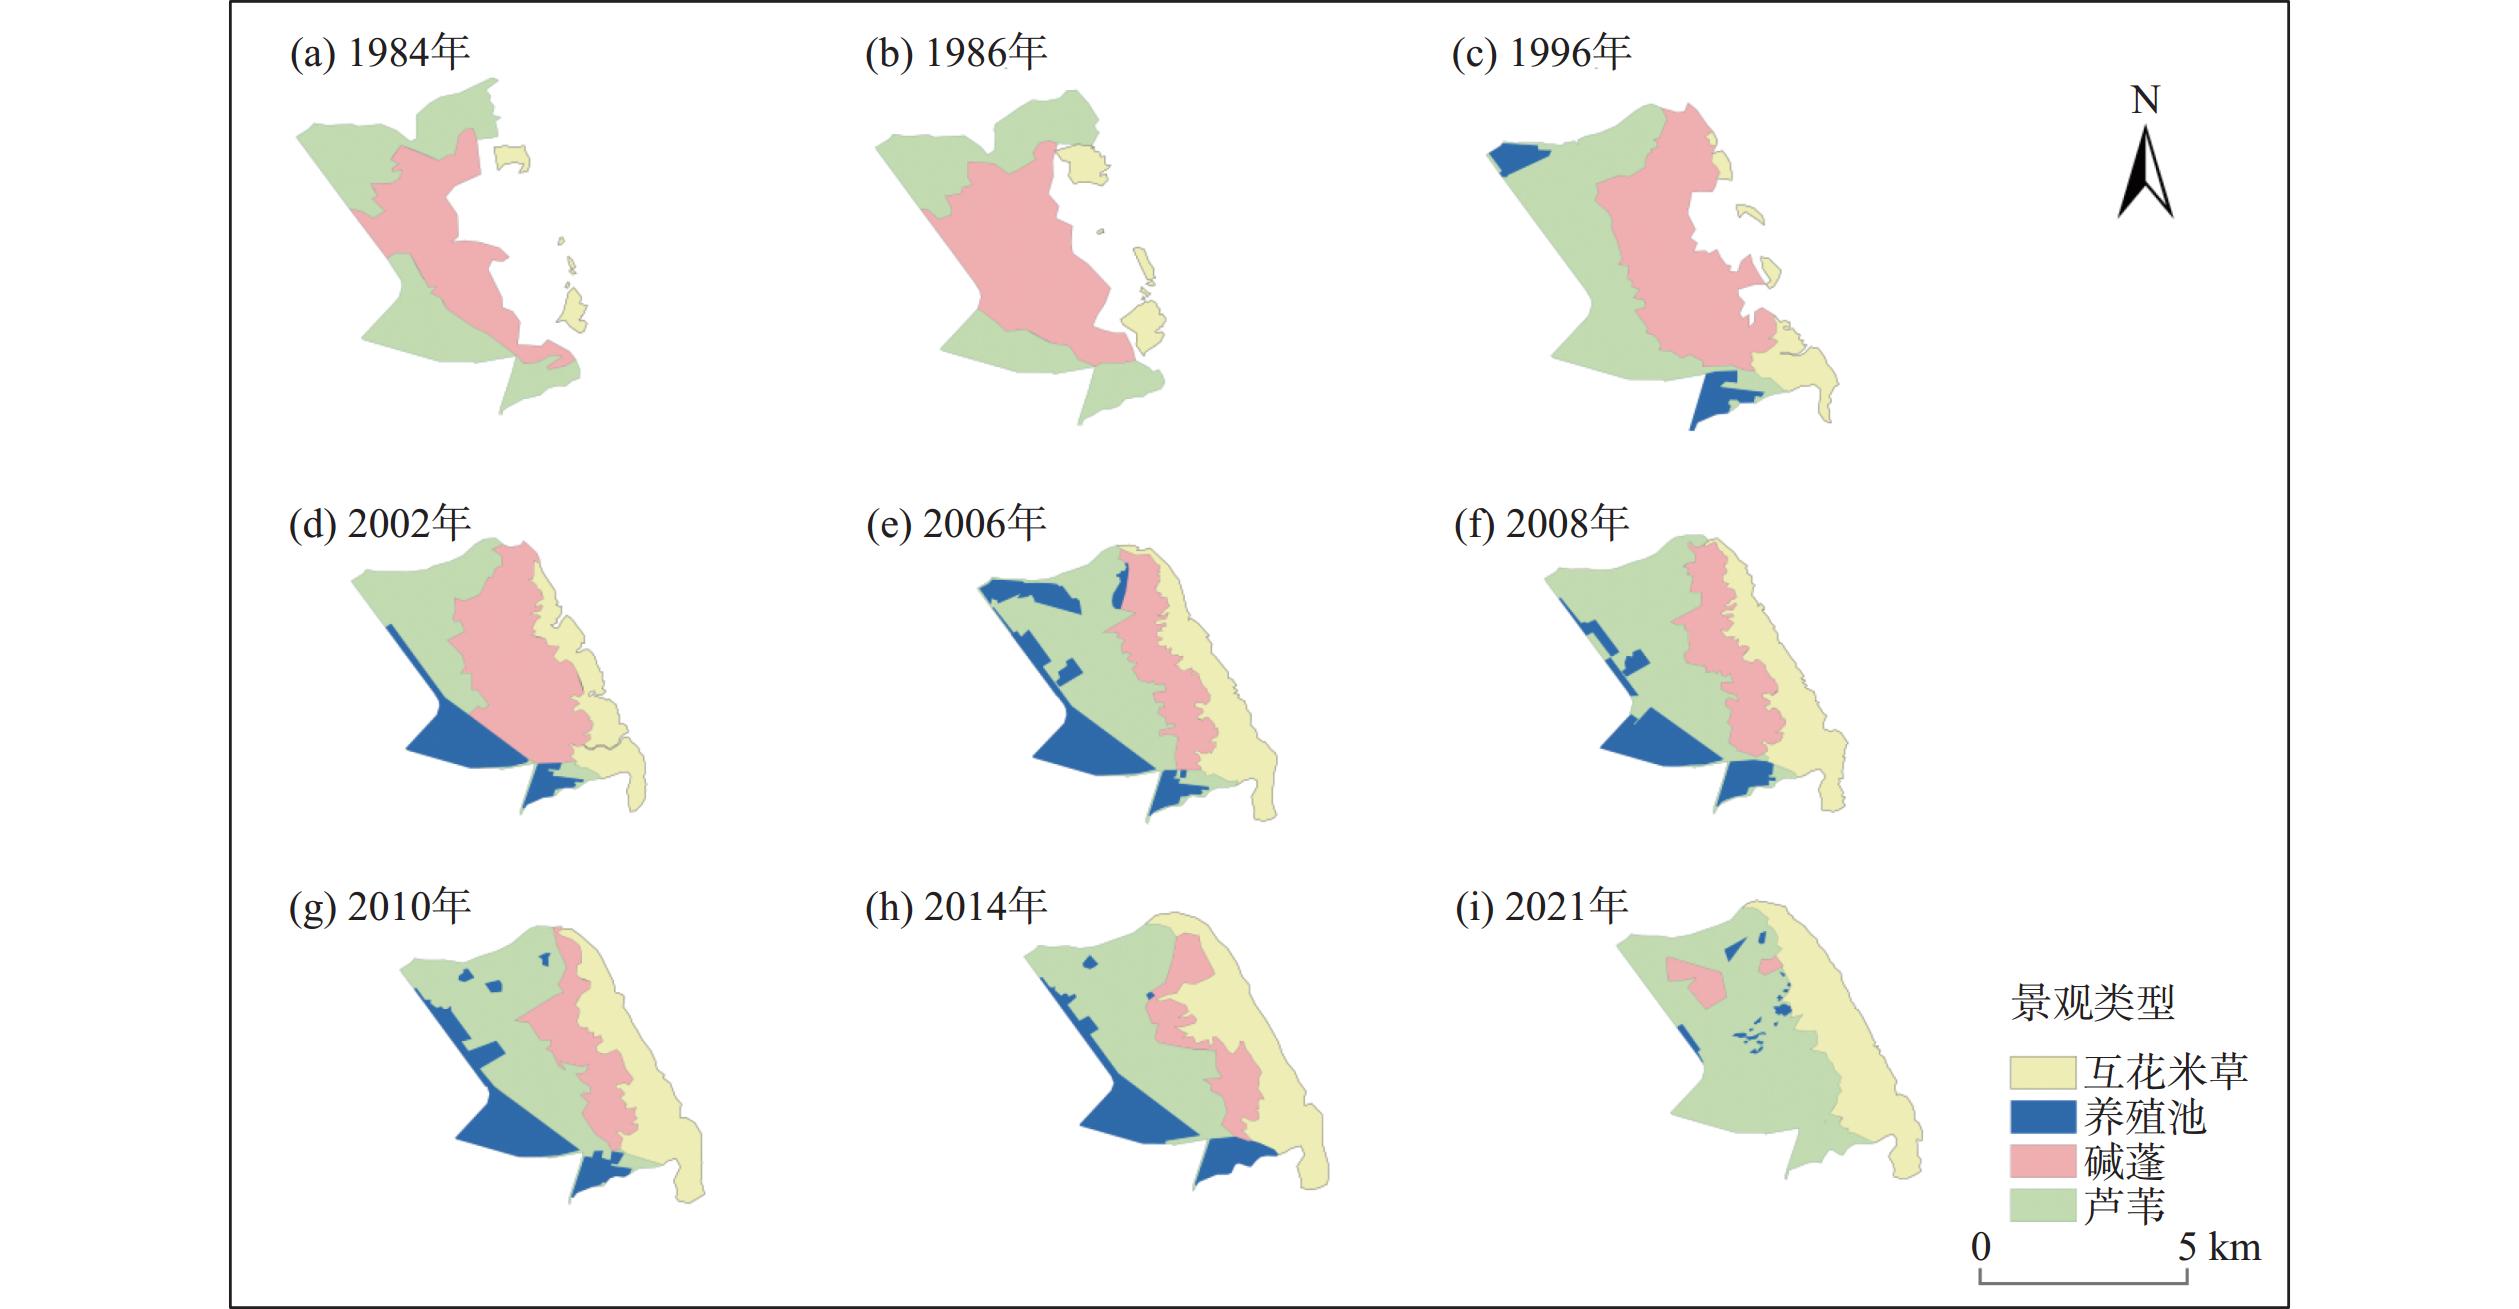
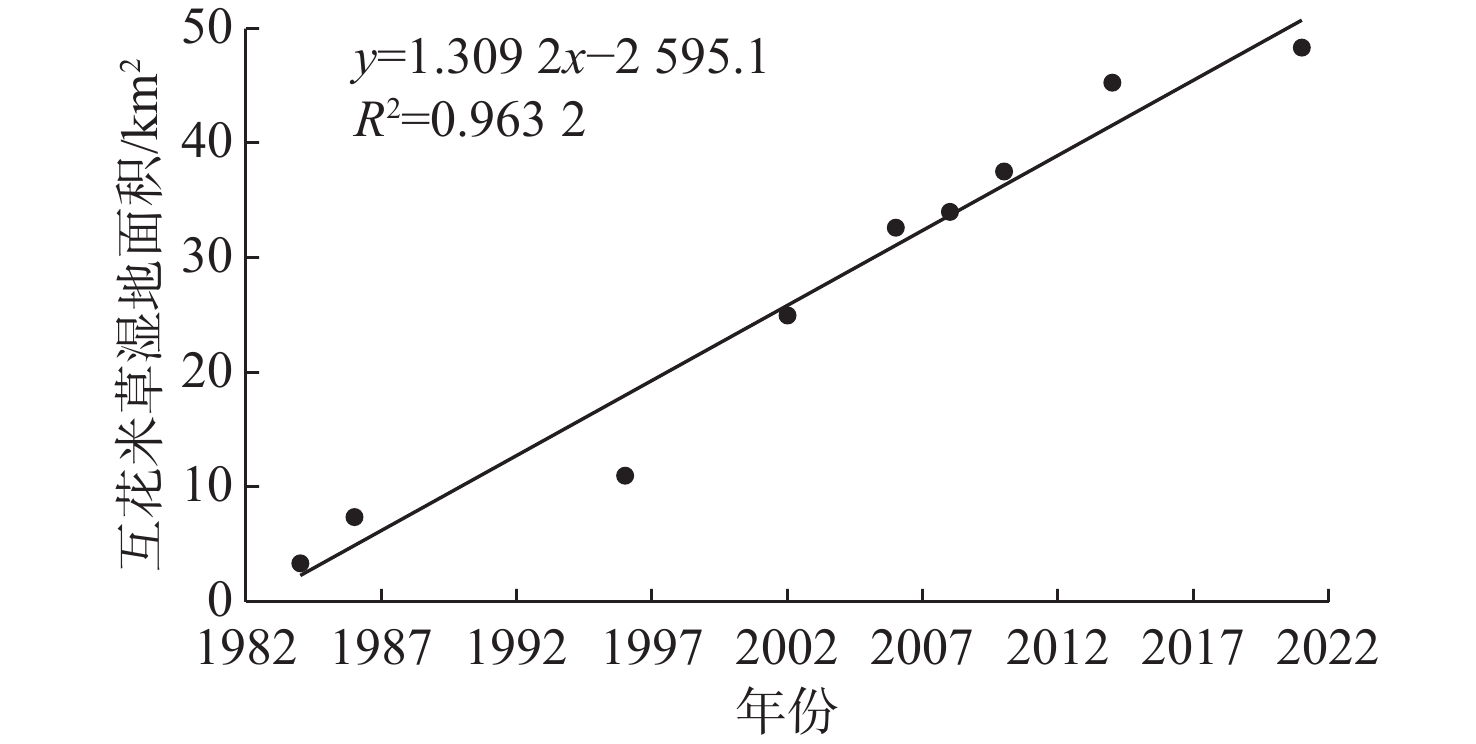
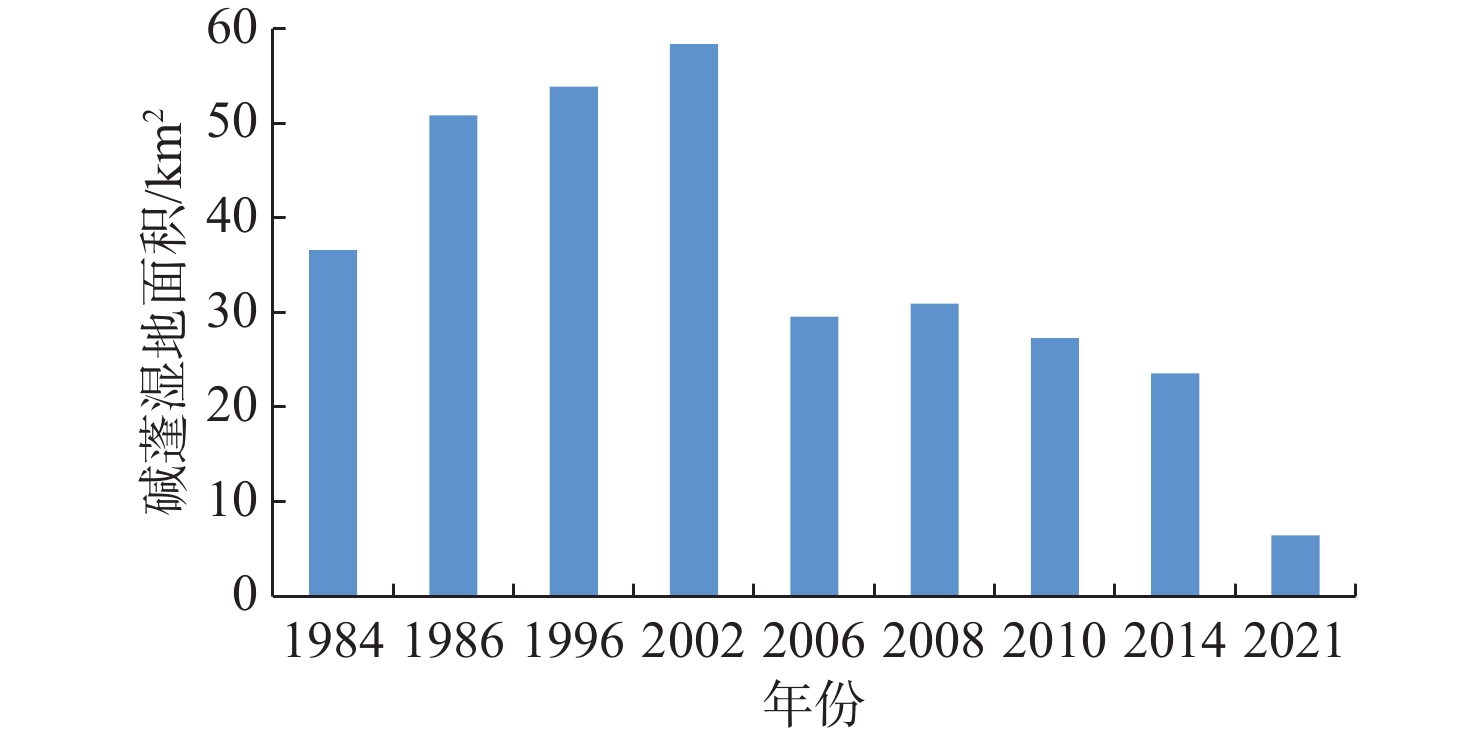
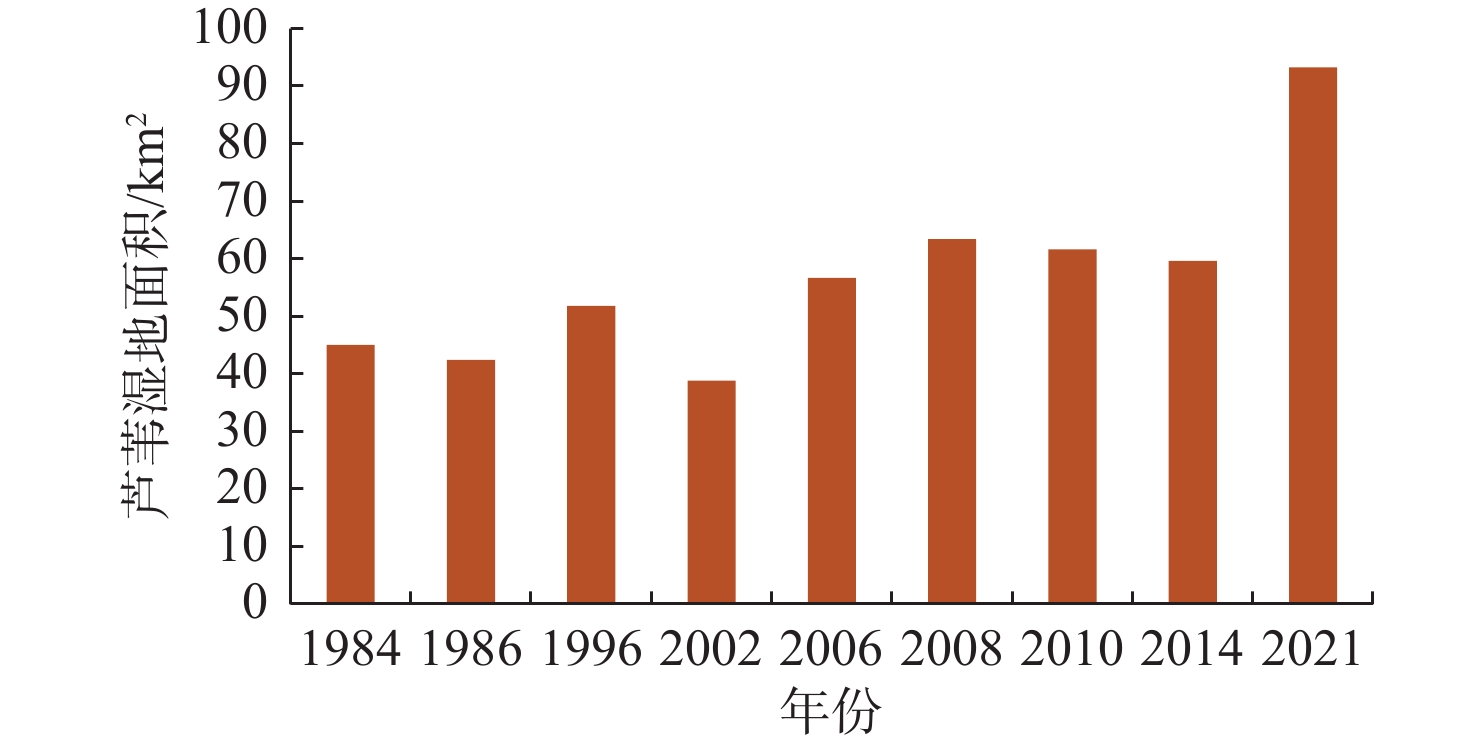
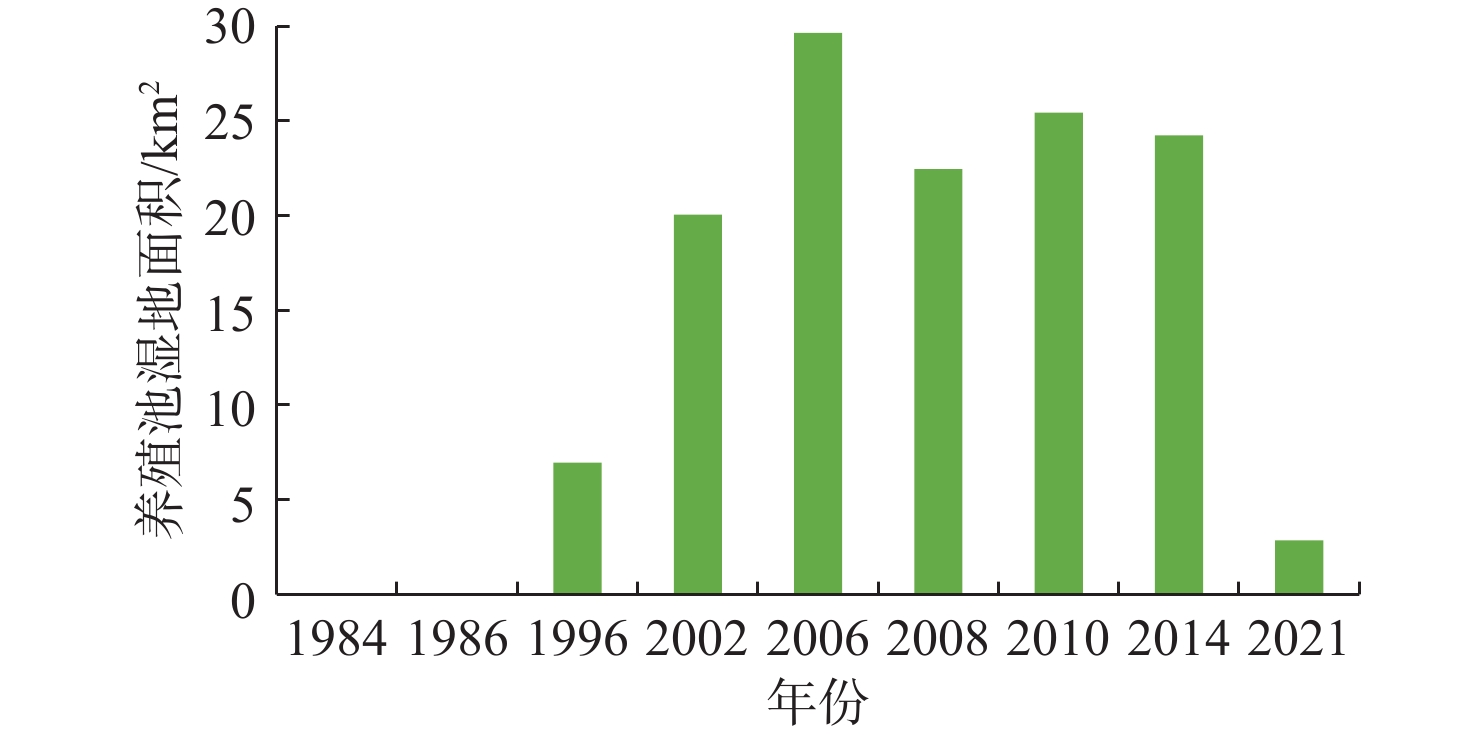
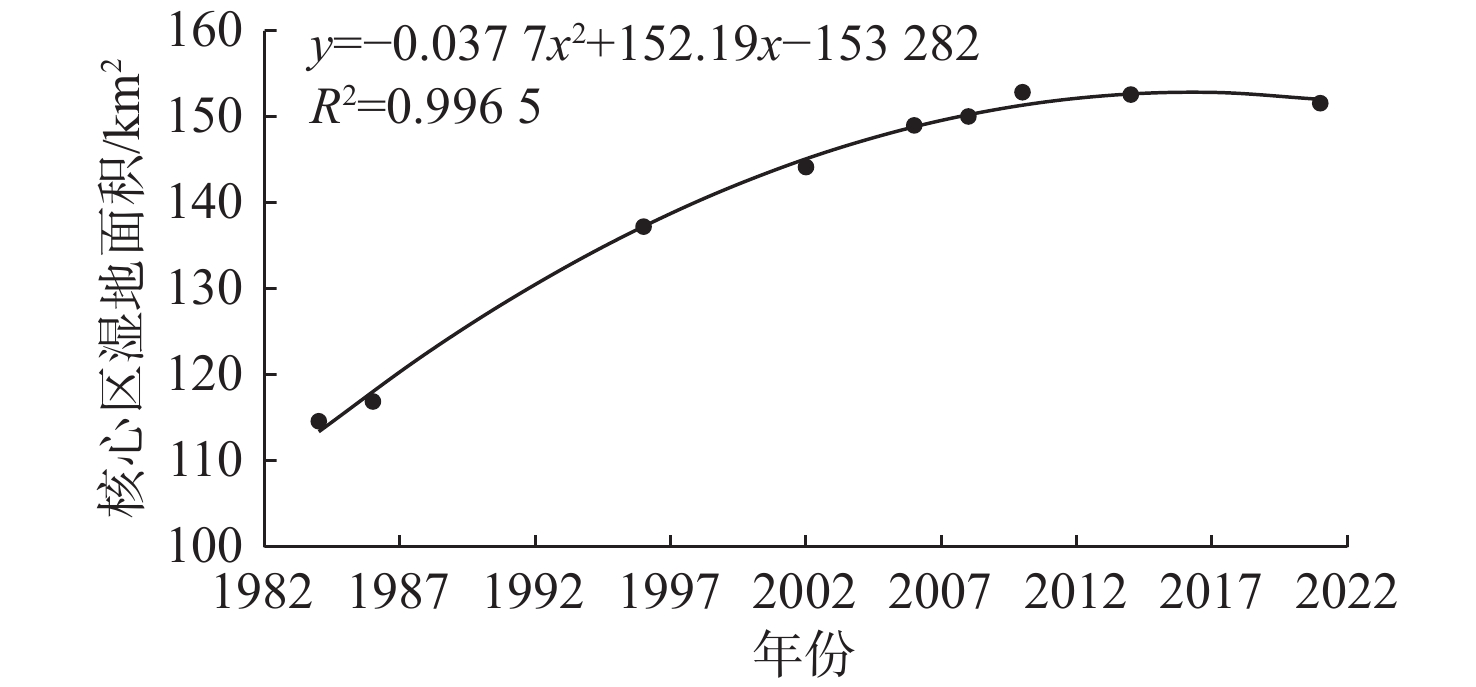
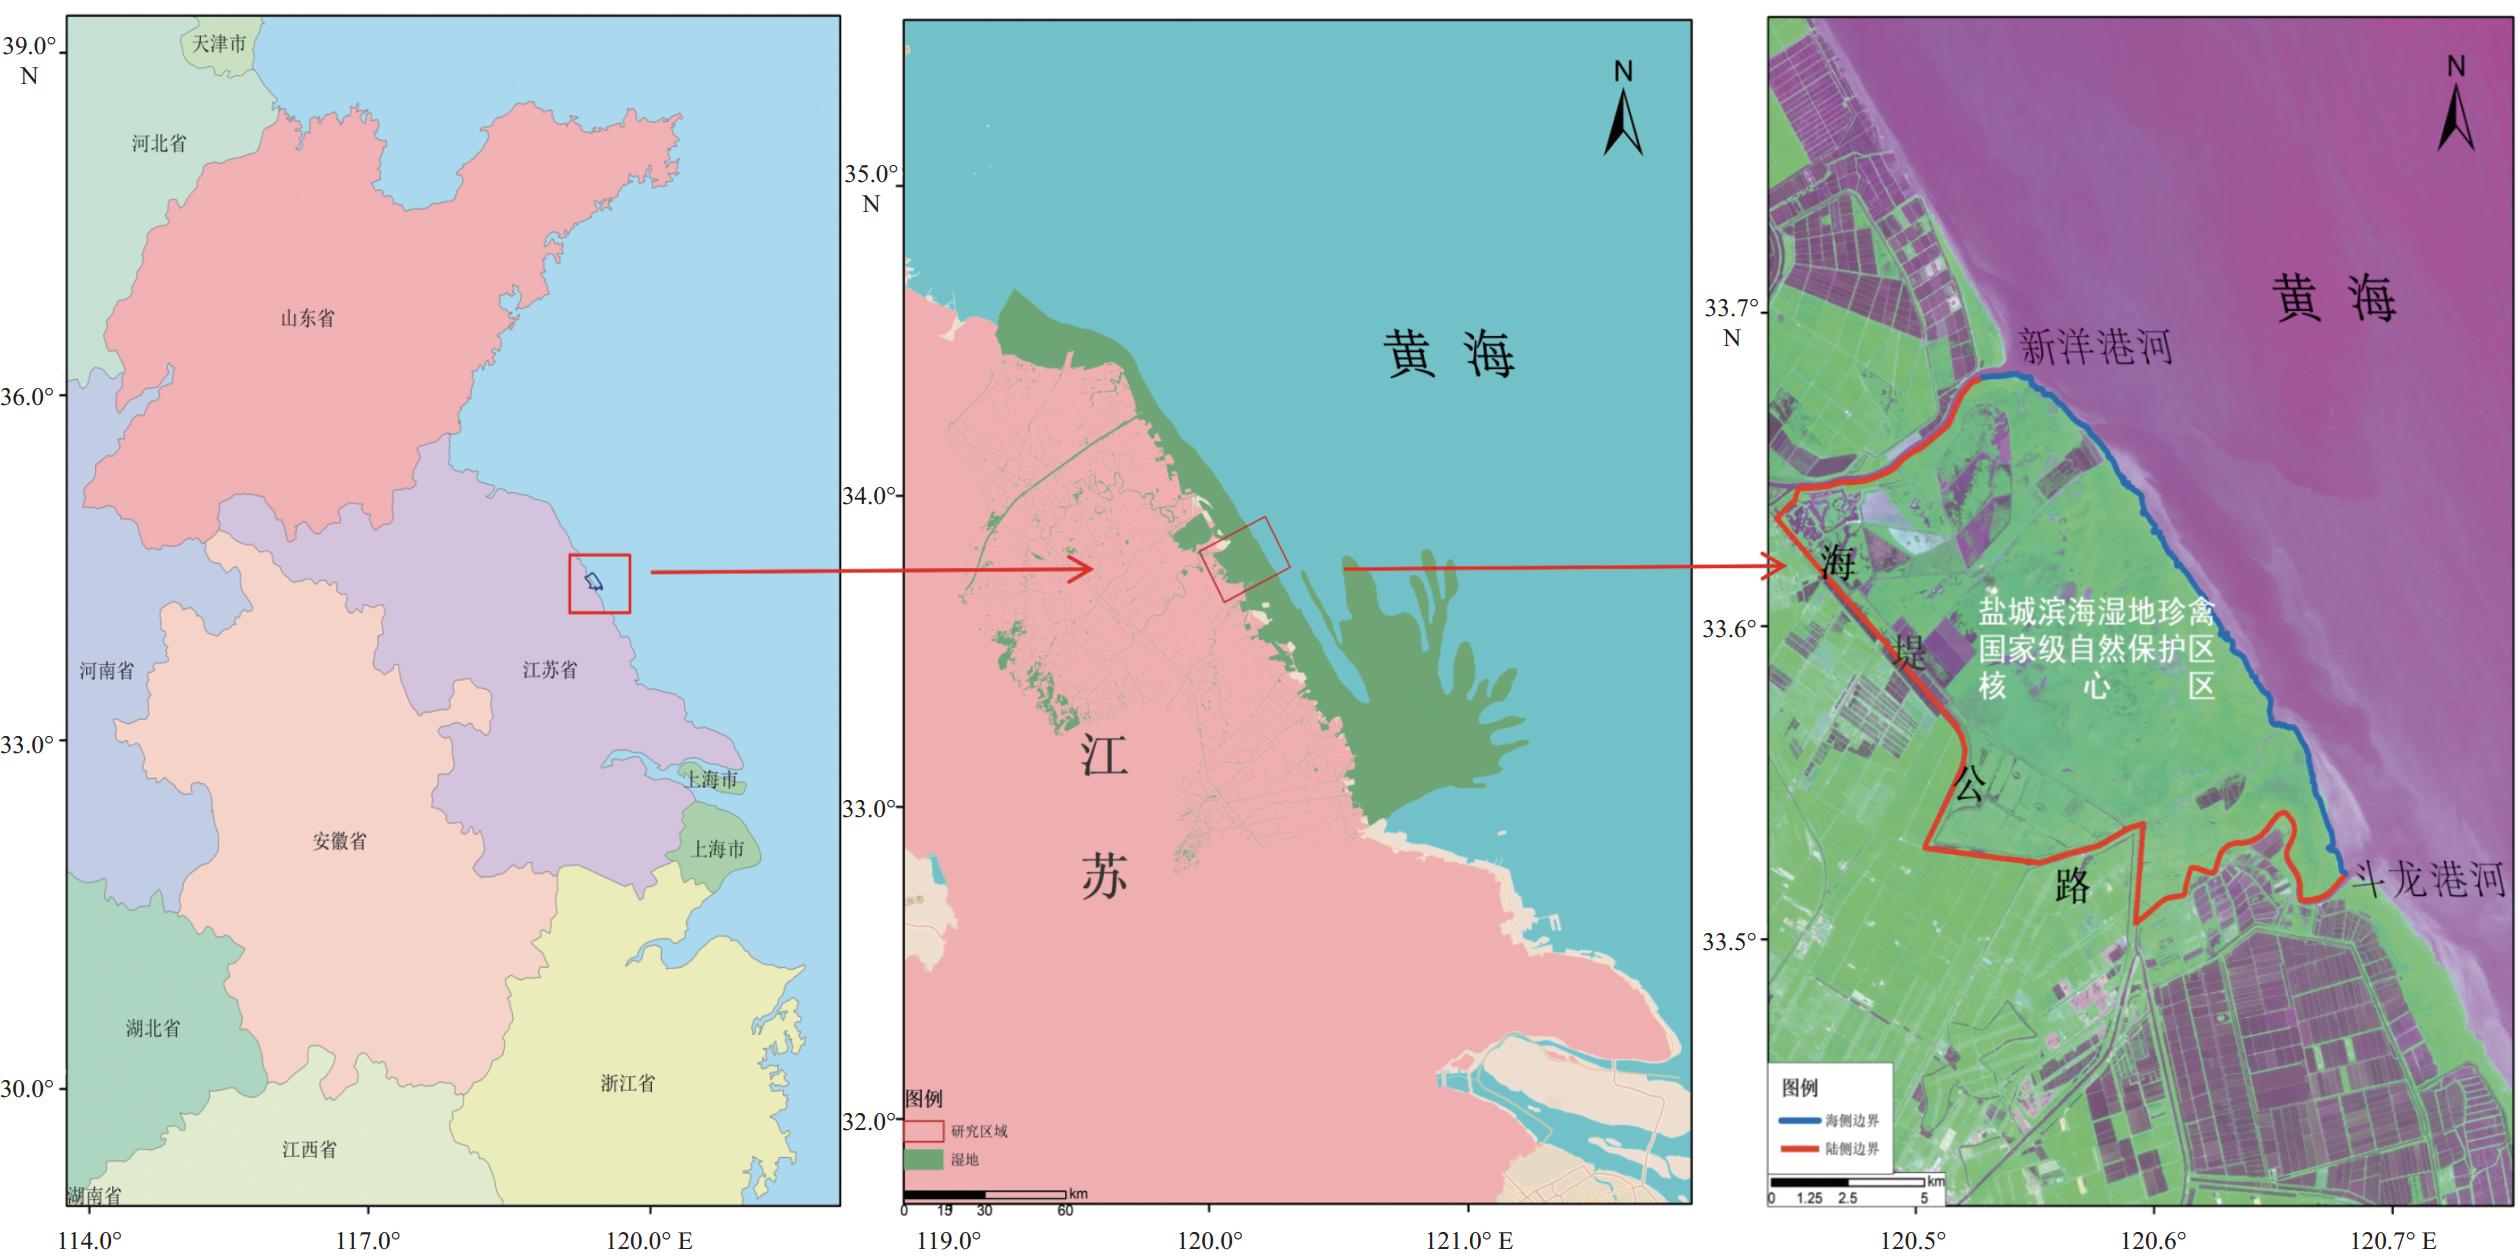
江苏盐城珍禽自然保护区核心区内潮滩盐沼受人为干扰和开发因素的影响较小,主要受海洋动力(波浪、潮流、海平面)和生物自然生长因素的影响。针对核心区潮滩盐沼区域,以1984—2021年的Landsat系列影像为数据来源,采用遥感和地理信息技术,结合阈值分割、大津算法、非监督分类等多种分类方法,分析了近40年来盐沼湿地前缘、湿地面积及研究区景观的变化情况。结果表明:①1984—2006年,盐沼前缘呈现全面向海推进的趋势;2008年盐沼前缘开始呈现“南北淤积,中部侵蚀”的变化趋势;2014—2021年,核心区盐沼前缘中部趋于稳定。②研究区景观区域主要包括互花米草、碱蓬、芦苇以及养殖池区。互花米草面积与时间呈正相关关系;碱蓬面积先增加后减少;芦苇面积受碱蓬和互花米草的影响,呈先减少后增加态势;受政策影响,养殖池面积先增加后减少,直至消失。③研究区湿地面积与互花米草面积变化趋势一致。1984—2021年,盐沼前缘不断向海推进,核心区湿地面积持续增加,直到2014年增加速率有所减缓。
Abstract:The tidal salt marsh in the core area of Jiangsu Yancheng Rare Bird Nature Reserve has currently been less affected by human but mainly by natural marine dynamics (waves, tides, sea level, etc.) and local primitive organisms. To understand the changes at the front edge of the salt marsh and in the wetland area, and the landscape evolution of the wetland, the Landsat serial images from 1984 to 2021 were analyzed using remote sensing technology and geographic information technology, combined with various methods (threshold segmentation, Otsu algorithm, and unsupervised classification). Results show that first, from 1984 to 2006, the front edge showed a trend of full seaward advancement. In 2008, the front edge began to show a pattern of "north-south siltation and central erosion"; From 2014 to 2021, the central part of the front edge in the core area tended to be stable. Secondly, the landscape organisms in the core area included mainly intergrass, alkali ponies, reeds and aquaculture ponds. The area of intergrass is positively correlated with time, the area of alkali canopy increased first and then decreased, and the area of reed was influenced by alkali canopy and intergrass, showing a decrease first and then an increase. The area of culture pond increased first and then decreased until it was completely banned by the government. Thirdly, The change of salt marsh front edge in the core area wetlands tended to be consistent with the change of intergrass area in the core area. From 1984 to 2014, the salt marsh front edge had been advancing seaward with the area of intergrass increasing, and then stabilized after 2014.
-
Key words:
- salt marsh coastal wetlands /
- remote sensing /
- salt marsh vegetation /
- landscape change
-

-
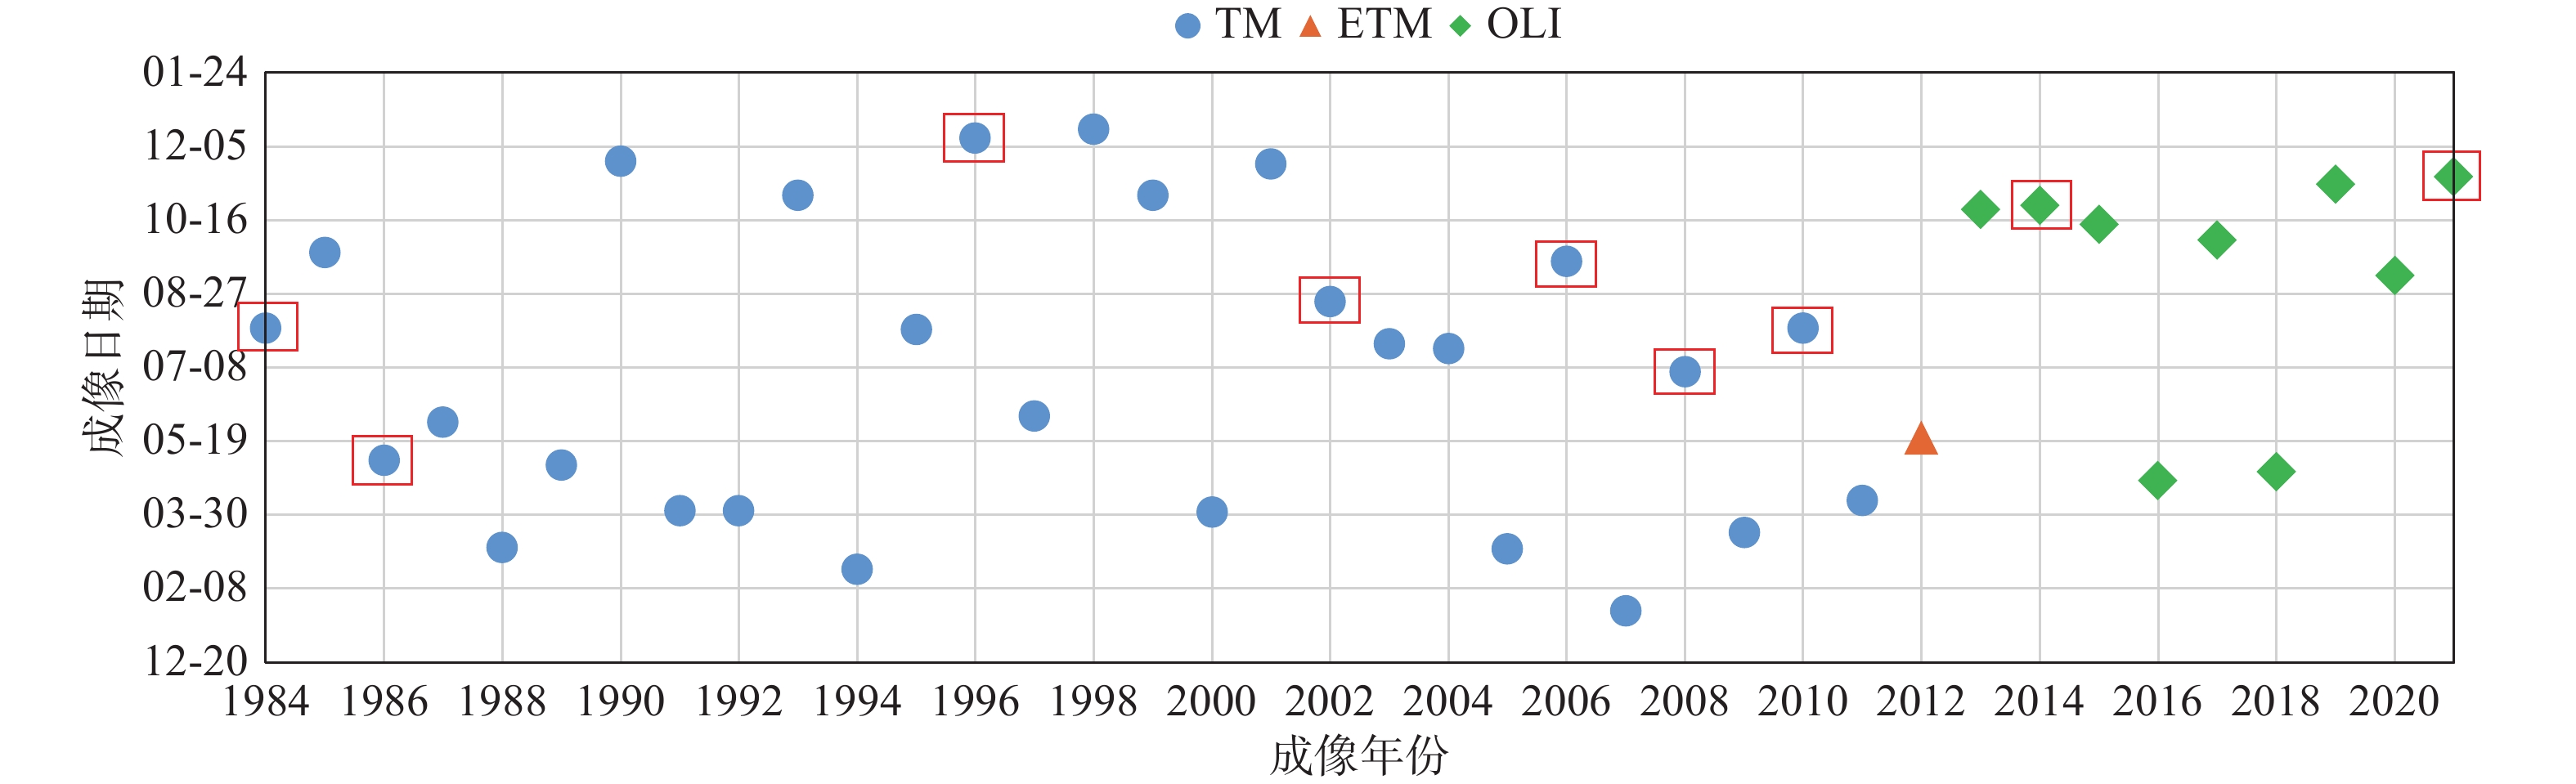
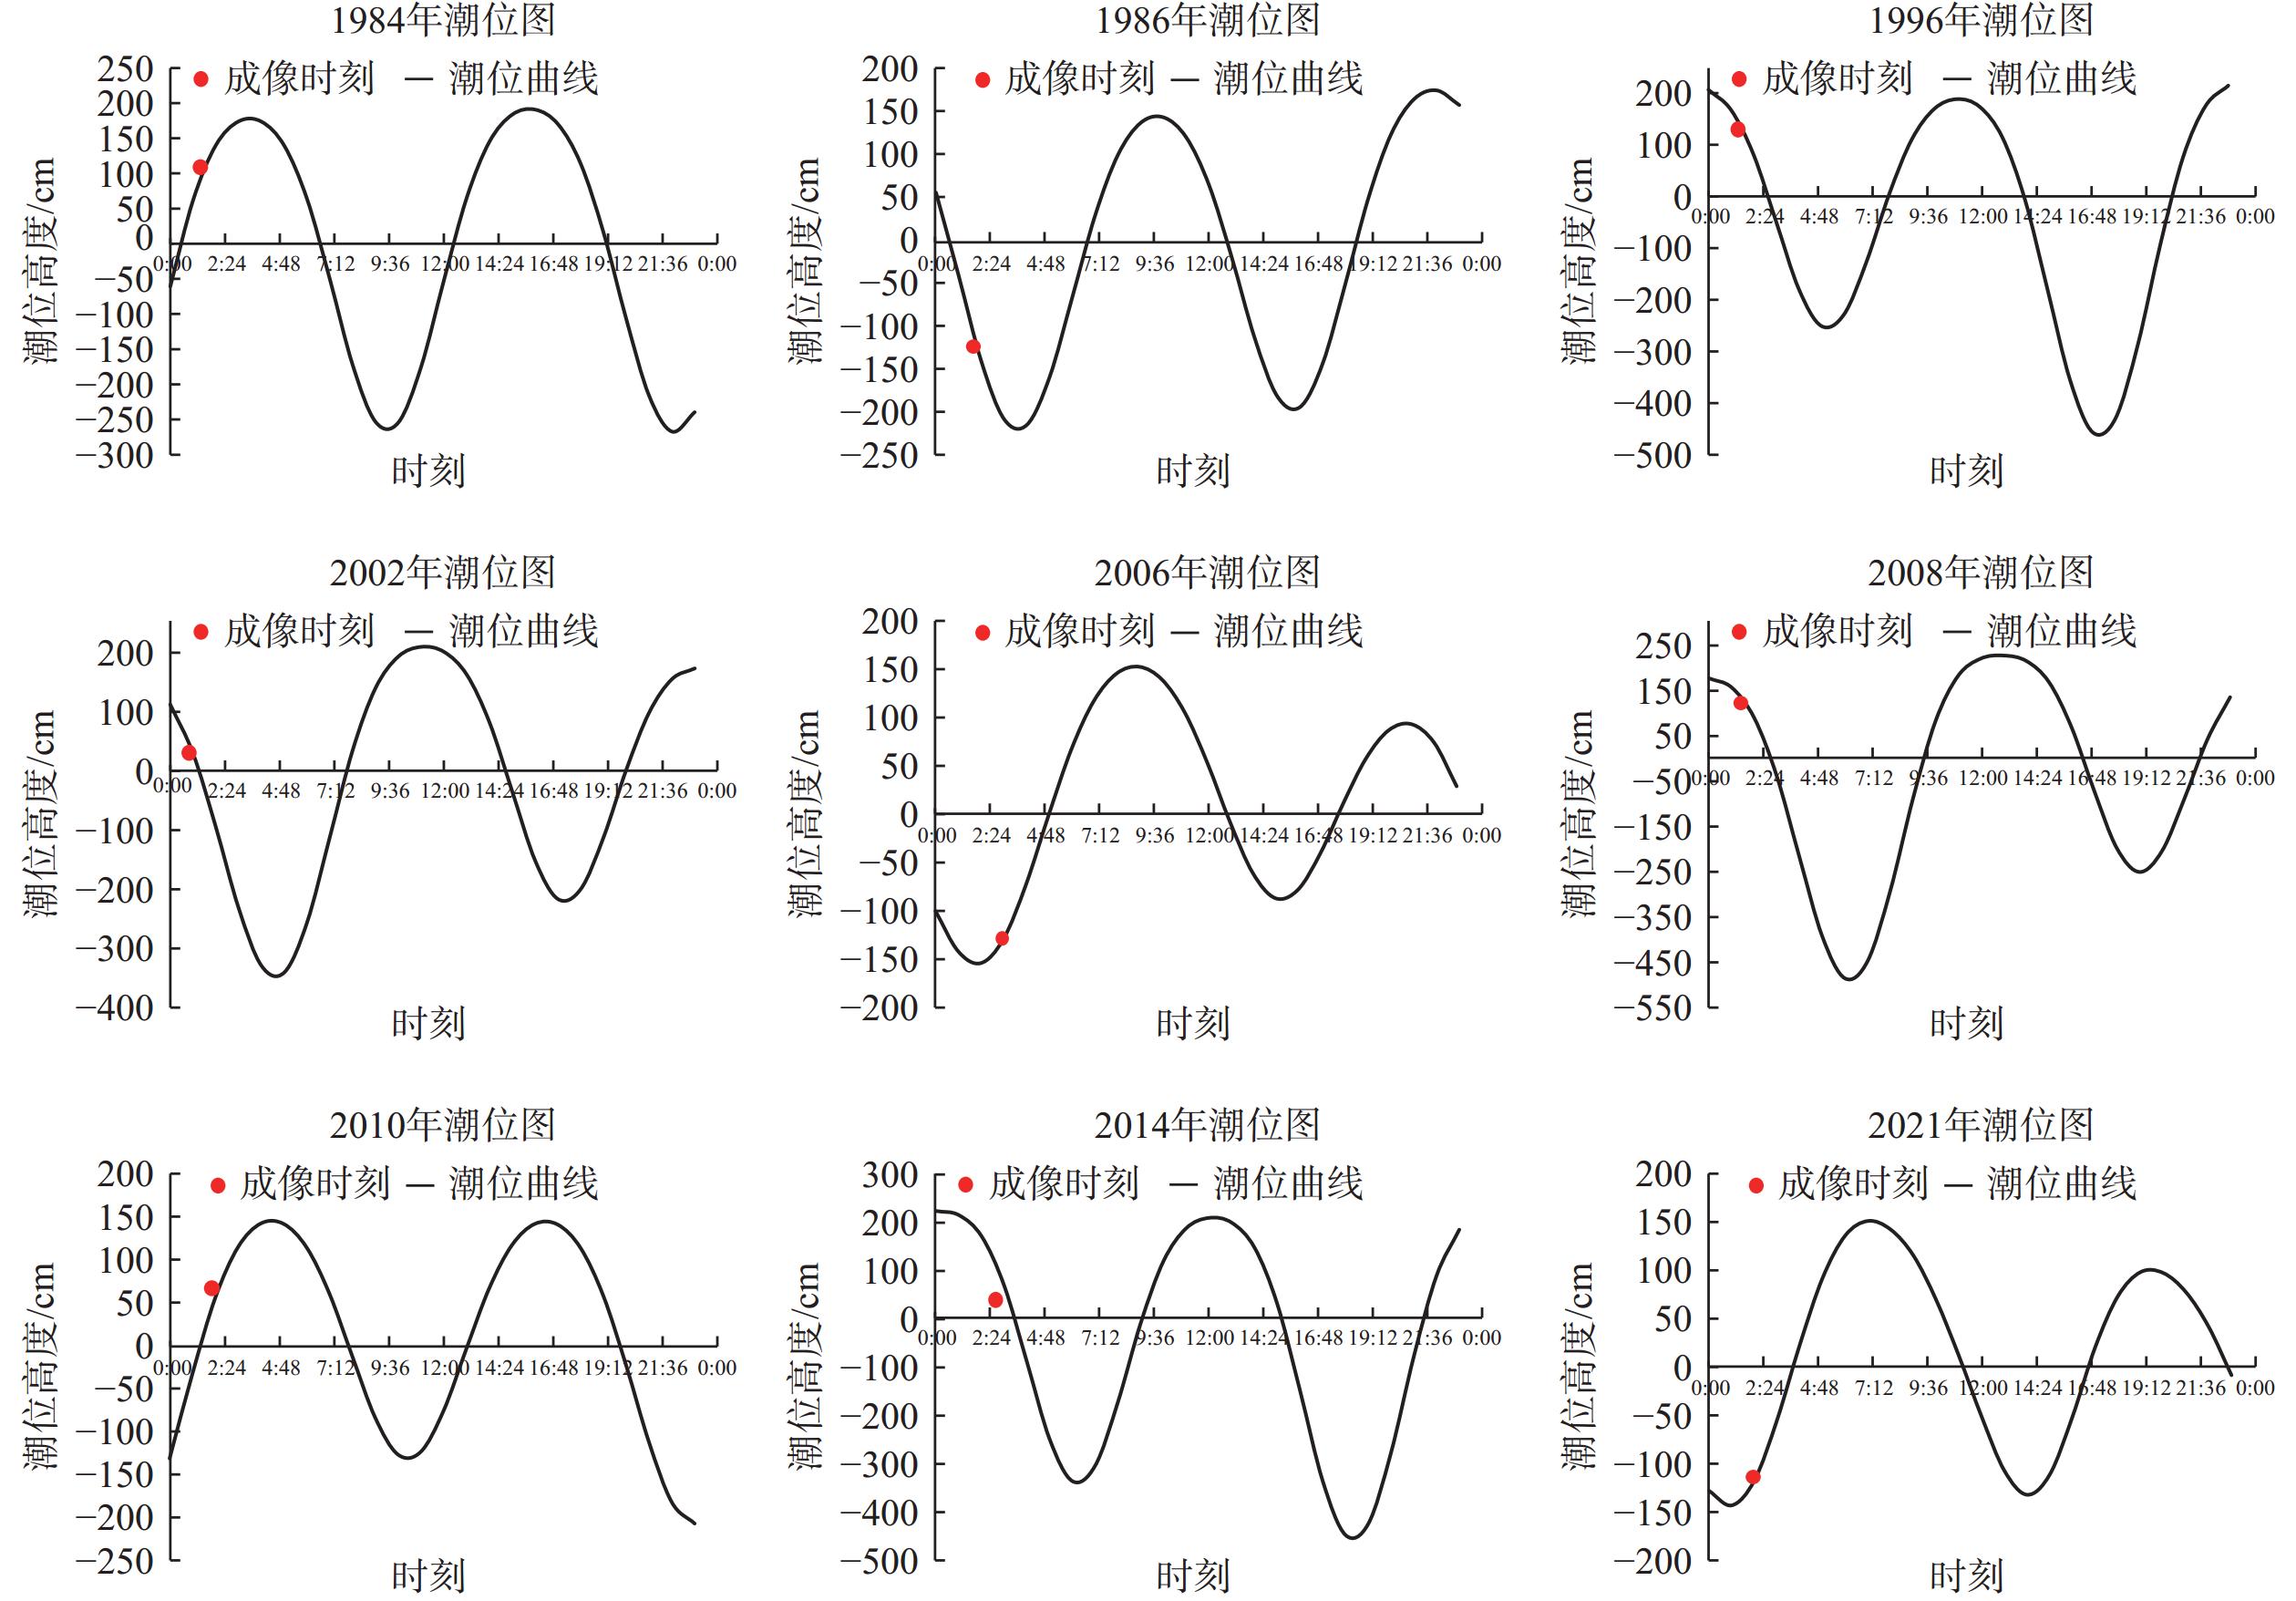
表 1 Landsat影像数据
Table 1. Landsat image data
年份 卫星 传感器 成像日期 成像时刻 1984 Landsat-5 TM 08-04 02:00 1986 Landsat-5 TM 05-06 02:30 1996 Landsat-5 TM 12-11 01:52 2002 Landsat-5 TM 08-22 02:05 2006 Landsat-5 TM 09-18 02:24 2008 Landsat-5 TM 07-05 02:17 2010 Landsat-5 TM 08-04 02:23 2014 Landsat-8 OLI 10-26 02:30 2021 Landsat-8 OLI 11-14 02:11  下载: 导出CSV
表 2 研究年份影像阈值
Table 2. Image thresholds for the study year
年份 阈值 年份 阈值 1984 0.85 2003 0.85 1985 0.9 2004 0.85 1986 0.8 2005 0.75 1987 0.9 2006 0.9 1988 0.8 2007 0.85 1989 0.8 2008 0.9 1990 0.8 2009 0.8 1991 0.8 2010 0.85 1992 0.8 2011 0.8 1993 0.75 2012 0.9 1994 0.8 2013 0.9 1995 0.8 2014 0.9 1996 0.8 2015 0.9 1997 0.8 2016 0.9 1998 0.8 2017 0.75 1999 0.8 2018 0.9 2000 0.8 2019 0.9 2001 0.8 2020 0.85 2002 0.9 2021 0.9
下载: 导出CSV
表 3 1986—2021年海岸线提取精度验证
Table 3. Accuracy verification for coastline extraction from 1986 to 2021
年份 缓冲半径/像元 TP/m FP/m FN/m 完整性/% 正确性/% 质量/% 1986 0.5 463 60 73 86.38 88.53 77.68 1 493 30 23 95.54 94.26 90.29 1996 0.5 431 85 92 82.41 83.53 70.89 1 494 22 20 96.11 95.74 92.16 2002 0.5 481 69 80 85.74 87.45 76.35 1 519 31 24 95.58 94.36 90.42 2006 0.5 493 79 85 85.29 86.19 75.04 1 531 39 20 96.37 93.16 90.00 2008 0.5 446 97 84 84.15 82.14 71.13 1 512 31 25 95.34 94.29 90.14 2010 0.5 467 100 91 83.69 82.36 70.97 1 535 32 19 96.57 94.36 91.30 2014 0.5 460 96 86 84.25 82.73 71.65 1 523 33 17 96.85 94.06 91.27 2021 0.5 485 86 83 85.39 84.94 74.16 1 532 39 18 96.73 93.17 90.32
下载: 导出CSV
-
[1] 孙超,刘永学,李满春,等. 近25 a来江苏中部沿海盐沼分布时空演变及围垦影响分析[J]. 自然资源学报,2015,30(9):1486-1498. doi: 10.11849/zrzyxb.2015.09.006
[2] 刘书锦,曹海,李丹,等. 滨海湿地生态保护及修复研究进展[J]. 海洋开发与管理,2022,39(7):29-34.
[3] 王佳,于莉莉,耿林,等. 大沽河流域滨海湿地景观格局变化及其驱动机制[J]. 海洋地质前沿,2023,39(8):29-37.
[4] 赵秧秧,高抒,王丹丹,等. 盐沼前缘陡坎韵律性形态特征及其形成过程与机理[J]. 地理学报,2014,69(3):378-390. doi: 10.11821/dlxb201403009
[5] 张华兵,甄艳,吴菲儿,等. 滨海湿地生境质量演变与互花米草扩张的关系:以江苏盐城国家级珍禽自然保护区为例[J]. 资源科学,2020,42(5):1004-1014. doi: 10.18402/resci.2020.05.17
[6] 杜培军,陈宇,谭琨. 江苏滨海湿地土地利用/覆盖变化与地表温度响应遥感监测[J]. 国土资源遥感,2014,26(2):112-120.
[7] 陈明辉. 基于Landsat数据的1988—2018年东莞湿地演变的遥感分析[J]. 测绘地理信息,2022,47(6):115-119.
[8] 柯丽娜,徐佳慧,王楠,等. 基于遥感生态指数的滨海湿地生态质量变化评价:以辽东湾北部区为例[J]. 生态环境学报,2022,31(7):1417-1424.
[9] 宋怀荣,苏国辉,孙记红,等. 基于随机森林的盐城湿地近20年景观格局变化[J]. 海洋地质前沿,2021,37(12):75-82.
[10] 李建国,濮励杰,徐彩瑶,等. 1977—2014年江苏中部滨海湿地演化与围垦空间演变趋势[J]. 地理学报,2015,70(1):17-28. doi: 10.11821/dlxb201501002
[11] 李景霞,付碧宏. 江苏盐城滨海湿地系统格局变化及其对丹顶鹤生境的影响[J]. 遥感学报,2021,25(12):2507-2519. doi: 10.11834/jrs.20210606
[12] 金宇,高吉喜,周可新,等. 围垦及米草入侵下江苏中部滨海湿地土地利用/覆被类型动态变化[J]. 地理研究,2017,36(8):1478-1488.
[13] 刘瑞清,李加林,孙超,等. 基于Sentinel-2遥感时间序列植被物候特征的盐城滨海湿地植被分类[J]. 地理学报,2021,76(7):1680-1692. doi: 10.11821/dlxb202107008
[14] 吴亚茜,肖向明,陈帮乾,等. 近30年来盐城潮间带湿地盐沼植被物候遥感监测[J]. 江苏农业科学,2018,46(16):264-270.
[15] 张梅. 典型盐沼湿地前缘和岸滩演变研究[D]. 连云港:江苏海洋大学,2021.
[16] 李屹,陈一宁,李炎. 红树林与互花米草盐沼交界区空间格局变化规律的遥感分析[J]. 海洋通报,2017,36(3):348-360.
[17] 张晓祥,王伟玮,严长清,等. 南宋以来江苏海岸带历史海岸线时空演变研究[J]. 地理科学,2014,34(3):344-351.
[18] 李梅娜,陈小英,刘金庆,等. 基于遥感的威海岸线变迁分析[J]. 海洋地质与第四纪地质,2016,36(6):79-84.
[19] 周亚男,朱志文,沈占锋,等. 融合纹理特征和空间关系的TM影像海岸线自动提取[J]. 北京大学学报(自然科学版),2012,48(2):273-279.
[20] 高抒,杜永芬,谢文静,等. 苏沪浙闽海岸互花米草盐沼的环境-生态动力过程研究进展[J]. 中国科学:地球科学,2014,44(11):2339-2357.
[21] WANG B ,ZHANG K,LIU Q X,et al. Long-distance facilitation of coastal ecosystem structure and resilience [J]. Proceedings of the National Academy of Sciences of the United States of America,2022,119(28):e2123274119.
[22] WANG Y H ,ZHANG R S ,WU D A ,et al. Development and mechanism of transitional coast[J]. Ocean Engineering,2003,21(2):65-70.
[23] 刘旭英,高建华,白凤龙,等.苏北新洋港潮滩柱状沉积物粒度分布特征[J].海洋地质与第四纪地质,2008,28(4):27-35.
刘旭英, 高建华, 白凤龙, 等.苏北新洋港潮滩柱状沉积物粒度分布特征[J].海洋地质与第四纪地质, 2008, 28(4): 27-35.
[24] HUGHES M G ,ROGERS K ,WEN L . Saline wetland extents and tidal inundation regimes on a micro-tidal coast,New South Wales,Australia[J]. Estuarine Coastal and Shelf Science,2019,227 (C):106297.
-


图(16)
表(3)
计量
- 文章访问数: 569
- PDF下载数: 73
- 施引文献: 0