

Study on Hyperspectral Analysis of Iron Ore Powder and Quantitative Inversion of Iron Grade
-
摘要:
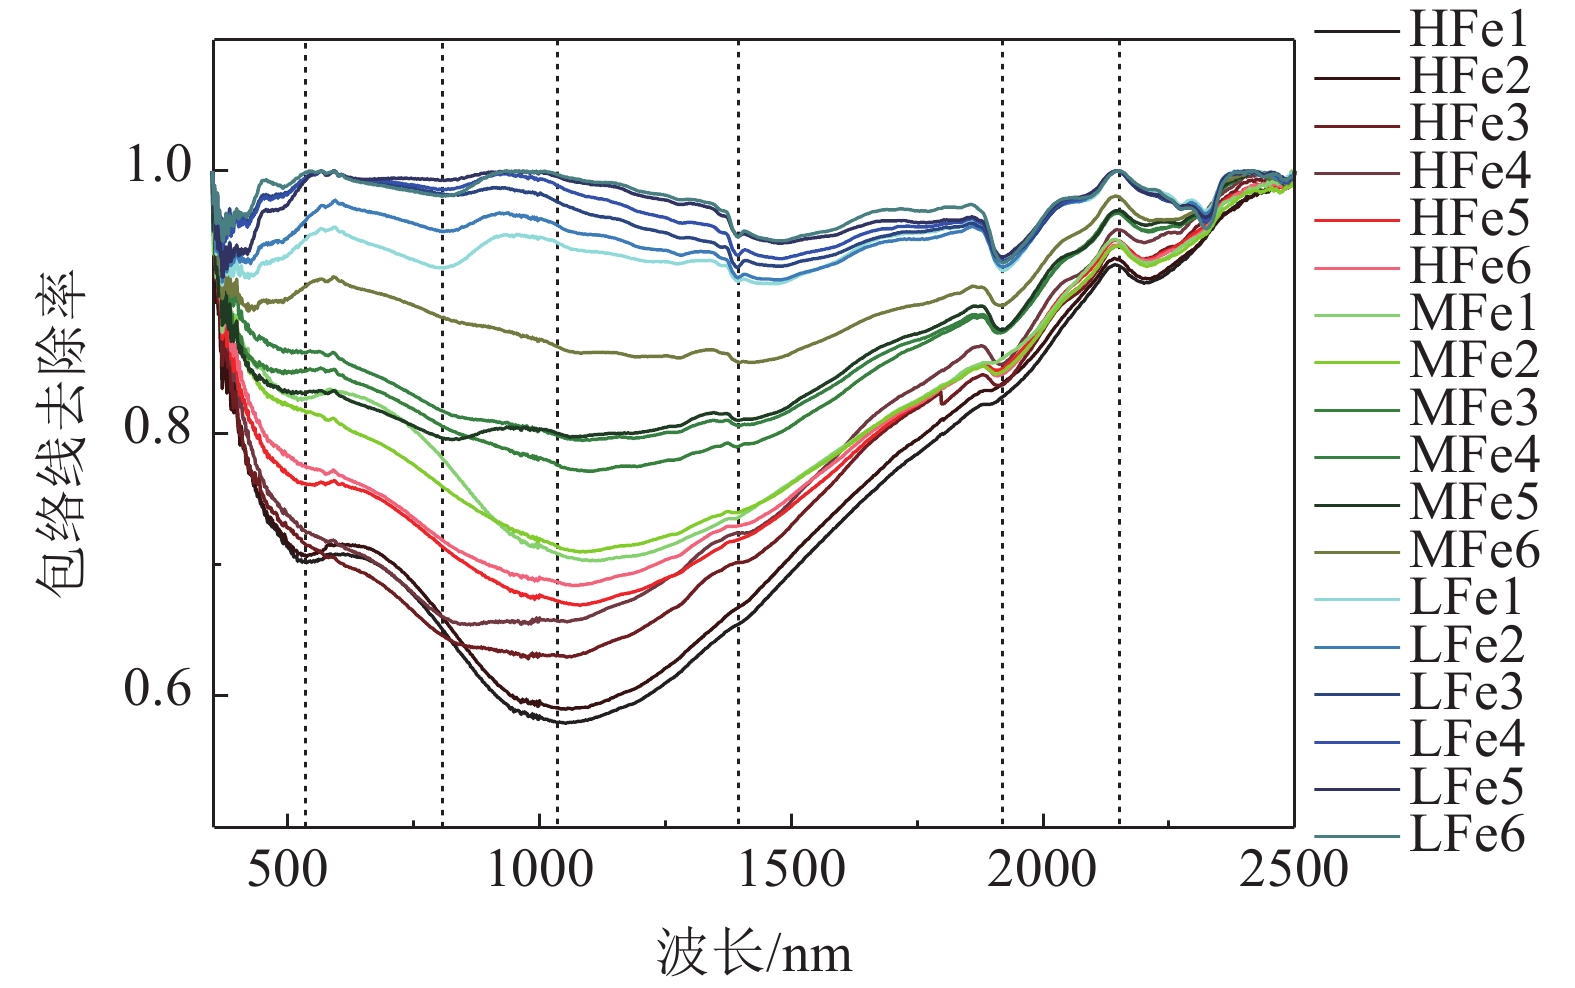
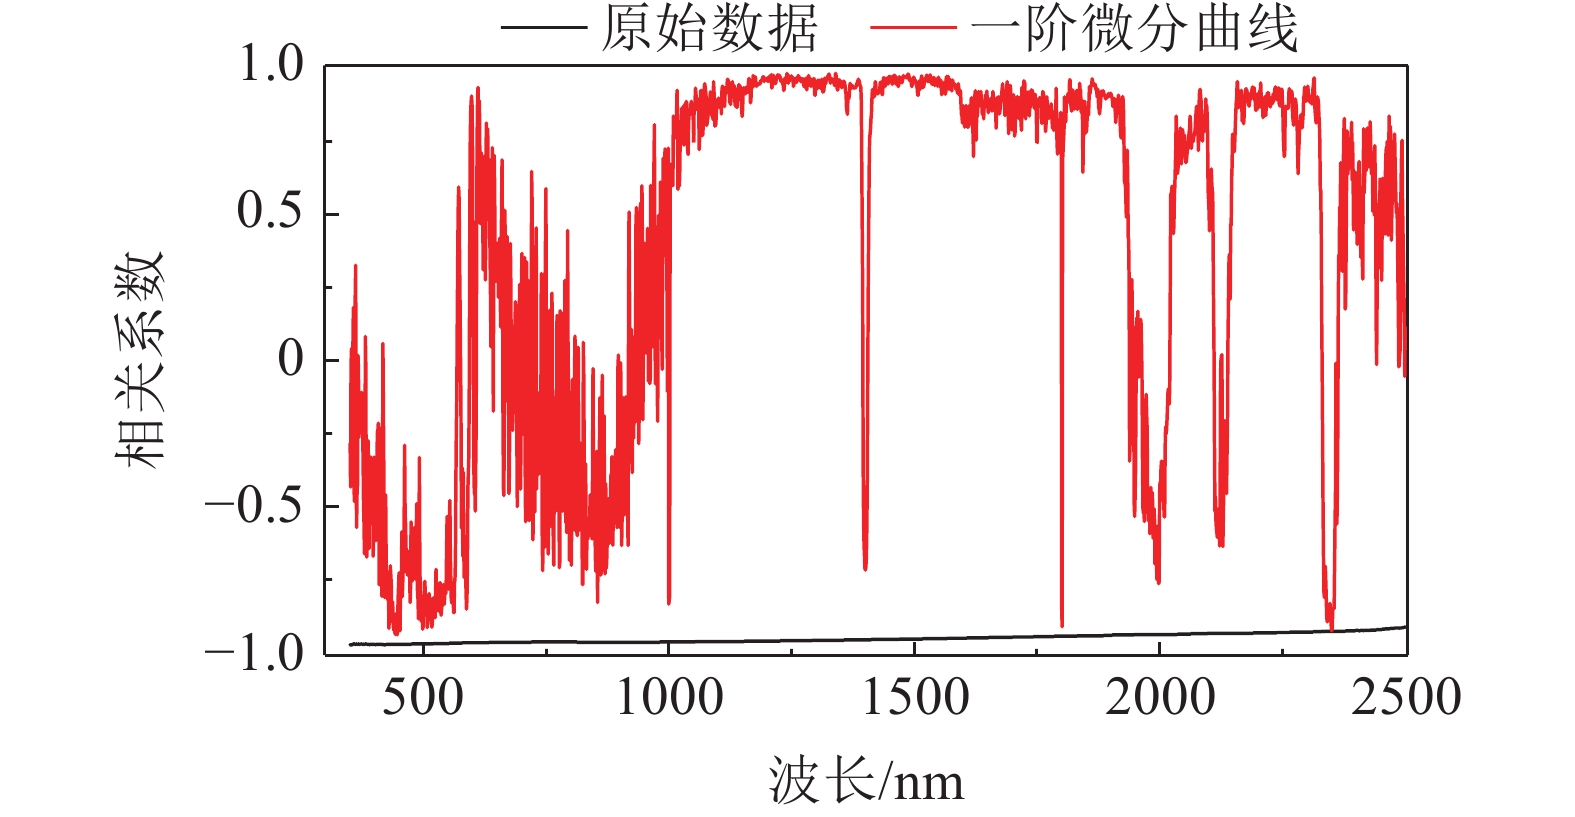
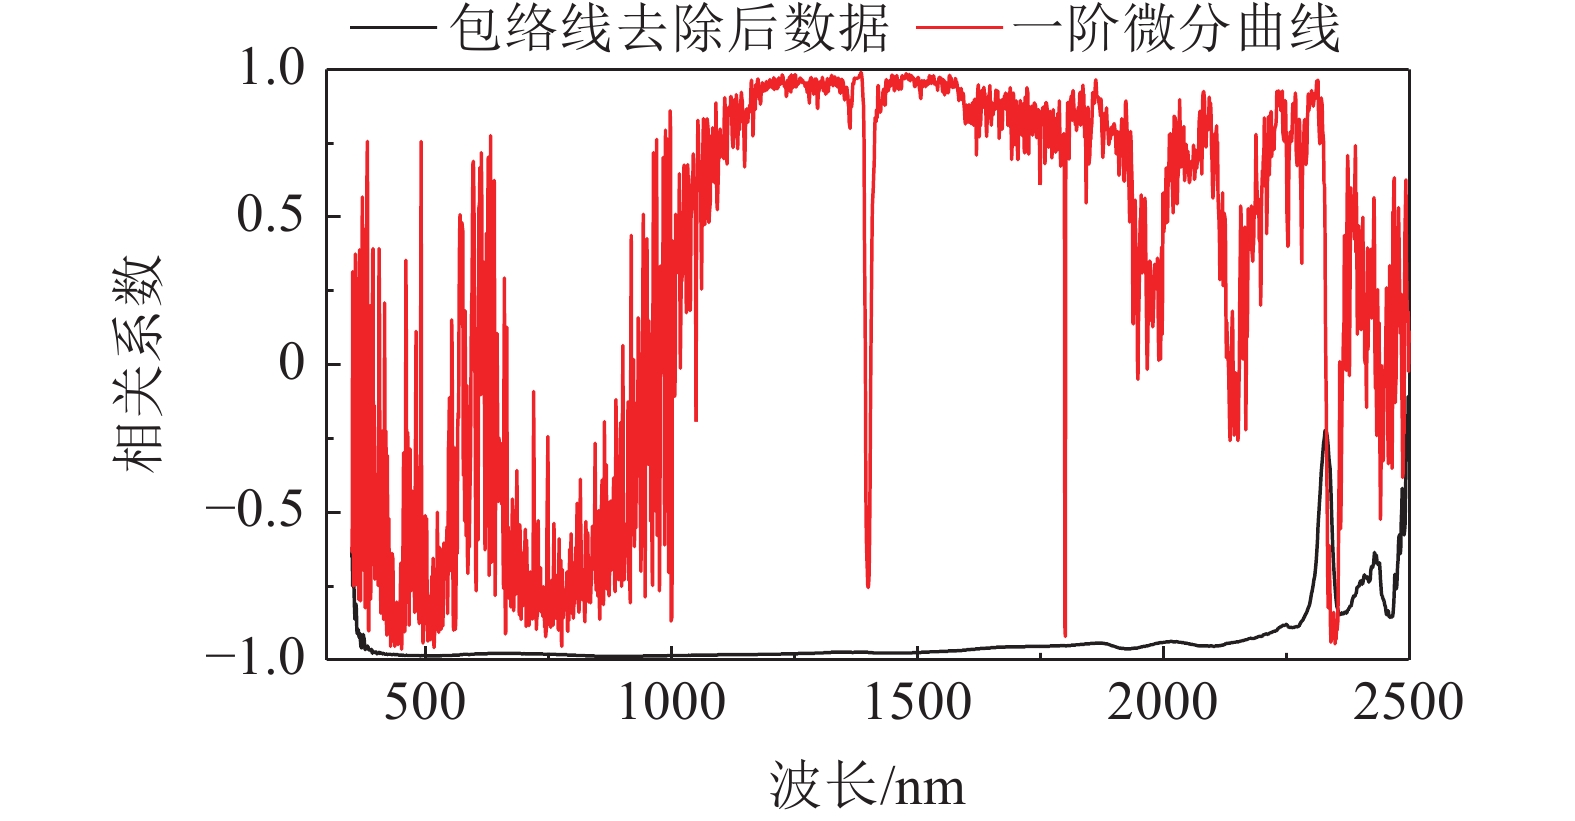
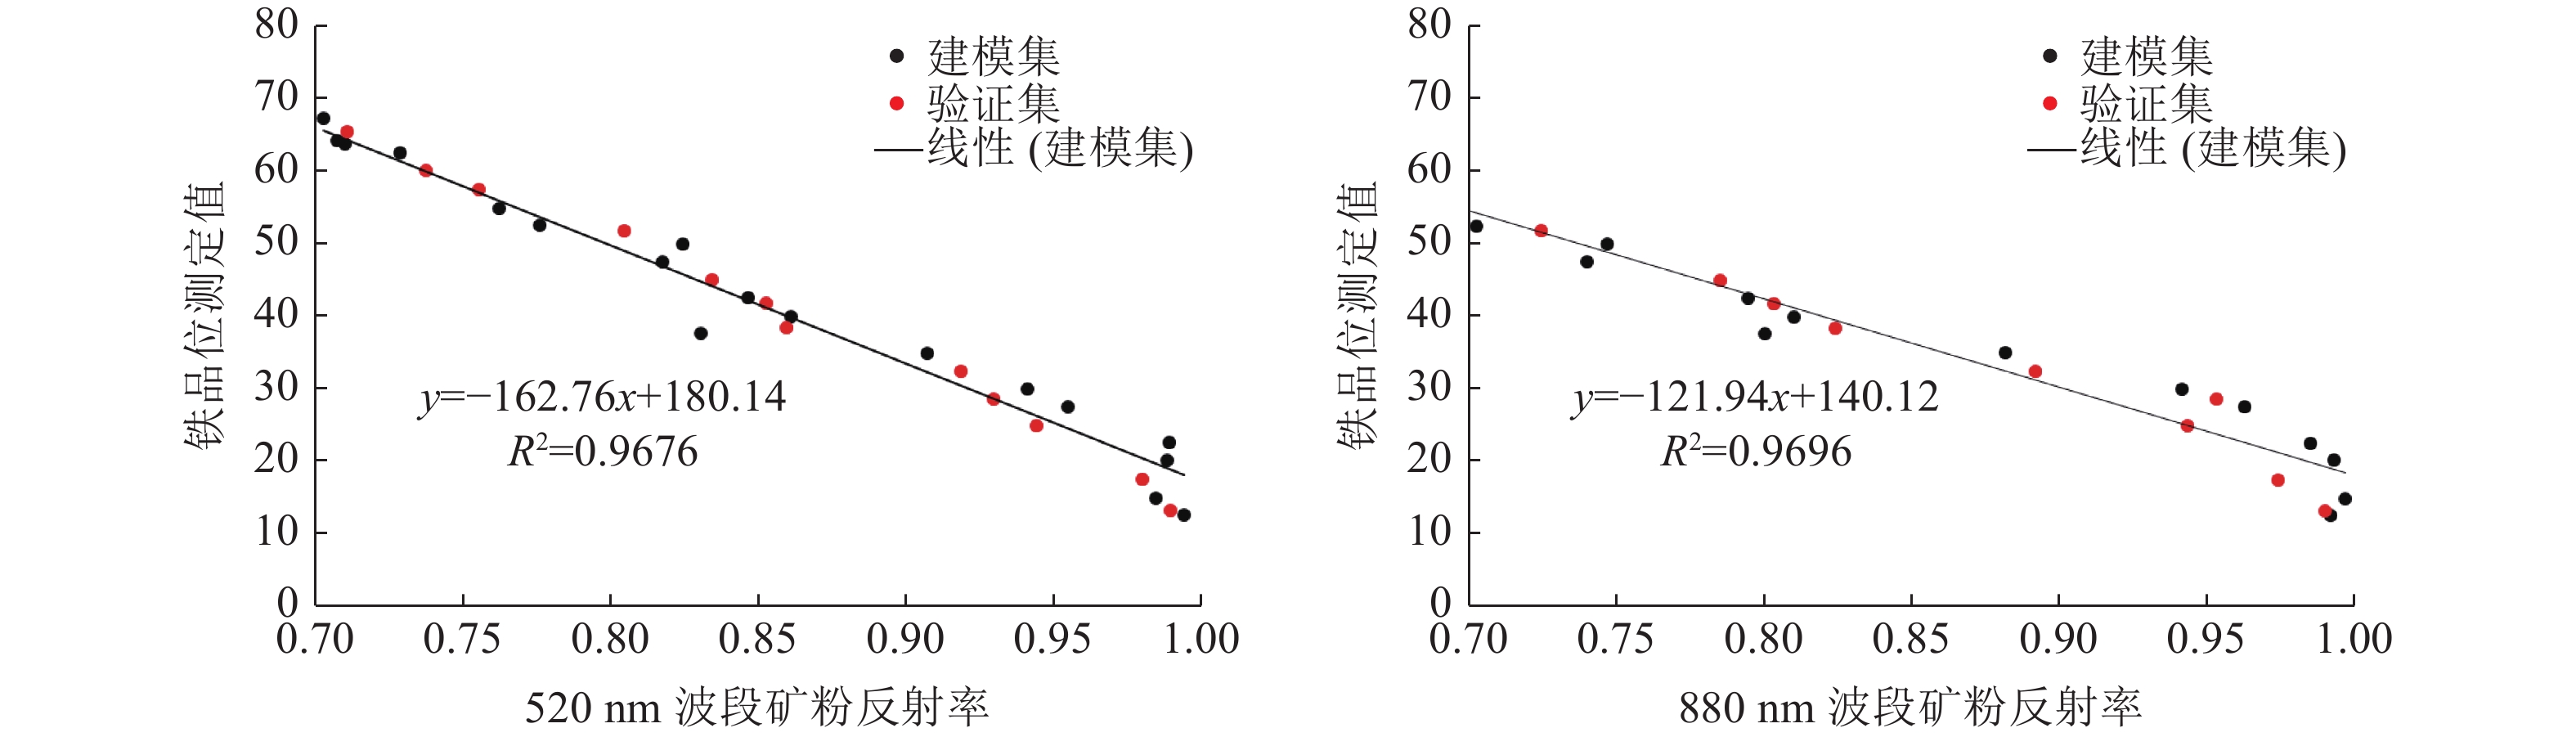
高光谱检测铁矿粉铁含量是一种新技术,具有无损、高效的检测优势。为了研究高光谱识别技术对铁矿选矿粉铁含量测定的精确度,选取了铁矿选矿粉作为测试样本,采集了不同铁含量铁矿选矿粉的高光谱曲线,经过平滑去噪和光谱特征提取后,开展铁含量光谱拟合实验和铁含量的反演研究。研究结果表明:选矿粉铁含量与高光谱曲线高度相关性波段为Fe的强吸收位置517~520 nm和873~888 nm;在吸收位置520 nm左右,进行了基于最小二乘的选矿粉铁含量的建模反演,反演实验结果的拟合度为0.9885,相对误差为7.26%,说明利用高光谱技术进行铁矿粉铁含量检测准确度较高,为高光谱检测铁含量的实际应用提供了理论基础。
Abstract:Hyperspectral detection of iron grade in iron ore dressing powder is a new technology, which has the advantages of nondestructive and efficient test. Some iron ore powders with different grades were selected as test samples in order to test the accuracy of identifying iron grade of iron ore dressing powder by hyperspectral spectroscopy. The hyperspectral curves of the samples were collected,after smoothing denoising and spectral feature extraction, the iron grade spectrum fitting test and iron grade inversion modeling were carried out. The results show that the high correlation between iron grade of iron ore powder and hyperspectral curve is the strong absorption position of Fe, about 517~520 nm and 873~888 nm; The modeling inversion of iron ore grade at about 520 nm based on the least square method is carried out. The determination coefficient of the inversion test results is 0.9885, and the relative error is 7.26%, it shows that the detection accuracy of iron grade of iron ore powder by hyperspectral technology is high, which provides a theoretical basis for the practical application of hyperspectral test of iron grade.
-

-
表 1 铁矿粉样本实测铁含量
Table 1. Measured iron content of iron ore powder samples
名称 编号 HFe1 HFe2 HFe3 HFe4 HFe5 HFe6 训练样本 含量/ % 67.34 64.25 63.68 62.50 54.97 52.51 编号 MFe 1 MFe2 MFe3 MFe4 MFe5 MFe6 含量/ % 49.99 47.50 42.53 39.99 37.72 34.99 编号 LFe1 LFe2 LFe3 LFe4 LFe5 LFe6 含量/ % 30.05 27.57 22.59 20.16 14.94 12.66 验证样本 编号 T1 T 2 T3 T4 T5 T6 含量/ % 65.42 60.00 57.50 51.84 45.00 41.77 编号 T7 T8 T9 T10 T11 T12 含量/ % 38.46 32.50 28.64 24.91 17.54 13.25  下载: 导出CSV
表 2 铁矿石选矿粉的高光谱曲线包络线去除值和铁含量相关系数
Table 2. Hyperspectral curve envelope removal value and iron content correlation coefficient of iron ore beneficiation powder
吸收位置 相关系数 吸收位置 相关系数 517 nm 0.983319 879 nm 0.984586 518 nm 0.983504 880 nm 0.984677 519 nm 0.983682 881 nm 0.984684 520 nm 0.983319 882 nm 0.984686 873 nm 0.98461 883 nm 0.984663 874 nm 0.984607 884 nm 0.984653 875 nm 0.984621 885 nm 0.984687 876 nm 0.984606 886 nm 0.984713 877 nm 0.98455 887 nm 0.984727 878 nm 0.984507 888 nm 0.984689
下载: 导出CSV
表 3 铁含量反演模型预测分析
Table 3. Prediction analysis of iron content inversion model
样本编号 520 nm波段模型 880 nm波段模型 二元模型 实测铁含量/% 预测铁含量/% 实测铁含量/% 预测铁含量/% 实测铁含量/% 预测铁含量/% T1 65.42 64.37 65.42 64.48 65.42 64.48 T2 60.00 59.99 60.00 59.54 60.00 59.74 T3 57.50 57.06 57.50 56.89 57.50 56.98 T4 51.84 49.06 51.84 51.71 51.84 50.75 T5 45.00 44.20 45.00 44.33 45.00 44.29 T6 41.77 41.23 41.77 42.11 41.77 41.79 T7 38.46 40.14 38.46 39.56 38.46 39.77 T8 32.50 30.50 32.50 31.29 32.50 30.98 T9 28.64 28.70 28.64 23.82 28.64 25.60 T10 24.91 26.31 24.91 25.04 24.91 25.48 T11 17.54 20.51 17.54 21.30 17.54 20.97 T12 13.25 18.95 13.25 19.35 13.25 19.16 拟合度 
0.9885 0.9778 0.9845 相对误差  /%
/%7.26 8.10 7.64 去掉后两组样本后相对误差  /%
/%2.72 2.97 2.75 标准误差RMSE/% 2.23 2.57 2.30
下载: 导出CSV
-
[1] 汪金花, 曹兰杰, 白洋, 等. 铁尾矿粒径和湿度因子对高光谱特征参量影响[J]. 矿产综合利用, 2019(2):128-133. doi: 10.3969/j.issn.1000-6532.2019.02.027
WANG J H, CAO L J, BAI Y, et al. Influence of iron tailings' particle size and humidity factor on hyperspectral characteristic parameters[J]. Multipurpose Utilization of Mineral Resources, 2019(2):128-133. doi: 10.3969/j.issn.1000-6532.2019.02.027
[2] 王卫忠. 铁矿石中全铁含量的检测方法对比研究[D]. 南京: 南京理工大学, 2011.
WANG W Z. Comparative study on detection methods of total iron content in iron ore[D]. Nanjing: Nanjing University of Science and Technology, 2011.
[3] 汪金花, 曹兰杰, 徐国强, 等. 混凝土硫酸钠腐蚀产物的高光谱检测方法研究[J]. 光谱学与光谱分析, 2016, 39(6):1724-1730.
WANG J H, CAO L J, XU G Q, et al. Research on the hyperspectral detection method of concrete sodium sulfate corrosion products[J]. Spectroscopy and Spectral Analysis, 2016, 39(6):1724-1730.
[4] 李园, 王振锡, 刘玉霞, 等. 不同时期香梨叶片铁元素含量高光谱反演模型[J]. 西南农业学报, 2019, 32(1):167-174.
LI Y, WANG Z X, LIU Y X, et al. Hyperspectral inversion model of iron content in fragrant pear leaves in different periods[J]. Southwest Agricultural Journal, 2019, 32(1):167-174.
[5] 汪金花, 曹兰杰, 郭云飞, 等. 铁尾矿高-多光谱遥感特征分析与信息识别[J]. 云南大学学报, 2019, 41(5):974-981.
WANG J H, CAO L J, GUO Y F, et al. Feature analysis and information recognition of iron tailings high-multispectral remote sensing[J]. Journal of Yunnan University, 2019, 41(5):974-981.
[6] 曹兰杰, 汪金花, 赵礼剑, 等. 不同矿床类型铁尾矿遥感监测的识别窗口研究[J]. 矿业研究与开发, 2018, 38(7):104-108. doi: 10.13827/j.cnki.kyyk.2018.07.022
CAO L J, WANG J H, ZHAO L J, et al. Research on the identification window of remote sensing monitoring of iron tailings of different deposit types[J]. Mining Research and Development, 2018, 38(7):104-108. doi: 10.13827/j.cnki.kyyk.2018.07.022
-

图(6)
表(3)
计量
- 文章访问数: 932
- PDF下载数: 120
- 施引文献: 0