

-
摘要:
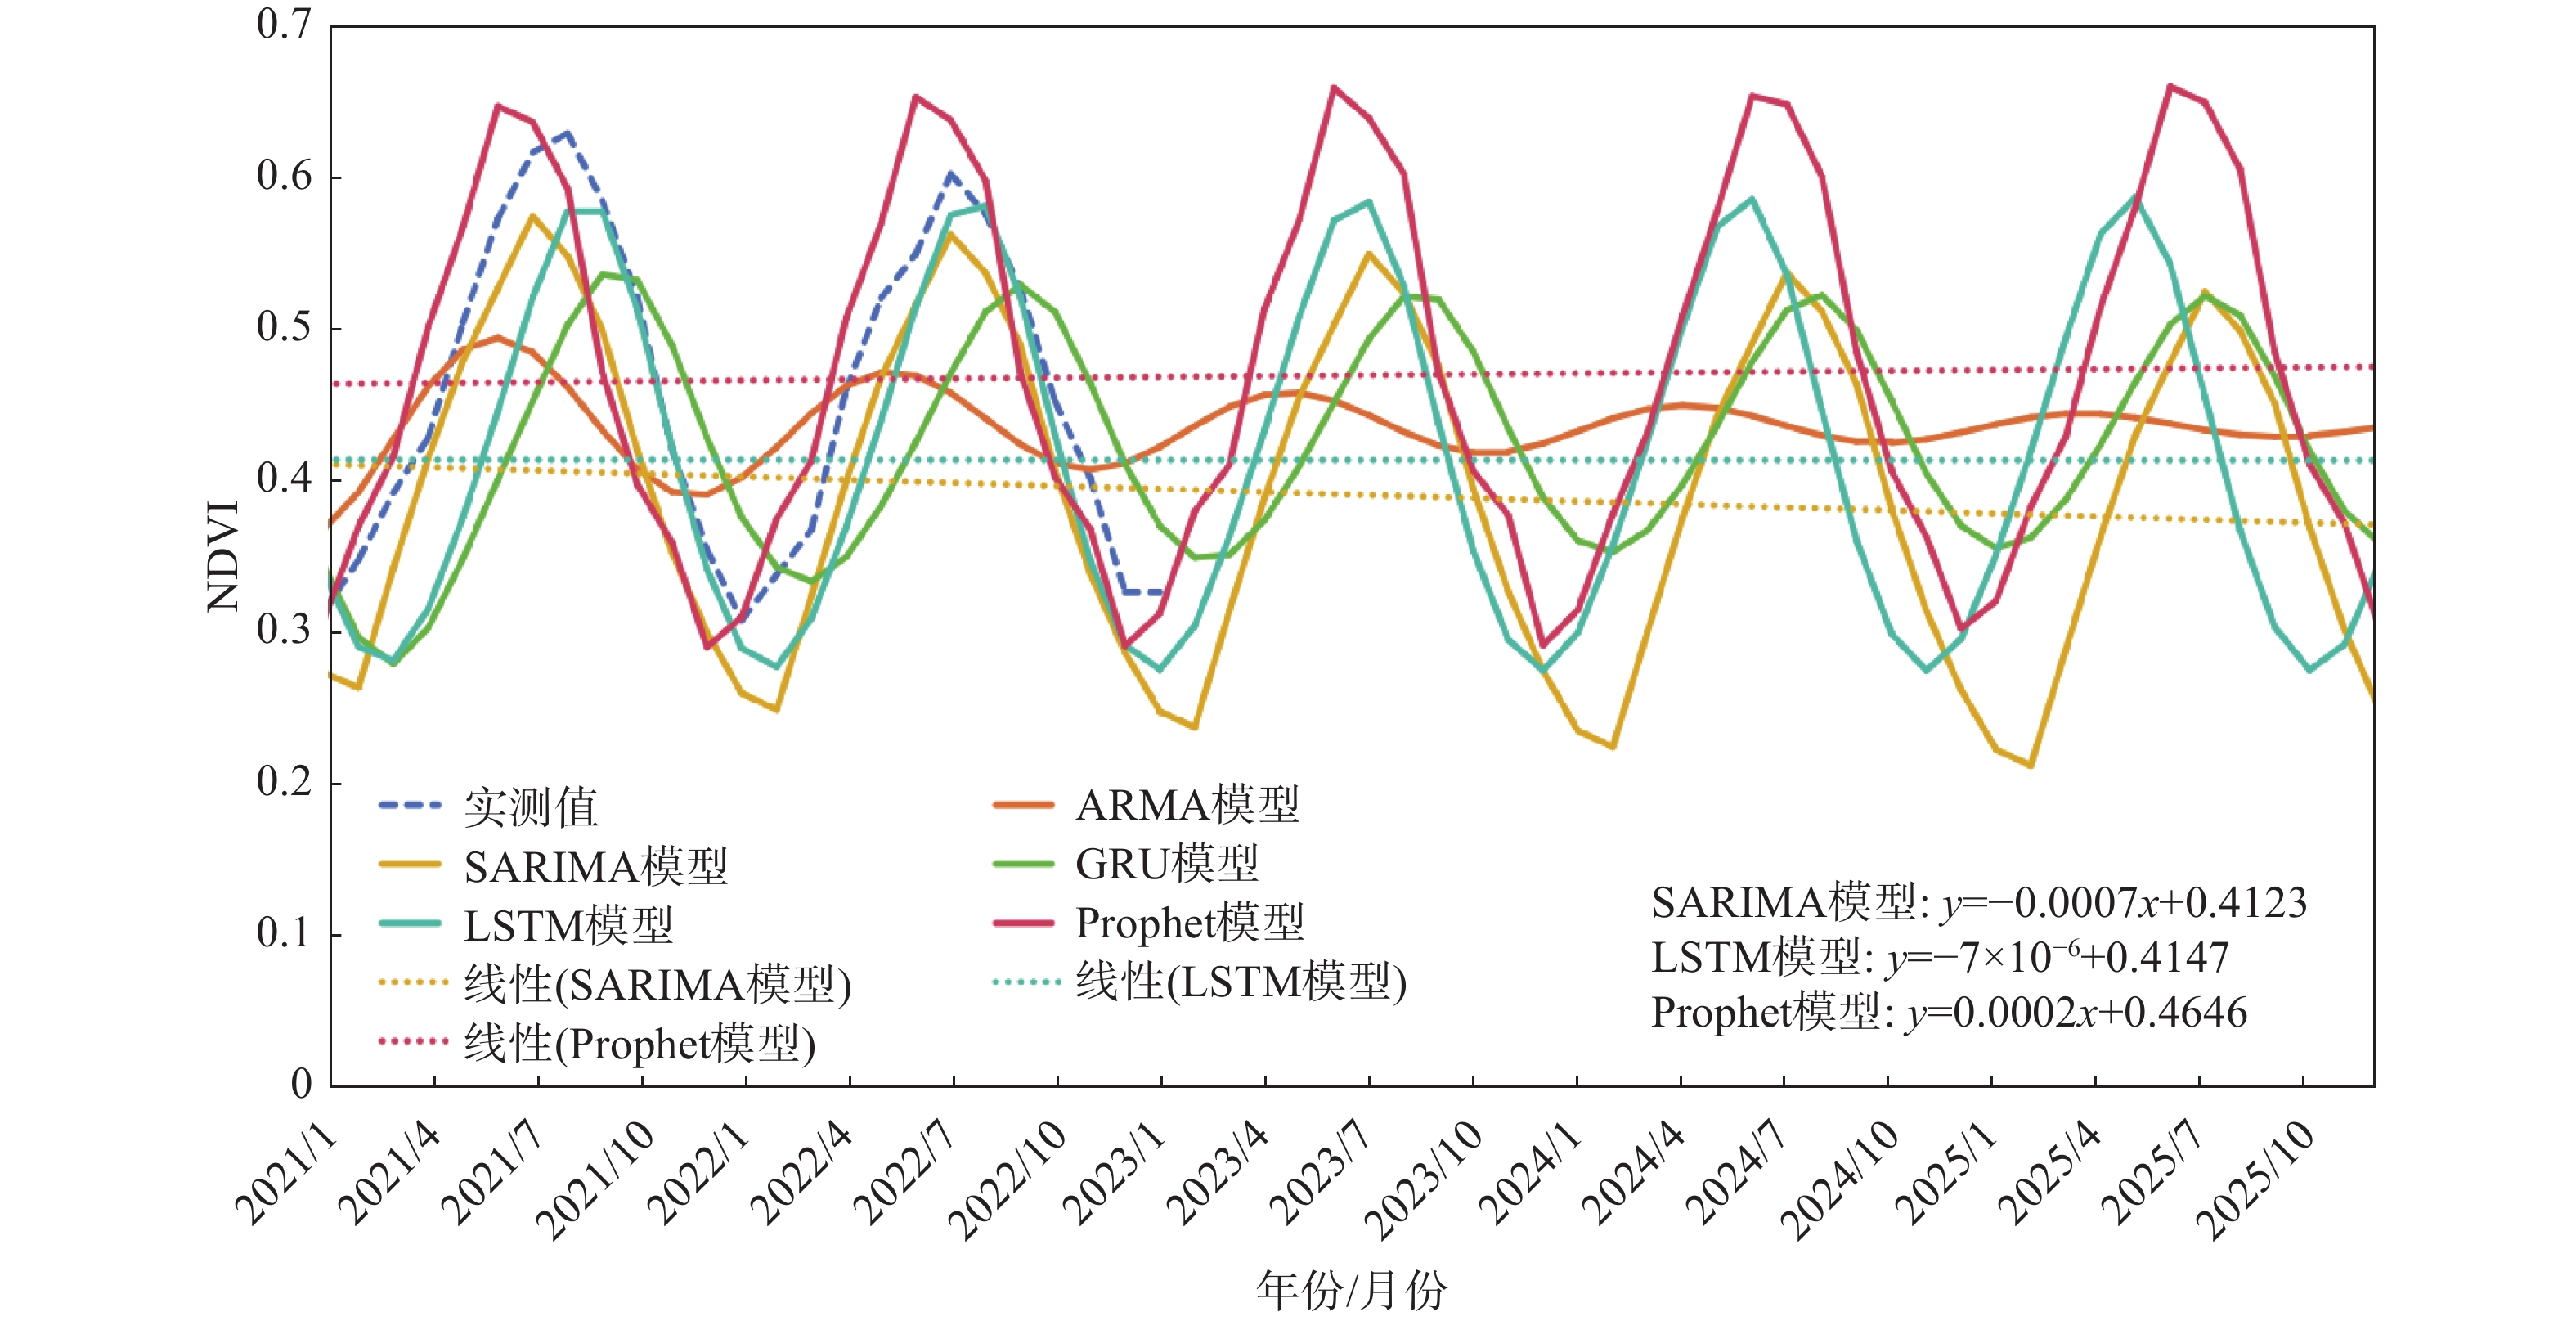
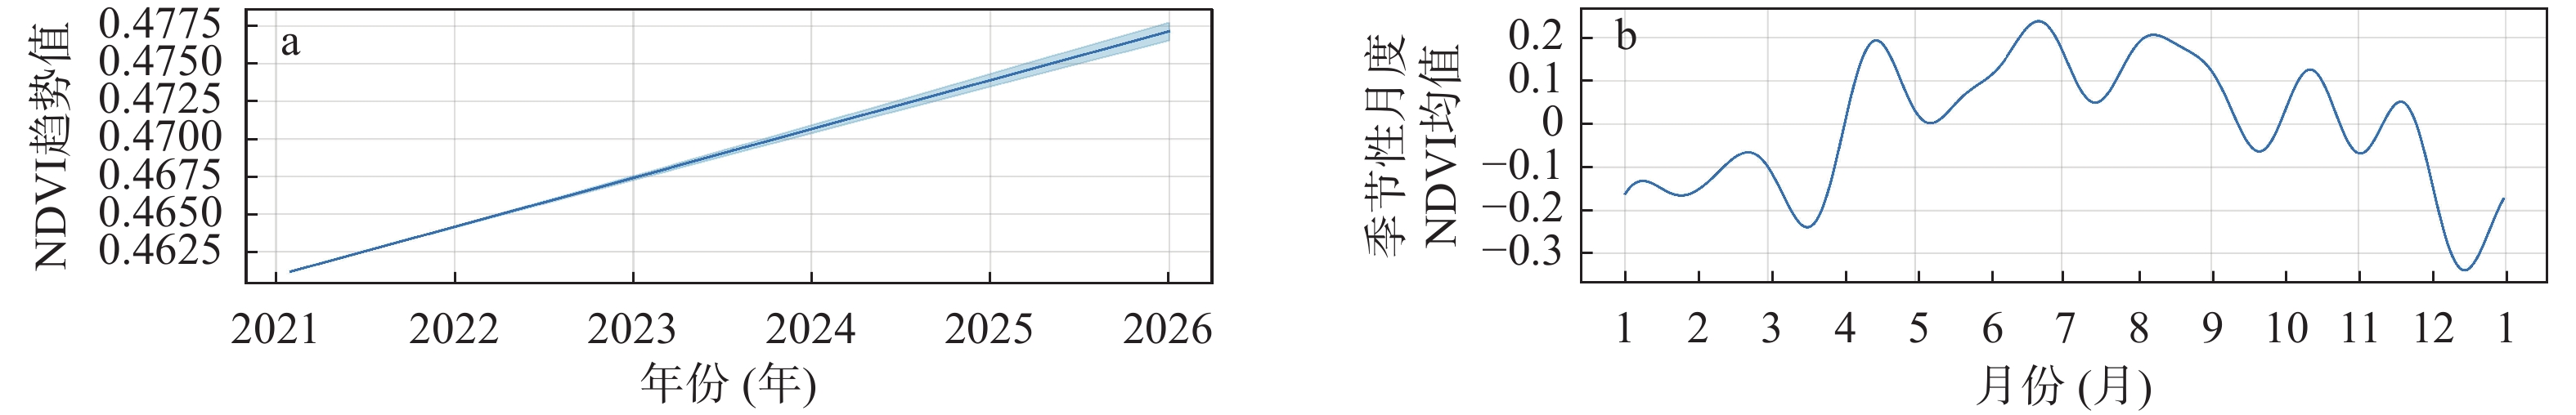
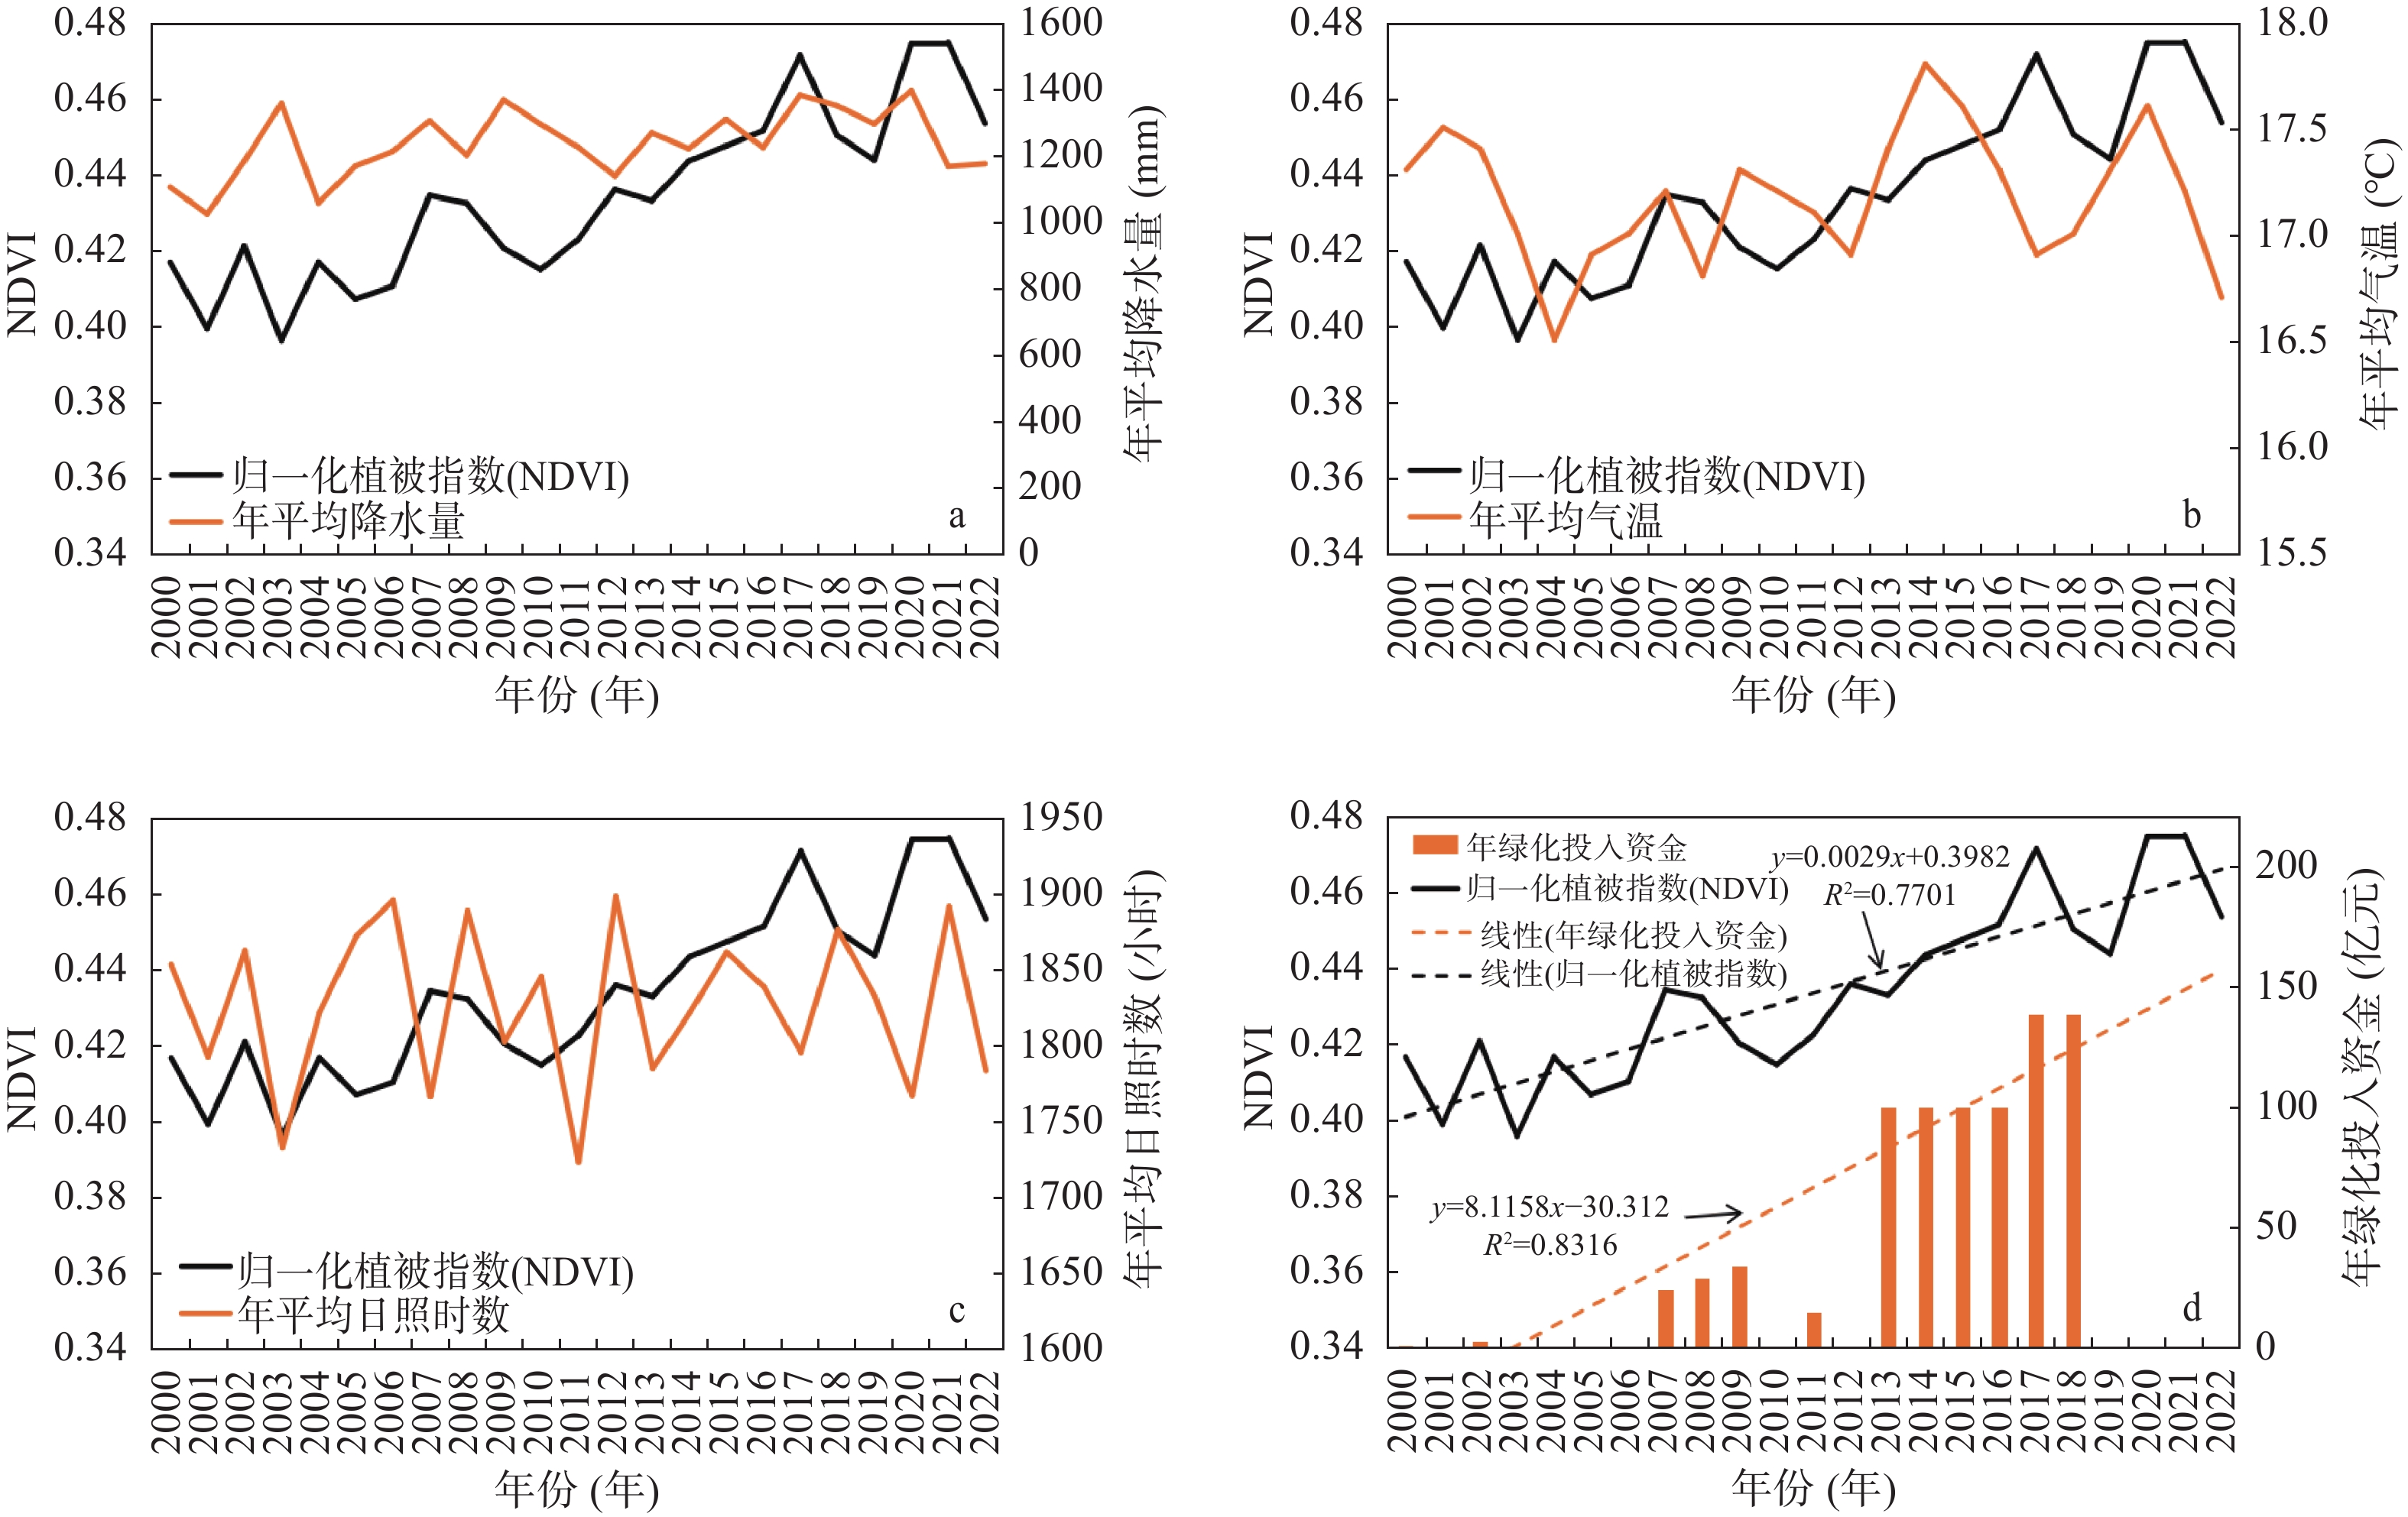
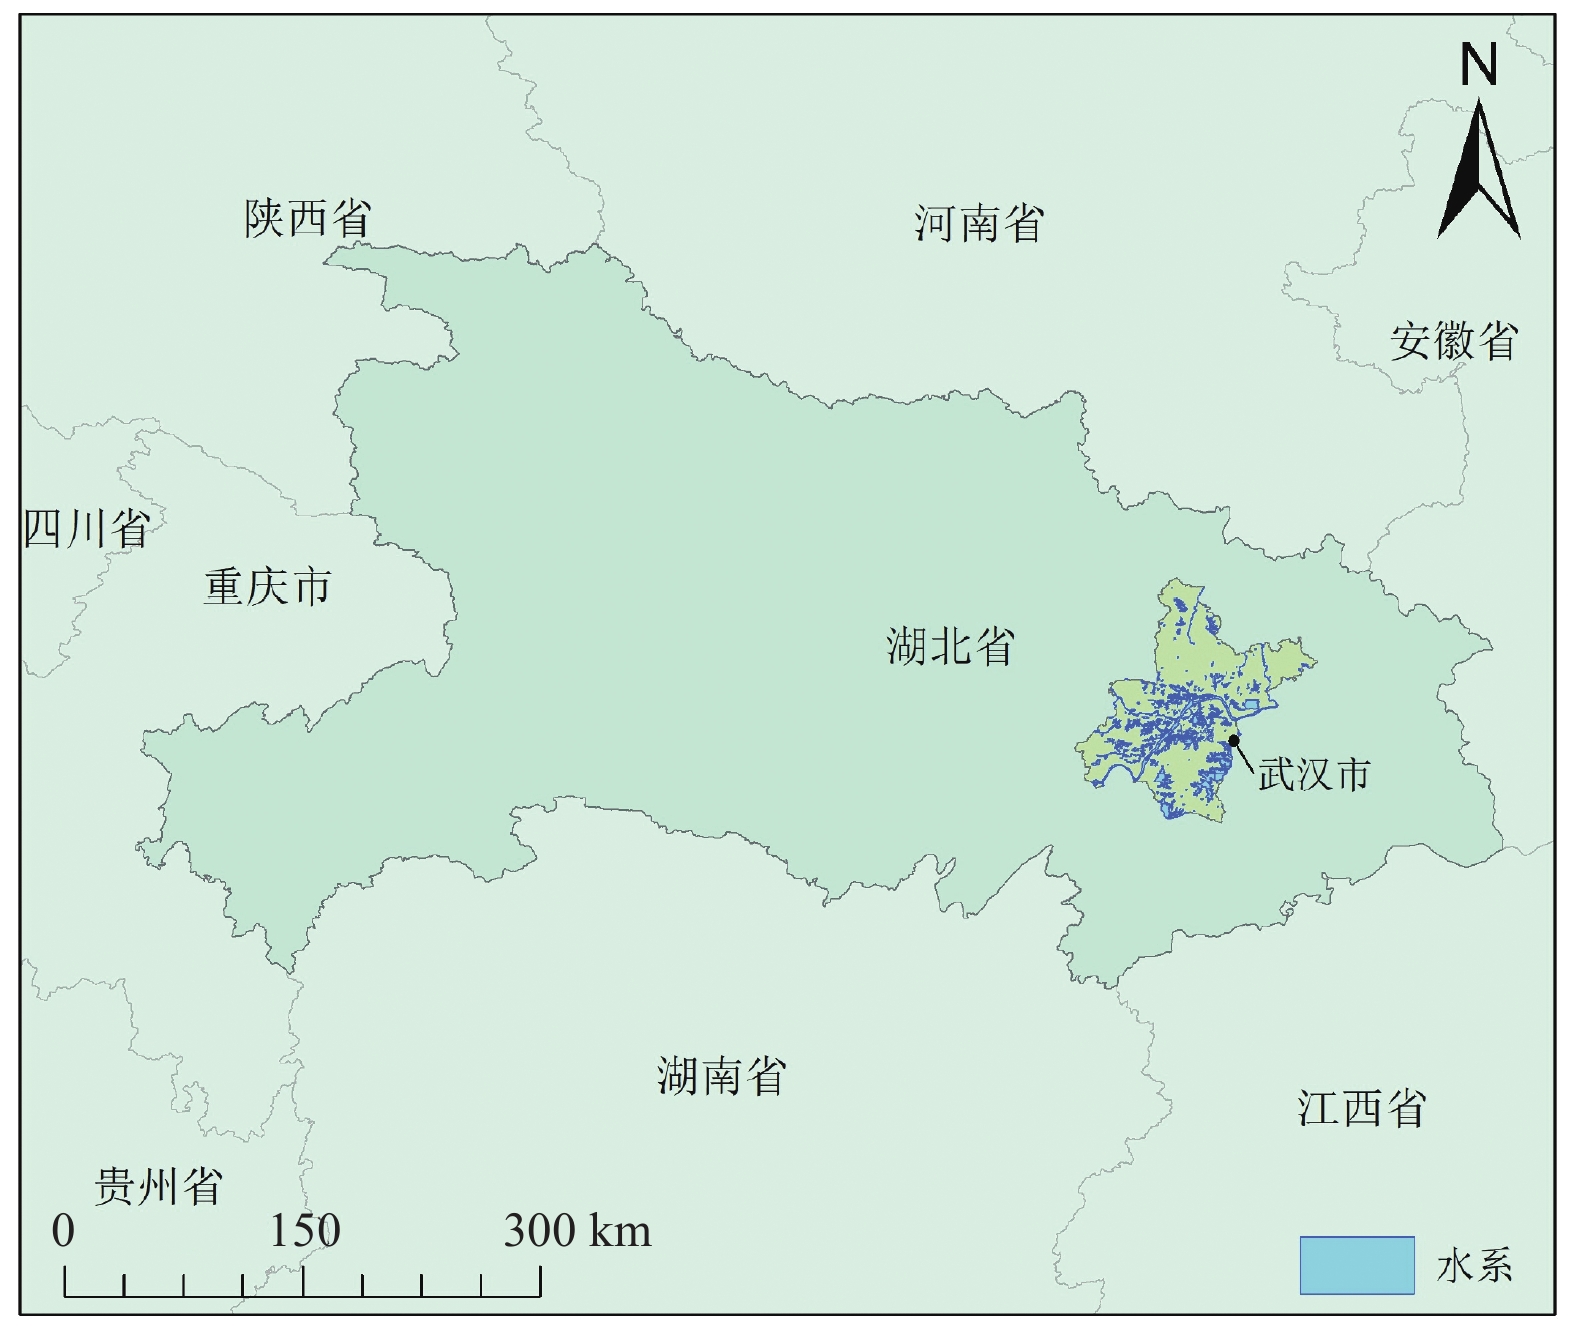
NDVI(Normalized Difference Vegetation Index,归一化植被指数)能有效反映地表植被覆盖程度,研究其时空分布及驱动因子,对生态文明建设具有重要意义。本文利用武汉市2000—2022年MODIS影像计算的NDVI数据,进行时空及相关性分析,结果表明:(1)武汉市NDVI整体呈现增长趋势,市中心城区相对较低,市北部、南部植被覆盖较好;(2)武汉市NDVI在2000—2005年基本稳定,2005—2022年呈现增长,NDVI月度均值呈现负偏态,1-8月为增长趋势,8-12月为降低趋势;(3)武汉市NDVI在2004—2005、2017—2018年呈现明显增长,2007—2008年呈现明显降低,相比2000年,2022年增长明显;(4)时序预测结果显示2021—2025年武汉市NDVI呈现增长趋势,4月-10月NDVI增长对NDVI年度增长贡献明显;(5)NDVI与年降水量存在中等强度正相关,与武汉市绿化资金投入存在较强正相关,绿化资金投入是武汉市NDVI增加的重要原因。
Abstract:NDVI (Normalized Difference Vegetation Index) can effectively reflect vegetation coverage, and can be used to study its spatial and temporal distribution and driving factors, which is of great significance for the construction of ecological civilization. This paper utilizes NDVI data calculated from MODIS images of Wuhan City from 2000 to 2022 to conduct spatial-temporal and correlation analysis. The results show that: 1) The overall NDVI in Wuhan City shows a growing trend, with relatively lower values in the central urban area and better vegetation coverage in the northern and southern parts of the city. 2) The NDVI in Wuhan City remained stable from 2000 to 2005, and increased from 2005 to 2022, with the monthly mean NDVI showing a negative skew, an increasing trend from January to August, and a decreasing trend from August to December. 3) There were significant increases in NDVI in Wuhan City during 2004—2005 and 2017—2018, and a significant decrease during 2007—2008. Compared to 2000, there was a noticeable increase in 2022.4) The time series prediction results indicate that the NDVI in Wuhan City will show a growing trend from 2021 to 2025, with the increase in NDVI from April to October contributing significantly to the annual NDVI growth. 5) There is a moderate positive correlation between NDVI and annual precipitation, and a strong positive correlation between NDVI and the city's greening fund investment which is an important reason for the increase in NDVI in Wuhan City.
-
Key words:
- Wuhan City /
- NDVI /
- spatiotemporal analysis /
- Time Series Forecasting Model /
- correlation analysis
-

-
表 1 皮尔逊相关系数对照表
Table 1. Pearson correlation coefficient comparison table Translation
相关性 负值 正值 无相关性 −0.1~0.0 0.0~0.1 弱相关性 −0.3~−0.1 0.1~0.3 中相关性 −0.5~−0.3 0.3~0.5 强相关性 −1.0~−0.5 0.5~1.0  下载: 导出CSV
-
[1] 董金玮,周 岩,尤南山,程 曹. 2021. 2000—2022年中国30米年最大NDVI数据集[DS/OL]. 国家生态科学数据中心.
[2] 董文雪,曾 源,赵玉金,赵 旦,郑朝菊,衣海燕.2018.机载激光雷达及高光谱的森林乔木物种多样性遥感监测[J]. 遥感学报,22(5):833-847.
[3] 高江波,焦珂伟,吴绍洪.2019.1982-2013年中国植被NDVI空间异质性的气候影响分析[J]. 地理学报,74(3):534-543. doi: 10.11821/dlxb201903010
[4] 湖北省武汉市.2004.武汉市城市绿化条例(2004修订)[J]. 发布日期:2004-07-30,生效日期:2004-07-30.
[5] 黄豪奔,徐海量,林 涛,夏国柱.2022.2001—2020年新疆阿勒泰地区归一化植被指数时空变化特征及其对气候变化的响应[J]. 生态学报,42(7):2798-2809.
[6] 金 凯,王 飞,韩剑桥,史尚渝,丁文斌.2020.1982—2015年中国气候变化和人类活动对植被NDVI变化的影响[J]. 地理学报,75(5):961-974. doi: 10.11821/dlxb202005006
[7] 冷天培,马 刚,殷彦高,谭 瀛,周 伟.2020.基于Prophet模型的江坪河水电站面板堆石坝变形预测[J]. 水力发电,46(6):29-34. doi: 10.3969/j.issn.0559-9342.2020.06.008
[8] 李 俐,许连香,王鹏新,齐 璇,王 蕾.2020.基于条件植被温度指数的夏玉米生长季干旱预测研究[J]. 农业机械学报,51(1):139-147. doi: 10.6041/j.issn.1000-1298.2020.01.015
[9] 李 威,鲁铁定,贺小星,刘 瑞.2021.Prophet模型在GNSS坐标时间序列中的插值分析[J]. 大地测量与地球动力学,41(4):362-367+377.
[10] 李玉辰,李宗省,张小平,杨安乐,桂 娟,薛 健.2023.祁连山国家公园植被时空变化及其对人类活动的响应[J]. 生态学报,43(1):219-233.
[11] 龙思佳,汤媛媛,戴亮亮,乔 双,樊旺东,佘 雄,孔巍巍.2023.基于改进RUSLE模型的西南土石山区水土流失评价——以湖南省龙山县为例[J]. 华南地质,39(4):704-712. doi: 10.3969/j.issn.2097-0013.2023.04.011
[12] 权国荣,孙军刚,李新斌,康成鑫.2023.基于小流域尺度的黄土区不同植被类型对土壤物理性质的影响[J]. 资源环境与工程,37(2):227-233.
[13] 饶姗姗,冷小鹏.2024.基于RSIV-RF模型的凉山州泥石流易发性评价[J]. 地质科技通报,43(1):275-287.
[14] 王伦澈,龚 威,张 淼,马盈盈.2013.武汉地区植被NPP动态监测研究[J]. 武汉大学学报(信息科学版),38(5):548-552.
[15] 武汉市人民政府. 2018. 武汉市城市建设绿色发展实施方案(2018—2020年)(武政[2018]53号)[Z]. 发布日期:2018-10-30.
[16] 杨 倩,刘目兴,王苗苗,张海林,朱 强,易 军.2019.武汉市典型绿地植被类型对表层土壤入渗和持水性能的影响[J]. 长江流域资源与环境,28(6):1324-1333.
[17] 杨艳蓉,侯召朕,张增信.2021.2001-2018年西南地区NDVI变化特征及影响因素[J]. 水土保持通报,41(2):337-344.
[18] 尹梦晗,艾 东,叶 菁.2021.长江经济带中部大都市气候变化与土地利用响应——以武汉市为例[J]. 中国农业大学学报,26(6):126-140. doi: 10.11841/j.issn.1007-4333.2021.06.13
[19] 赵源上,林伟芳.2023.基于皮尔逊相关系数融合密度峰值和熵权法典型场景研究[J]. 中国电力,56(5):193-202
[20] 周丽芸,黄乐清.2024.白垩系古沙漠露头遥感特征及其识别方法——以湘东南地区红层盆地为例[J]. 华南地质,40(2):393-403. doi: 10.3969/j.issn.2097-0013.2024.02.014
[21] Chen Y, Ma L, Liu T X, Huang X, Sun G H. 2023. The Synergistic Effect between Precipitation and Temperature for the NDVI in Northern China from 2000 to 2018[J]. Applied Sciences, 13(14): 8425. doi: 10.3390/app13148425
[22] Guan P, Zheng Y L. 2023. Research on Forest Phenology Prediction based on LSTM and GRU Model[J]. Journal of Resources and Ecology, 14(1): 25-34.
[23] Han J X, Zhang X Y, Wang J H, Zhai J Q. 2023. Geographic exploration of the driving forces of the NDVI spatial differentiation in the Upper Yellow River Basin from 2000 to 2020[J]. Sustainability, 15(3): 1922. doi: 10.3390/su15031922
[24] Jiang L L, Liu W L, Liu B, Yuan Y, Bao A M. 2023. Monitoring vegetation sensitivity to drought events in China[J]. Science of The Total Environment, 893: 164917. doi: 10.1016/j.scitotenv.2023.164917
[25] Sun Y, Lao D Z, Ruan Y J, Huang C, Xin Q C. 2023. A Deep Learning-Based Approach to Predict Large-Scale Dynamics of Normalized Difference Vegetation Index for the Monitoring of Vegetation Activities and Stresses Using Meteorological Data[J]. Sustainability, 15(8): 6632. doi: 10.3390/su15086632
-


图(8)
表(1)
计量
- 文章访问数: 132
- PDF下载数: 9
- 施引文献: 0