

TRACE ELEMENT GEOCHEMISTRY OF THE SOIL IN NEHE CITY, HEILONGJIANG PROVINCE
-
摘要:
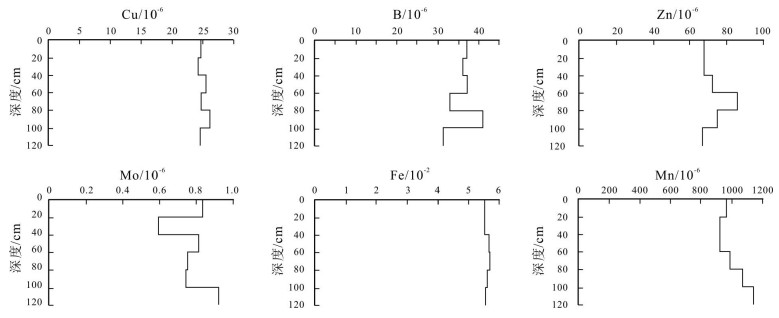
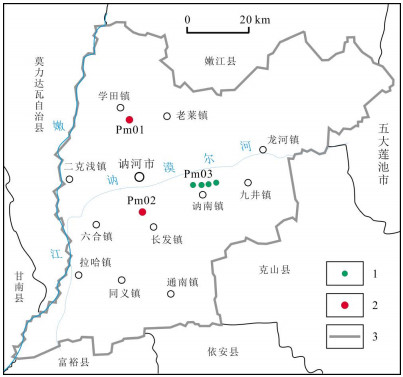
根据东北黑土地1:250000土地质量地球化学调查数据,对黑龙江省讷河市土壤中微量元素B、Cu、Mo、Fe、Mn、Zn元素全量和有效态含量分布特征进行了分析研究.结果显示:①土壤表层Mn元素含量丰富,Fe、Mo元素含量较丰富,B、Cu、Zn元素含量较缺乏;②土壤表层微量元素Cu、Fe、Mn、Zn有效态含量丰富,B有效态含量中等,Mo有效态含量缺乏;③黑土剖面中微量元素淋溶淀积程度明显,表现为以淋溶层较低,表层和淀积层较高,而草甸土淋溶淀积不明显.依据土壤中微量元素全量和有效态含量分布特点,应选择施用微量元素肥料,促进农业可持续发展.
Abstract:The total and available contents of trace elements such as B, Cu, Mo, Fe, Mn and Zn in the soil of Nehe City, Heilongjiang Province, are analyzed and studied based on the 1:250 000 scale geochemical survey data of the quality of black land in Northeast China. The results indicate that the surface soil is characterized by rich Mn, abundant Fe and Mo, and deficient B, Cu and Zn. In terms of available content in surface soil, Cu, Fe, Mn and Zn are abundant, B medium and Mo deficient. The leaching and deposition degree of trace elements in black soil profile is obvious, which is low in the leaching layer and high in the surface and deposition layer, but not evident in meadow soil. According to the distribution characteristics of total and available trace element contents in soil, the trace element fertilizer should be chosen to promote sustainable development of agriculture.
-
Key words:
- soil /
- trace element /
- environmental geochemistry /
- Nehe City /
- Heilongjiang Province
-

-
表 1 微量元素全量测试分析方法及检出限
Table 1. Total volume test analysis of trace elements and detection limit
元素 分析方法 检出限/10-6 B 重叠摄谱法(AES) 1 Cu X射线荧光光谱法(XRF) 0.9 Fe 等离子体发射光谱法(ICP-OES) 0.01 Mn 等离子体发射光谱法(ICP-OES) 0.3 Mo 等离子体质谱法(ICP-MS) 0.1 Zn 等离子体发射光谱法(ICP-OES) 0.3  下载: 导出CSV
表 2 微量元素有效态测试分析方法及检出限
Table 2. Effective state test analysis of trace elements and detection limit
元素 分析方法 检出限/10-6 B 等离子体发射光谱法(ICP-OES) 0.0042 Cu 等离子体质谱法(ICP-MS) 0.018 Fe 等离子体发射光谱法(ICP-OES) 0.0086 Mn 等离子体发射光谱法(ICP-OES) 0.0086 Mo 等离子体质谱法(ICP-MS) 0.0044 Zn 等离子体质谱法(ICP-MS) 0.012
下载: 导出CSV
表 3 讷河市土壤与其他地区土壤微量元素含量平均值对比
Table 3. Comparison of average trace element contents in soil of Nehe City and other areas
微量元素 B Cu Fe Mn Mo Zn 讷河土壤表层 32.0 19.7 3.43 752.5 0.7 57.9 讷河土壤深层 30.1 20.55 3.45 785.89 0.94 59.22 元素富集系数 1.06 0.96 0.99 0.96 0.74 0.98 松辽平原土壤 31.0 18.0 2.7 625 0.61 54.0 比值 1.03 1.09 1.81 1.20 1.15 1.07 东北地区土壤 46.0 22.0 — 840 2.2 85.0 比值 0.70 0.90 0.90 0.32 0.68 东北黑土 36.3 20.1 3.44 656.1 0.81 74.0 比值 0.88 0.98 1.42 1.15 0.86 0.78 全国土壤 64.0 22.0 3.0 710 1.7 100.0 比值 0.50 0.90 1.63 1.06 0.41 0.58 世界土壤 60.0 20.0 3.8 850 2.0 50.0 比值 0.53 0.99 1.29 0.89 0.35 1.16 注:富集系数为土壤表层微量元素含量比深层微量元素含量;比值为讷河土壤表层微量元素含量与对比地区土壤微量元素含量之比.由于分析数据多服从正态分布,因此平均值取指算术平均值.含量单位:Fe为10-2,其余为10-6.
下载: 导出CSV
表 4 不同类型土壤表层微量元素全量
Table 4. Total trace element contents in different types of surface soil
土壤类型 B Cu Fe Mn Mo Zn 暗棕壤 29.83 18.14 4.2 651.38 0.73 50.23 草甸土 29.59 18.63 4.64 669.66 0.69 55.18 黑钙土 33.42 21.65 5.26 953.05 0.58 65.51 黑土 33.87 20.54 5.17 800.89 0.71 60.39 新积土 22.07 15.13 4.08 494.43 0.92 59.11 沼泽土 30.89 18.56 4.44 679.45 0.79 53.79 含量单位:10-6.
下载: 导出CSV
表 5 讷河市表层微量元素的有效态含量
Table 5. Available contents of the surface trace elements in Nehe City
土壤 B Cu Fe Mn Mo Zn 土壤有效态含量/10-6 0.78 4.47 189.2 136.7 0.09 2.83 全国土壤临界值/10-6 0.50 2.00 4.5 7.0 0.15 1.50 活化率/% 2.44 22.69 0.55 18.17 12.86 4.89
下载: 导出CSV
-
[1] 浙江农业大学, 编.植物营养与肥料[M].北京: 中国农业出版社, 2007: 149-156.
[2] 朱立新, 马生明.中国东部平原土壤地球化学基准值、重金属元素异常成因和生态效应[M].北京:地质出版社, 2012:32-34.
[3] 中国科学院林业土壤研究所.中国东北土壤[M].北京:科学出版社, 1980:388-393.
[4] 魏丹, 孟凯.中国东北黑土[M].北京:中国农业出版社, 2017:74-77.
[5] 熊毅, 李庆逵.中国土壤[M].北京:科学出版社, 1987:517-536.
[6] 鲍恩H J M.元素的环境化学[M].崔仙舟, 译.北京: 科学出版社, 1986: 45-46.
[7] 陆继龙, 周永昶, 周云轩.吉林省黑土某些微量元素环境地球化学特征[J].土壤通报, 2002, 33(5):465-368. http://d.old.wanfangdata.com.cn/Periodical/trtb200205012
[8] 王敬国.生物地球化学——物质循环与土壤过程[M].北京:中国农业大学出版社, 2017:372-378.
[9] 张立新, 冯君, 杨治超.吉林省中部黑土中微量元素与分异规律[J].吉林农业大学学报, 1998, 20(3):54-56. http://www.cnki.com.cn/Article/CJFDTotal-JLNY803.015.htm
[10] 刘铮, 朱其清, 唐丽华, 等.我国缺乏微量元素的土壤及其区域分布[J].土壤学报, 1982, 19(3):209-223.
-

图(3)
表(5)
计量
- 文章访问数: 313
- PDF下载数: 5
- 施引文献: 0