

A comprehensive study of the surface rock spectrum test:A case study of Lingqiu area in Shanxi Province
-
摘要:
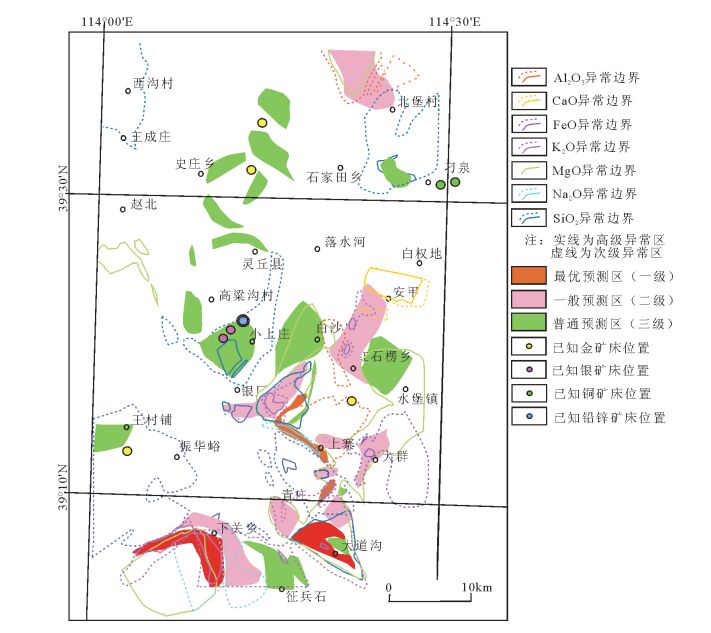
结合区域地质背景,从实测岩矿波谱出发;对实测波谱进行预处理,建立实测波谱库;以岩矿波谱特征理论为指导,以实测样本波谱特征为参照,分析不同矿物波谱具有的特征谱与诊断谱,通过野外岩石样品岩矿鉴定,利用多元线性拟合的方法,从实测波谱中反演氧化物含量,其结果可靠。采用克里金插值法对研究区氧化物进行插值,利用分形理论提取各氧化物异常;采用异常叠加法得到研究区异常集中区。结合化探异常及地质背景,提取了研究区31个找矿远景区。
Abstract:Combined with the regional geological background and starting with the measured spectrums of rocks and minerals, the author first made pretreatment of the measured spectrum and, on such a basis, established the measured spectral library. With the rock and mineral spectral characteristics theory as a guide and the spectral characteristics of the measured sample as the reference, an analysis of different mineral spectrum has a characteristic spectrum and diagnostic fault spectrum; through the rock and mineral identification of the field rock samples, the multiple linear regression method is used for inversion of oxide content from the measured spectrum. The result is reliable. Within the study area oxides are interpolated by Kriging interpolation method, the fractal theory is used for ex-traction of oxide anomaly; with the abnormal superposition method, the anomalous concentration area in the study area is extracted; combined with geochemical anomalies and geological background, 31 ore-searching prospective areas are delineated in the study area.
-
Key words:
- spectrum /
- fractal /
- prospecting /
- Lingqiu in Shanxi Province
-

-
表 1 反演误差分布
Table 1. Inversion error distribution
氧化物 选用波段/μm 相关系数(R2) SiO2 2.3355、0.691、0.5793、1.9256、0.3461、0.7606、0.9358、1.1144、2.1671、1.9363、1.0110、1.9336、2.1597 0.513 CaO 2.3897、1.7516、1.939、2.3355 0.803 MgO 12.561、1.0148、1.1144、1.2774、1.3524、1.3637、1.3749、1.3972、1.4158、1.4307、1.7121、1.8192、1.8333、1.851、1.858、1.8651、1.8756、
1.8861、1.8966、1.9014、1.9041、1.9068、1.9122、1.9175、1.9229、1.9283、1.9309、1.9363、1.9416、1.9523、1.9997、2.0154、2.1024、
2.2061、2.2229、2.254、2.29390.981 Fe2O3 0.4331、0.5557、0.5932、0.6083、0.6438、0.7437、0.7605、0.8151、0.9881、1.0110、1.1144、1.3524、1.3972、1.7121、1.8192、1.8439、
1.8931、1.9041、1.9068、1.9122、1.9175、1.9229、1.9283、1.9390、1.9523、2.0847、2.1572、2.2061、2.2658,0.844 Al2O3 0.3401、0.3476、0.4331、0.4922、0.5793、0.6869、0.7605、0.8151、0.9381、0.9881、1.0110、1.1144、1.3972、1.4307、1.7121、1.8192、
1.8439、1.8931、1.9068、1.9122、1.9175、1.9283、1.9336、1.9390、1.9523、2.0847、2.15970.715 FeO 2.2658、0.8508、1.5414、0.9506、2.2563 0.622 K2O 0.3401、0.3803、0.5876、0.6220、0.7605、1.1258、1.3524、1.3972、1.7121、1.8966、1.9041、1.9068、1.9122、1.9175、1.9229、1.9283、
1.9523、2.1597、2.2061、2.27520.798 TiO2 0.3476、0.4331、0.5793、0.6220、0.7437、0.7605、0.8151、0.9881、1.0110、1.1144、1.3524、1.3972、1.7121、1.8192、1.8439、1.8931、
1.9041、1.9068、1.9122、1.9283、1.9523、2.0847、2.1597、2.2061、2.25160.858 Na2O 0.3401、0.3803、0.4922、0.5876、0.6220、0.6869、0.7580、0.8151、0.9300、0.9881、1.1144、1.3524、1.3637、1.3972、1.4158、1.7121、
1.8192、1.8966、1.9041、1.9068、1.9122、1.9175、1.9202、1.9256、1.9363、1.9523、2.0847、2.1597、2.2061、2.27990.808 P2O5 0.3476、0.4331、0.5793、0.6220、0.7280、0.7605、0.8151、0.9300、0.9881、1.0110、1.3524、1.3972、1.4307、1.7121、1.8966、1.9041、
1.9068、1.9122、1.9175、1.9202、1.9229、1.9283、1.9363、1.9523、2.0847、2.1597、2.2061、2.24680.729 MnO 0.3476、0.4331、0.4922、0.5793、0.6220、0.6869、0.7437、0.7605、0.8151、0.9381、0.9881、1.0110、1.1144、1.3524、1.3972、1.7121、
1.8192、1.8439、1.8931、1.9041、1.9068、1.9122、1.9175、1.9229、1.9283、1.9336、1.9390、1.9523、2.0023、2.0847、2.1597、2.2061、2.25160.773  下载: 导出CSV
表 2 反演误差分布
Table 2. Inversion error distribution
误差范围 SiO2 CaO MgO Fe2O3 Al2O3 FeO K2O TiO2 Na2O P2O5 MnO 15%以内 45.0 15.0 45.0 22.5 32.5 5.0 27.5 42.5 22.5 20.0 37.5 35%以内 77.5 40.0 65.0 47.5 62.5 12.5 55.0 60.0 47.5 40.0 70.0 100%以内 85.0 72.5 82.5 72.5 82.5 35.0 62.5 80.0 60.0 82.5 92.5
下载: 导出CSV
-
[1] Gaffey S J. Spectral reflectance of carbonates minerals in the visible and near infrared(0.35~2.55microns):calcite, aragonite, and dolomite[J]. American Mineralogist, 1986, 71:151-162.
[2] Bierwirth P, Husion D, Bkwett R. Hyperspectral Mapping of Miner-al Assemblages Associated with Gold Mineralization in the Cengral Pilbrar, Western Australlia[J]. Econcomic Gology, 2002, 97:819-826. doi: 10.2113/gsecongeo.97.4.819
[3] 王润生, 甘甫平, 闰柏棍, 等.高光谱矿物填图技术与应用研究[J].国土资源遥感, 2010, (1):1-13. doi: 10.6046/gtzyyg.2010.01.01
[4] 王翔, 范海明.山西省晋东北地区燕山期岩浆岩热液型多金属矿床地质特征[M].北京:中国地质出版社, 2013:85-176.
[5] Zhang B P, Zhang Y M. Application of remote sensing alteration in-formation extraction to copper and iron deposit exploration in Ban-changou region, westernTianshan[J]. Mineral Resources and Geolo-gy, 2007, 21(1):90-93. http://en.cnki.com.cn/Article_en/CJFDTotal-KCYD200701020.htm
[6] Crosta A P, Sabine C, Taranik J V. Hydrothermalaltertion mapping at Bodie, California, Using AVIRIS hypersperctral data[J]. Remote sensing Environ, 1998, 65:309-319. doi: 10.1016/S0034-4257(98)00040-6
[7] Crowl E Y, James K, Hubbard B E, et al. Hydrothermal alteration on the cascade strato volcanoes:A remote sensing survey[J]. Geologi-cal Society of America Abstracts with Programs, 2003, 35(6):552. https://www.mendeley.com/research-papers/hydrothermal-alteration-cascade-stratovolcanoes-remote-sensing-survey/
[8] Hunt G R, Salisbury J W. Visible and nearinfrared spectra of miner-als and rocks:Isilicate Minerals[J]. Modern Geology, 1970, 1:283-300.
[9] Hunt G R, Salisbury J W, Lenhoff G J. Visible and near infrared spectra ofminerals and rocks:Ⅲ Oxides and hydroxides[J]. Modern Geology, 1978, 2:195-205.
[10] 张琴. 地表岩石中Fe2O3和SiO2的遥感定量反演研究[D]. 吉林大学博士学位论文, 2013.
[11] 苏红军, 杜培军.高光谱数据特征选择与特征提取研究[J].遥感技术与应用, 2006, (4):288-293. doi: 10.11873/j.issn.1004-0323.2006.4.288
[12] Wang X P, Xie Z Q, Wu Y Z. Information extraction of mineral-izing alteration from etm space image:Taking Taxk organ Area of West Kunlun Mountain as an Example[J]. Geology and Resources, 2002, 11(2):119-122.
[13] Imbroane A, Melenti C, Gorgan D. Mineral Exploration by Land-sat Image Ratios[C]//Ninth International Symposium on Symboli-cand Numeric Algorithms for Scientific Computing, 2008:335-340.
[14] Tseng D C, Lai C C. A genetic algorithm for MRF-based segmen-tation of multispectral textured images[J]. Pattern Recognition Let-ters, 1999, 20:1499-1510. doi: 10.1016/S0167-8655(99)00117-8
[15] 王亚飞, 钱乐祥, 刘含海.地物光谱曲线特征点的提取和应用[J].河南大学学报(自然科学版), 2006, (36):37-70. http://www.cnki.com.cn/Article/CJFDTOTAL-HDZR200604016.htm
[16] Hunt G R, Ashley R P. Spectra of Altered Rocks in the Visible and NearInfrared[J]. Economic Geology, 1979, 74:1613-1629. doi: 10.2113/gsecongeo.74.7.1613
[17] Hunt G R. Spectroscopic Properties of Rocks and Minerals[C]//Carmichael R C. Practical Handbook of Physical Properties of Rock sand Minerals. Boca Raton Florid:CRC Press Inc, 1989:599-669.
[18] 曾怀恩, 黄声享.基于Kriging方法的空间数据插值研究[J].测绘工程, 2007, (05):5-8+13. doi: 10.3969/j.issn.1006-7949.2007.05.002
[19] 张军, 王茂芝, 陈聆, 等.插值算法在高光谱数据中的应用[J].四川理工学院学报(自然科学版), 2012, (3):43-46. http://www.cnki.com.cn/Article/CJFDTOTAL-SCQX201203012.htm
[20] 赵鹏大, 池顺都.初论地质异常[J].地球科学-中国地质大学学报, 1991, 16(3):241-248. http://www.cnki.com.cn/Article/CJFDTOTAL-DQKX200102005.htm
[21] 赵鹏大, 王京贵, 饶明辉, 等.中国地质异常[J].地球科学(中国地质大学学报), 1995, 20(2):117-12. http://www.cnki.com.cn/Article/CJFDTOTAL-DQKX502.000.htm
[22] 张焱, 周永章, 姚凌青, 等.多重分形与地质统计学方法在粤北刘家山地区矿化指示中的应用[J].地学前缘, 2012, 19(4):151-158. http://www.cnki.com.cn/Article/CJFDTOTAL-DXQY201204017.htm
[23] Shen W, Zhao P D. The theoretical study of statistical fractal mod-el and its application in mineral resource prediction[J]. Computers& Geosciences, 2002, 28(3):369-376. http://www.sciencedirect.com/science/article/pii/S0098300401000528
[24] 范海明.基于适宜性模型多元信息成矿预测研究[J].科技创新与生产力, 2013, (6):35-37. http://www.cnki.com.cn/Article/CJFDTOTAL-TAIY201306037.htm
[25] 范海明, 暴玉.基于多因子评判(MCE)法的灵丘地区铜矿预测[J].华北国土资源, 2014, 3:102-104. doi: 10.3969/j.issn.1672-7487.2014.01.075
[26] Jia Y H, Li D R, Jia B S. Data Fusion Techniques for Multisources Remotely Sensed Imagery[J]. Remote Sensing Technology And Application, 2000, 15(1):41-44. http://en.cnki.com.cn/Article_en/CJFDTOTAL-YGJS200001009.htm
① 王润生, 闫柏琨, 刘圣伟, 等. 岩矿遥感信息定量化技术研究.中国国土资源航空物探遥感中心, 2007.
-
图(1)
表(2)
计量
- 文章访问数: 582
- PDF下载数: 7
- 施引文献: 0