

Distribution, reserves and pollution evaluation of nitrogen and phosphorus in surface sediments of Baiyangdian Lake
-
摘要:
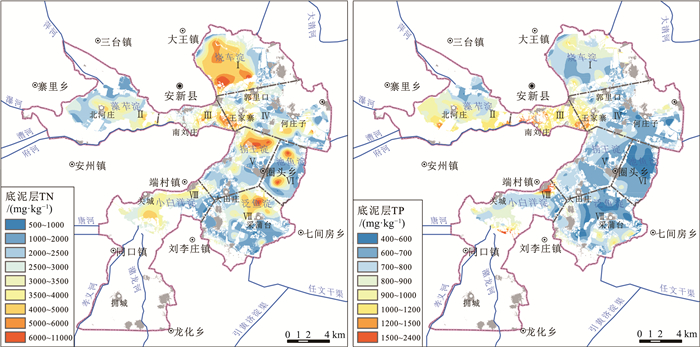
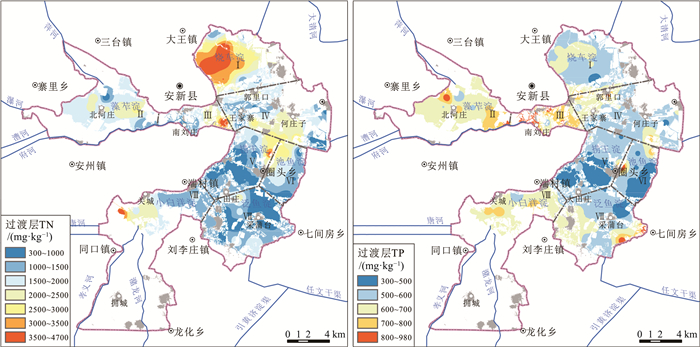
白洋淀是雄安新区核心生态功能区,为查明白洋淀表层沉积物氮磷分布特征、储量及污染程度,系统开展了氮磷营养盐调查及污染评价。结果表明:白洋淀底泥层总氮含量为528.5~10566.5 mg/kg,均值为2859.91 mg/kg,总磷含量为425.7~2446.0 mg/kg,均值为789.22 mg/kg;过渡层总氮含量为318.5~4662.0 mg/kg,均值为1706.7 mg/kg,总磷含量为315.05~976.30 mg/kg,均值为598.97 mg/kg;表层沉积物总氮总储量为15.86×104 t,其中底泥层总氮储量为3.76×10⁴ t,过渡层总氮储量为12.10×10⁴ t;总磷总储量为5.54×10⁴ t,其中底泥层总磷储量为1.02×10⁴t,过渡层总磷储量为4.52×10⁴ t。根据综合污染指数法评价结果,白洋淀湿地底泥层氮磷污染程度均为重度,过渡层除烧车淀为重度外,其余各淀泊均为中度或轻度。
Abstract:Baiyangdian Lake is the main ecological function area of Xiong'an New Area.In order to find out the distribution characteristics of nitrogen and phosphorus in the surface sediments of Baiyangdian Lake and evaluate the pollution degree of nitrogen and phosphorus, we carried out the investigation and pollution assessment of nitrogen and phosphorus in Baiyangdian Lake.The results indicate that the total nitrogen(TN)content of sludge layer of surface sediments are 528.5~10566.5 mg/kg, and the average is 2859.91 mg/kg.The total phosphorus(TP)content of sludge layer is 425.7~2446.0 mg/kg, and the average is 789.22 mg/kg.The TN content of transition layer is 318.5~4662.0 mg/kg, and the average is 1706.7 mg/kg.The TP content of transition layer is 315.05~976.30 mg/kg, and the average is 598.97 mg/kg.The total TN reserves of surface sediments are 15.86×10⁴ t, among which the TN reserves of sludge layer are 3.76×10⁴ t and the TN reserves of transition layer are 12.10×10⁴ t.The total TP reserves of surface sediments are 5.54×10⁴ t, among which the TP reserves of sludge layer are 1.02×10⁴t and that of transition layer are 4.52×10⁴ t.According to the evaluation result of comprehensive pollution index method, the sludge layer of surface sediments in Baiyangdian Lake have been heavily polluted.As for the transition layer, except Shaoche Lake, which is severely polluted, the other lakes are all moderately polluted or slightly polluted.
-
Key words:
- Baiyangdian Lake /
- surface sediments /
- nitrogen and phosphorus /
- reserves /
- pollution evaluation
-

-
表 1 沉积物综合污染程度分级标准
Table 1. Classification standard for comprehensive pollution degree of sediments
等级 STN STP FF 污染程度 1 <1.0 <0.5 <1.0 清洁 2 1.0~1.5 0.5~1.0 1.0~1.5 轻度污染 3 1.5~2.0 1.0~1.5 1.5~2.0 中度污染 4 >2.0 >1.5 >2.0 重度污染  下载: 导出CSV
表 2 白洋淀各亚区底泥层TN、TP含量
Table 2. Statistics of TN and TP content in the sludge layer of surface sediments of Baiyangdian Lake
组分 含量/(mg·kg-1) 淀区
n=267藻苲淀
n=36烧车淀
n=39南刘庄
n=19王家寨
n=44捞王淀
n=31泛鱼淀
n=51池鱼淀
n=19小白洋淀
n=28入淀河流
n=14TN 均值 2859.91 2677.53 3731.32 3267.89 2694.24 2716.23 2509.94 2472.42 2923.57 2009.14 最小值 528.50 1029.00 919.00 891.00 618.50 1057.00 723.50 528.50 628.00 896.00 最大值 10566.50 4682.50 10566.50 6248.50 5820.00 6724.50 7099.50 7059.00 4656.00 3633.00 Cv 50.2% 29.7% 50.6% 42.3% 48.2% 52.4% 53.0% 74.6% 36.9% 46.68% TP 均值 789.22 870.67 775.27 1135.49 748.13 709.85 703.69 620.56 891.66 1008.17 最小值 425.70 587.70 581.35 743.20 511.30 572.60 435.10 425.70 502.00 719.50 最大值 2446.00 1337.40 1138.70 1808.65 1375.70 887.10 1072.00 860.30 2446.00 1386.30 Cv 29.5% 20.4% 17.8% 20.7% 22.6% 9.4% 20.3% 15.4% 49.0% 16.84%
下载: 导出CSV
表 3 中国东部主要湖泊表层沉积物TN、TP含量对比
Table 3. Comparison of TN and TP content in surface sediments of major lakes in Eastern China
下载: 导出CSV
表 4 白洋淀各亚区过渡层TN、TP含量统计
Table 4. Statistics of TN and TP content in the transition layer of surface sediments of Baiyangdian Lake
组分 含量/(mg·kg-1) 全淀区
n=90藻苲淀
n=11烧车淀
n=13南刘庄
n=6王家寨
n=16捞王淀
n=13池鱼淀
n=9泛鱼淀
n=14小白洋淀
n=8TN 均值 1706.81 1763.00 2633.69 2134.17 1613.25 1297.54 1513.11 1120.64 1898.75 最小值 319.00 559.00 1080.00 658.00 319.00 567.00 544.00 400.00 1015.00 最大值 4662.00 2883.00 4662.00 4218.00 2998.00 3704.00 2822.00 2345.00 3795.00 Cv 58.96% 37.06% 49.00% 58.45% 54.25% 71.02% 52.26% 60.57% 46.15% TP 均值 598.97 677.73 588.38 778.50 588.63 481.33 550.61 582.45 668.38 最小值 315.00 508.00 315.00 541.00 442.60 335.80 384.20 348.30 560.00 最大值 976.00 874.00 779.00 976.00 841.00 608.80 958.40 841.00 747.00 Cv 22.01% 15.80% 19.38% 18.21% 16.67% 16.30% 33.30% 18.58% 9.49%
下载: 导出CSV
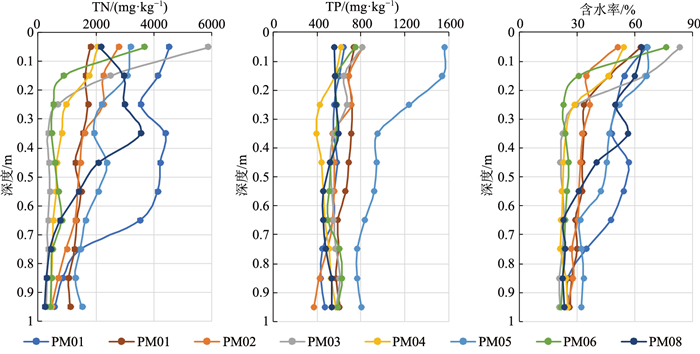
表 5 各垂向剖面底泥层和过渡层厚度
Table 5. Thickness of sludge layer and transition layer of each vertical section
m 层位 PM01 PM02 PM03 PM04 PM05 PM06 底泥层 0.20 0.06 0.20 0.23 0.57 0.12 过渡层 0.42 0.34 0.30 0.42 0.33 0.35
下载: 导出CSV
表 6 白洋淀各亚区表层沉积物平均含水率和自然干密度计算结果
Table 6. Calculation results of surface sediment mean moisture content and natural dry density in each sub-area of Baiyangdian Lake
亚区 面积 厚度/m 表层含水率 平均含水率 平均自然干密度/(103 kg·m-3) 底泥层 过渡层 底泥层 过渡层 底泥层 过渡层 底泥层 过渡层 藻苲淀 22.09 0.11 0.42 0.49 0.31 0.49 0.29 0.74 1.23 烧车淀 24.89 0.15 0.55 0.53 0.40 0.51 0.36 0.69 1.03 南刘庄 5.24 0.21 0.35 0.64 0.35 0.60 0.34 0.53 1.10 王家寨 21.57 0.15 0.42 0.58 0.32 0.56 0.30 0.59 1.21 捞王淀 20.31 0.13 0.47 0.59 0.30 0.57 0.28 0.57 1.26 池鱼淀 14.82 0.14 0.60 0.57 0.31 0.56 0.28 0.60 1.28 泛鱼淀 25.38 0.13 0.43 0.56 0.31 0.55 0.29 0.61 1.23 小白洋淀 15.20 0.22 0.37 0.65 0.37 0.60 0.35 0.53 1.06 全淀区 149.50 0.15 0.46 0.58 0.33 0.56 0.31 0.60 1.18
下载: 导出CSV
表 7 白洋淀各亚区表层沉积物TN、TP储量计算结果
Table 7. Calculation results of TN and TP reserves in surface sediments of Baiyangdian Lake
亚区 TN含量均值 TP含量均值 TN储量 TP储量 底泥层 过渡层 底泥层 过渡层 底泥层 过渡层 总计 底泥层 过渡层 总计 藻苲淀 2662.09 1575.32 866.95 645.84 0.48 1.80 2.27 0.15 0.74 0.89 烧车淀 3602.26 2255.33 756.10 550.43 0.93 3.14 4.07 0.19 0.77 0.96 南刘庄 3026.03 1957.73 1075.18 750.33 0.17 0.39 0.56 0.06 0.15 0.21 王家寨 2605.66 1441.65 730.55 560.96 0.49 1.58 2.07 0.14 0.62 0.75 捞王淀 2651.60 1138.23 697.76 455.03 0.41 1.38 1.80 0.11 0.55 0.66 池鱼淀 2439.89 1270.15 689.64 510.61 0.30 1.45 1.76 0.09 0.58 0.67 泛鱼淀 2414.77 999.94 610.20 554.71 0.50 1.32 1.83 0.13 0.74 0.86 小白洋淀 2677.44 1729.72 837.70 642.27 0.48 1.02 1.50 0.15 0.38 0.53 全淀区 2759.96 1507.04 769.51 567.85 3.76 12.10 15.86 1.02 4.52 5.54 注:TN和TP含量平均值单位为mg/kg;TN和TP储量单位为104 t
下载: 导出CSV
表 8 白洋淀各亚区表层沉积物氮磷污染评价结果
Table 8. Assessment results of nitrogen and phosphorus pollution in surface sediments of Baiyangdian Lake
亚区 底泥层 过渡层 STN 污染程度 STP 污染程度 FF 污染程度 STN 污染程度 STP 污染程度 FF 污染程度 烧车淀 3.36 重度 1.70 重度 2.97 重度 2.37 重度 1.29 中度 2.12 重度 藻苲淀 2.41 重度 1.91 重度 2.29 重度 1.59 中度 1.48 中度 1.56 中度 南刘庄 2.94 重度 2.48 重度 2.83 重度 1.92 中度 1.70 重度 1.87 中度 王家寨 2.43 重度 1.64 重度 2.24 重度 1.45 轻度 1.29 中度 1.41 轻度 捞王淀 2.44 重度 1.55 重度 2.23 重度 1.17 轻度 1.05 中度 1.14 轻度 池鱼淀 2.26 重度 1.54 重度 2.09 重度 1.36 轻度 1.20 中度 1.32 轻度 泛鱼淀 2.23 重度 1.36 中度 2.02 重度 1.01 轻度 1.27 中度 1.21 轻度 小白洋淀 2.63 重度 1.95 重度 2.47 重度 1.71 中度 1.46 中度 1.65 中度 全淀区 2.57 重度 1.73 重度 2.37 重度 1.54 中度 1.31 中度 1.48 轻度
下载: 导出CSV
-
[1] Ellen L P, Joselito M A. Evaluation of iron-phosphate as a source of internal lake phosphorus loadings[J]. Science of The Total Environment, 2001, 266(1/3): 87-93.
[2] Leland H V, Dean W E, Mudroch A, et al. Manual of Aquatic Sediment Sampling[J]. Journal of the North American Benthological Society, 1995, 16(1): 296.
[3] Li Z J, Yue Q Y, Gao B Y, et al. Phosphorus release potential and pollution characteristics of sediment in downstream Nansi Lake, China[J]. Frontiers of Environmental Science & Engineering, 2012, 6(2): 162-170.
[4] Sndergaard M, Jensen J P, Jeppesen E. Role of sediment and internal loading of phosphorus in shallow lakes[J]. Hydrobiologia, 2003, 506/509(1/3): 135-145.
[5] Vicente I D, Serrano L, Amores V, et al. Sediment phosphate fractionation and interstitial water phosphate concentration in two coastal lagoons(Albuferas de Adra, SE Spain)[J]. Hydrobiologia, 2003, 492(1/3): 95-105.
[6] 杜奕衡, 刘成, 陈开宁, 等. 白洋淀沉积物氮磷赋存特征及其内源负荷[J]. 湖泊科学, 2018, 30(6): 1537-1551. https://www.cnki.com.cn/Article/CJFDTOTAL-FLKX201806006.htm
[7] 李成瑶, 程立, 王同飞, 等. 白洋淀典型区域清淤前后沉积物的氮磷扩散通量研究[J]. 环境科学学报, 2021, 41(4): 1401-1409. doi: 10.13671/j.hjkxxb.2020.0331
[8] 李刚, 马佰衡, 周仰效, 等. 白洋淀湖岸带地表水与地下水垂向交换研究[J]. 水文地质工程地质, 2021, 48(4): 48-54. doi: 10.16030/j.cnki.issn.1000-3665.202008004
[9] 李爽, 张祖陆, 孙媛媛. 南四湖沉积物对上覆水氮磷负荷的时空响应[J]. 环境科学学报, 2013, 33(1): 133-138. https://www.cnki.com.cn/Article/CJFDTOTAL-HJXX201301020.htm
[10] 李延鹏, 杨婕, 肖文, 等. 洱海及上游主要湖泊底泥营养盐的研究[J]. 大理学院学报, 2013, 12(4): 58-61. https://www.cnki.com.cn/Article/CJFDTOTAL-DLSZ201304018.htm
[11] 李再兴, 孙悦, 张艺冉, 等. 白洋淀冰封期沉积物中氮赋存形态及分布特征[J]. 环境工程, 2019, 37(12): 29-33. https://www.cnki.com.cn/Article/CJFDTOTAL-HJGC201912006.htm
[12] 刘俊. 洞庭湖沉积物营养盐和重金属污染特征及评价研究[D]. 湘潭大学硕士学位论文, 2019.
[13] 毛欣, 刘林敬, 宋磊, 等. 白洋淀近70年生态环境演化过程及影响因素[J]. 地球科学, 2021, 46(7): 2609-2620. https://www.cnki.com.cn/Article/CJFDTOTAL-DQKX202107026.htm
[14] 汪敬忠, 刘卓, 魏浩, 等. 白洋淀表层沉积物元素的空间特征、风险评价及来源分析[J]. 环境科学, 2020, 41(1): 224-231. https://www.cnki.com.cn/Article/CJFDTOTAL-HJKZ202001026.htm
[15] 王健, 张靖天, 昝逢宇, 等. 中国东部浅水湖泊沉积物总氮总磷基准阈值研究[J]. 生态环境学报, 2014, 23(6): 992-999. https://www.cnki.com.cn/Article/CJFDTOTAL-TRYJ201406013.htm
[16] 王圣瑞, 倪栋, 焦立新, 等. 鄱阳湖表层沉积物有机质和营养盐分布特征[J]. 环境工程技术学报, 2012, 2(1): 23-28. https://www.cnki.com.cn/Article/CJFDTOTAL-HKWZ201201006.htm
[17] 王亚琼, 薛培英, 耿丽平, 等. 白洋淀沉积物-沉水植物-水系统氮、磷分布特征[J]. 水土保持学报, 2017, 31(3): 304-309. https://www.cnki.com.cn/Article/CJFDTOTAL-TRQS201703050.htm
[18] 王艳平, 徐伟伟, 韩超, 等. 巢湖沉积物氮磷分布及污染评价[J]. 环境科学, 2021, 42(2): 699-711. https://www.cnki.com.cn/Article/CJFDTOTAL-HJKZ202102021.htm
[19] 王雨山, 尹德超, 王旭清, 等. 雄安新区白洋淀湿地地表水和地下水转化关系及其对芦苇分布的影响[J]. 中国地质, 2021, 48(5): 1368-1381. https://www.cnki.com.cn/Article/CJFDTOTAL-DIZI202105006.htm
[20] 杨洋, 刘其根, 胡忠军, 等. 太湖流域沉积物碳氮磷分布与污染评价[J]. 环境科学学报, 2014, 34(12): 3057-3064. https://www.cnki.com.cn/Article/CJFDTOTAL-HJXX201412015.htm
[21] 易雨君, 林楚翘, 唐彩红. 1960s以来白洋淀水文、环境、生态演变趋势[J]. 湖泊科学, 2020, 32(5): 1333-1347, 1226 https://www.cnki.com.cn/Article/CJFDTOTAL-FLKX202005008.htm
[22] 余辉, 张文斌, 卢少勇, 等. 洪泽湖表层底质营养盐的形态分布特征与评价[J]. 环境科学, 2010, 31(4): 961-968. https://www.cnki.com.cn/Article/CJFDTOTAL-HJKZ201004020.htm
[23] 岳维忠, 黄小平, 孙翠慈. 珠江口表层沉积物中氮、磷的形态分布特征及污染评价[J]. 海洋与湖沼, 2007, (2): 111-117. https://www.cnki.com.cn/Article/CJFDTOTAL-HYFZ200702002.htm
[24] 张国峰, 于世繁, 董志民, 等. 白洋淀底质现状及对水体富营养化的影响[J]. 环境科学, 1995, (S1): 24-27. https://www.cnki.com.cn/Article/CJFDTOTAL-HJKZ5S1.009.htm
[25] 张嘉雯, 魏健, 刘利, 等. 衡水湖沉积物营养盐形态分布特征及污染评价[J]. 环境科学, 2020, 41(12): 5389-5399. https://www.cnki.com.cn/Article/CJFDTOTAL-HJKZ202012022.htm
[26] 张敏. 长江中下游浅水湖泊富营养化机制与重金属污染研究[D]. 中国科学院研究生院(水生生物研究所)博士学位论文, 2005.
-
图(4)
表(8)
计量
- 文章访问数: 1119
- PDF下载数: 104
- 施引文献: 0