

Ecological stoichiometry and spatial variation characteristics of soil nutrients in a cultivation area of Zhangjiakou City, Hebei Province
-
摘要:
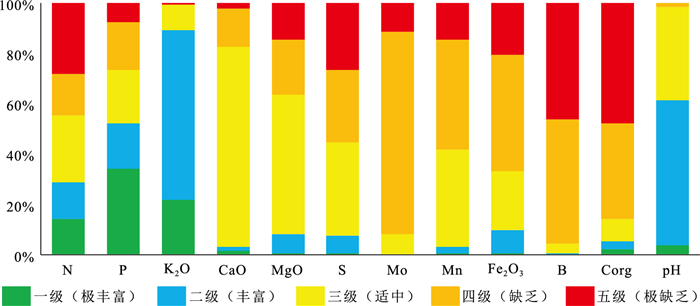
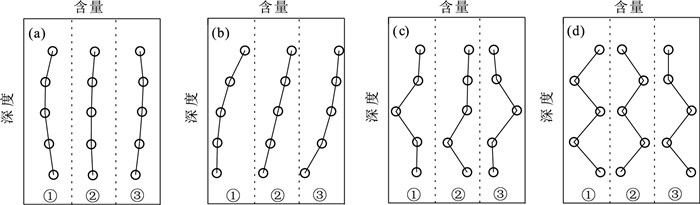
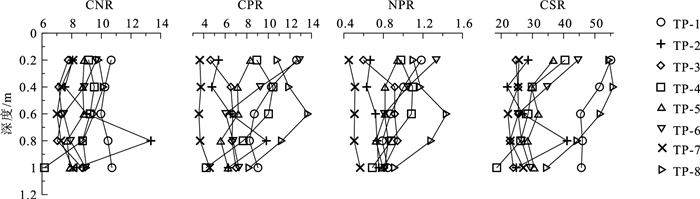
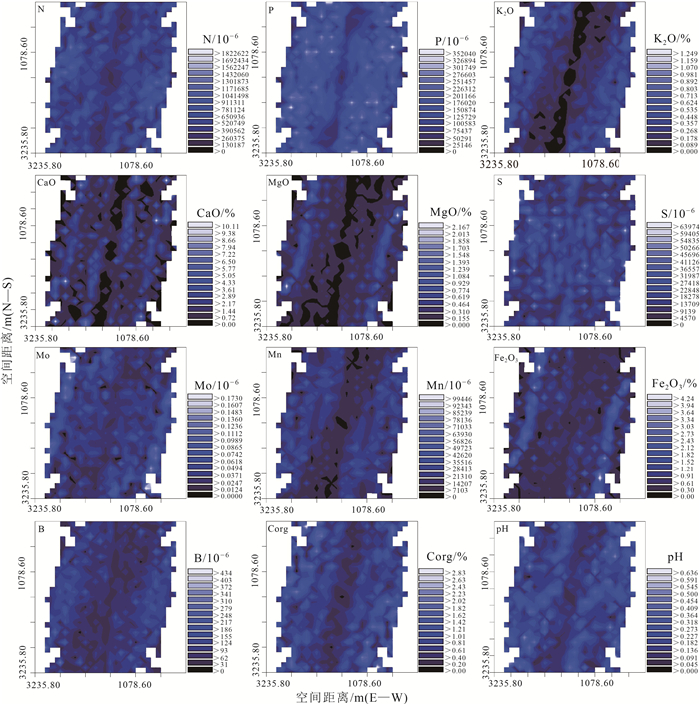
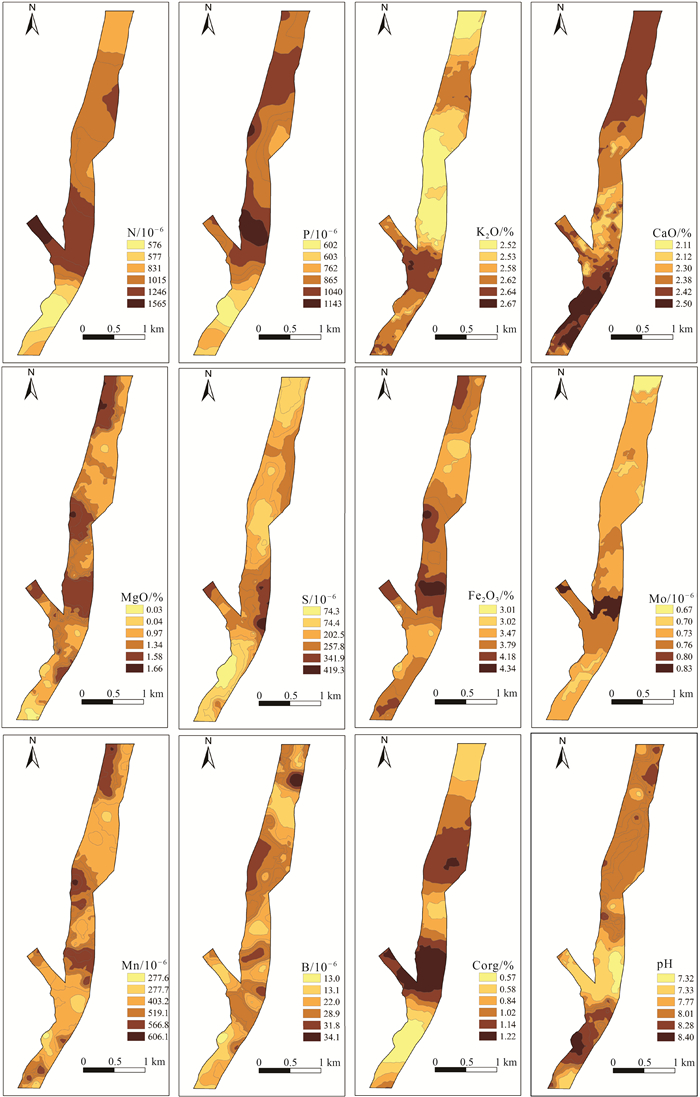
应用地统计学、生态化学计量学和GIS技术,对河北省张家口市万全区某种植区的表层土壤N、P、K2O、CaO、MgO、S、Mo、Mn、Fe2O3、B、Corg、pH等参数含量特征、趋势分布、空间变异性及生源要素的分布特征进行研究。结果表明,研究区Corg属于较强分异型,变异系数为71.54%,其余元素均属于弱或均匀分异型。N、P、K2O和pH整体呈现极丰富和丰富等级,S、Mo、Mn、Fe2O3、B和Corg则处于缺乏和极缺乏等级。通过不同趋势阶数中误差的比较叠加块金系数分析,初步确定研究区可分为3种预测类型,即无趋势预测、一阶趋势预测和二阶趋势预测。K2O、CaO、MgO、S、Mn和Corg主要受结构型影响,N、P、Mo、Fe2O3、B和pH主要受结构型和随机性混合影响,其中S和Mo的变异函数表面具有较弱的方向性。生态化学计量学表明,生源要素平均含量K2O>Corg>N>P>S,土壤CNR和NPR主要受控于土壤Corg和N,垂向上表现为以表聚型和平稳型分布为主,以突变型和锯齿型分布为辅。最后通过普通克里格插值清晰可见区域范围内N、P、K2O、CaO、MgO、Mn均表现为由东北部至西南部流域范围内明显异常区,主要受控于河流迁移搬运作用,重点区中N和P属于梯型,K2O、CaO和pH属于内凹型,S和Mo属于外凸型,MgO、Fe2O3、Mn、B和Corg属于跳跃型。
Abstract:By applying geostatistics, ecological chemometrics and GIS techniques, the characteristics of the content, trend distribution, spatial variability and distribution of biogenic elements of N, P, K2O, CaO, MgO, S, Mo, Mn, Fe2O3, B, Corg, pH and other parameters in the surface soil of a planting area in Wanquan District, Zhangjiakou City, Hebei Province were studied.The results showed that Corg belonged to the strongly differentiated variation type with a coefficient of variation of 71.54%, while the rest of the elements belonged to the weak or uniform differentiation type.N, P, K2O and pH were in the very abundant and abundant classes, while S, Mo, Mn, Fe2O3, B and Corg were in the deficient and extremely deficient classes.By comparing the errors in different trend orders superimposed on the block gold coefficient analysis, it was tentatively determined that the study area could be classified into three prediction types, namely, no trend prediction, first-order trend prediction and second-order trend prediction, with K2O, CaO, MgO, S, Mn and Corg mainly influenced by the structural type, and N, P, Mo, Fe2O3, B and pH mainly influenced by a mixture of structural and stochastic properties, among which S and Mo variance functions surface with weak directionality.Ecological chemometrics showed that the average content of biogenic elements K2O > Corg > N > P > S.Soil CNR and NPR were mainly controlled by soil Corg and N, and the vertical direction showed a predominantly epistatic and smooth distribution, supplemented by mutational and sawtooth distribution.Finally, ordinary kriging interpolation clearly shows that N, P, K2O, CaO, MgO, and Mn all show obvious anomalous areas in the watershed range from northeast to southwest, mainly controlled by river migration and transport, with N and P in the key area being of the trapezoidal type, K2O, CaO, and pH of the inner concave type, S and Mo of the outer convex type, and MgO, Fe2O3, Mn, B, and Corg belong to the jump type.
-

-
表 1 132件样品中土壤营养元素描述性统计
Table 1. Descriptive statistics of soil nutrient elements in the 132 samples
指标 最小值 最大值 中位数 平均值 标准差 变异系数(Cv)/% 偏度 峰度 黄淮海平原(孙厚云等,2022) 全国土壤背景(孙厚云等,2022) N/10-6 93 3296 1075 1223 721 58.95 0.80 0.24 381 707 P/10-6 259 1937 836 878 366 41.69 0.47 -0.36 517 570 K2O/% 0.94 4.48 2.70 2.80 0.48 17.14 0.83 3.14 2.34 2.36 CaO/% 0.39 11.09 2.26 2.24 1.28 57.14 3.31 19.5 4.10 2.74 MgO/% 0.04 4.83 1.42 1.34 0.55 41.04 1.57 11.64 1.88 1.43 S/10-6 51 988 232 245 137 55.92 1.79 6.48 142 245 Mo/10-6 0.43 1.55 0.74 0.79 0.21 26.58 1.75 3.59 0.52 0.7 Mn/10-6 149 1020 518 491 134 27.29 -0.04 1.64 705 569 Fe2O3/% 1.67 9.33 3.96 4.01 0.90 22.44 1.43 8.64 3.71 2.8 B/10-6 3.26 65.51 27.29 26.67 9.40 35.25 0.18 1.40 52 43 Corg/% 0.03 4.33 1.05 1.23 0.88 71.54 1.51 2.42 0.26 0.6 pH 6.38 8.78 8.22 8.09 0.44 5.44 -1.41 2.20 8.61 8 CNR 1.58 112.59 9.30 10.41 9.26 88.95 10.39 115.26 6.82 8.49 CPR 0.34 62.26 11.08 15.76 13.40 85.03 1.89 2.92 5.03 10.53 NPR 0.05 4.55 1.18 1.49 0.94 63.09 1.68 2.45 0.74 1.24 CSR 6.60 107.30 45.84 48.69 19.03 39.08 0.59 0.57 18.31 24.49  下载: 导出CSV
表 2 研究区土壤营养元素及pH值相关性分析
Table 2. Correlation analysis of soil nutrients and pH in the study area
指标 N P K2O CaO MgO S Mo Mn Fe2O3 B Corg pH N 1 P 0.375** 1 K2O -0.170 -0.570** 1 CaO -0.025 0.386** -0.711** 1 MgO 0.153 0.660** -0.808** 0.663** 1 S 0.837** 0.531** -0.303** 0.145 0.281** 1 Mo 0.025 0.046 0.330** -0.111 -0.027 0.068 1 Mn 0.255** 0.654** -0.683** 0.476** 0.724** 0.349** -0.054 1 Fe2O3 0.150 0.506** -0.554** 0.415** 0.763** 0.202* 0.279** 0.646** 1 B 0.414** 0.463** -0.545** 0.366** 0.429** 0.500** -0.080 0.510** 0.260** 1 Corg 0.863** 0.115 -0.036 -0.114 0.003 0.709** -0.020 0.111 0.034 0.291** 1 pH -0.318** 0.077 -0.233** 0.370** 0.202* -0.275** -0.245** 0.271** -0.040 0.171 -0.341** 1 注:*表示在0.05水平(双侧)上显著相关(双尾),**表示在0.01水平(双侧)上显著相关(双尾),n=132
下载: 导出CSV
表 3 研究区土壤营养元素分级统计
Table 3. Classification statistics of soil nutrients in the study area
指标 一级 二级 三级 四级 五级 分级标准 数量 分级标准 数量 分级标准 数量 分级标准 数量 分级标准 数量 N/10-6 >2000 19 1500~2000 19 1000~1500 35 750~1000 22 ≤750 37 P/10-6 >1000 45 800~1000 24 600~800 28 400~600 25 ≤400 10 K2O/% >3.01 29 2.41~3.01 89 1.81~2.41 13 1.21~1.81 0 ≤1.21 1 CaO/% >7.32 2 4.23~7.32 2 1.30~4.23 105 0.50~1.30 20 ≤0.50 3 MgO/% >2.45 1 1.87~2.45 10 1.23~1.87 73 0.75~1.23 29 ≤0.75 19 S/10-6 >757 1 430~757 9 245~430 49 156~245 38 ≤156 35 Mo/10-6 >5.0 0 2.3~5.0 0 1.1~2.3 11 0.6~1.1 106 ≤0.6 15 Mn/10-6 >967 1 711~967 3 540~711 51 342~540 58 ≤342 19 Fe2O3/% >6.23 1 5.04~6.23 12 4.24~5.04 31 3.46~4.24 61 ≤3.46 27 B/10-6 >82.3 0 58.6~82.3 1 41~58.6 5 25.9~41 65 ≤25.9 61 Corg/% >4.0 3 3.0~4.0 4 2.0~3.0 12 1.0~2.0 50 ≤1.0 63 pH >8.6 5 8.1~8.6 76 6.8~8.1 49 5.3~6.8 2 ≤5.3 0
下载: 导出CSV
表 4 土壤元素含量变异函数理论模型及其相关参数
Table 4. Soil elements content and variogram model parameters
元素指标 变程/m 块金值(C0) 基台值(C0+C) 块金系数C0/(C0+C) 决定系数R2 残差RSS 拟合模型 N 1191.65 194000 537600 0.361 0.889 2.04×10¹⁰ Gaussian P 1091.19 47300 142500 0.332 0.808 2.79×10⁹ Gaussian K2O 2522 0.0336 0.2722 0.123 0.913 7.927×10⁻³ Spherical CaO 833 0.001 1.623 0.001 0.763 0.601 Spherical MgO 2157 0.0609 0.3408 0.179 0.802 0.0261 Spherical S 348 3000 19570 0.153 0.146 7.12×10⁷ Exponential Mo 5222 0.02808 0.05626 0.499 0.808 1.563×10⁻⁴ Spherical Mn 1848 4240 19540 0.217 0.835 5.72×10⁷ Spherical Fe2O3 2047 0.342 0.88 0.389 0.715 0.151 Spherical B 2704 48.7 97.5 0.499 0.87 445 Spherical Corg 3153 0.14 0.89 0.157 0.933 0.0372 Exponential pH 1001.13 0.0621 0.1932 0.321 0.884 2.74×10⁻³ Gaussian
下载: 导出CSV
-
[1] An Y L, Huang Y, Yin Z Q, et al. Spatial distribution patterns and sources for potential toxic elements in soil in the Daxing District, Beijing, China[J]. Arabian Journal of Geosciences, 2022, 15(8) : 1-21.
[2] Bekele A, Hudnall W H. Spatial variability of soil chemical properties of a prairie-forest transition in Louisiana[J]. Plant and Soil, 2006, 280: 7-21. doi: 10.1007/s11104-005-4983-4
[3] Burgess T M, Webster R. Optimal interpolation and isarithmic mapping of soil properties: Ⅱ. BlockKriging[J]. Journal of Soil Science, 1980, 31: 333-341. doi: 10.1111/j.1365-2389.1980.tb02085.x
[4] Cambardella C A, Moorman T B, Novak J M, et al. Field-scale variability of soil properties in Central IOWA soils[J]. Soil Sci. Soc. Am. J., 1994, 58: 1501-1511. doi: 10.2136/sssaj1994.03615995005800050033x
[5] Cleveland C C, Liptzin D. C: N: P stoichiometry in soil: is there a "Redfield ratio" for the microbial biomass[J]. Biogeochemistry, 2007, 85(3) : 235-252. doi: 10.1007/s10533-007-9132-0
[6] Cole C V. Mechanisms of phosphate adsorption by calciumcarbonate[J]. Soil. Sci. Soc. Amer. Proc., 1953, 17: 352-35. doi: 10.2136/sssaj1953.03615995001700040013x
[7] Dayani M, Mohammadi J. Geostatistical assessment of Pb, Zn and Cd contamination in near-surface; soils of the urban-mining transitional region of Isfahan, Iran[J]. Pedosphere, 2010, 20(5) : 568-577. doi: 10.1016/S1002-0160(10)60046-X
[8] Deluigne J, Bisdom E, Sleeman J, et al. Olivines, their pseudomorphs and secondary products[J]. Pedologie, 1979, 29(3) : 247-300.
[9] Elser J J, Acquisti C, Kumar S. Stoichiogenomics: theevolutionary ecology of macromolecular elemental composition [J]. Trends in Ecology & Evolution, 2011, 26(1) : 38-44.
[10] Elser J J, Fagan W F, Kerkhoff A J, et al. Biological stoichiometry of plant production: metabolism, scaling and ecological response to global change[J]. New Phytologist, 2010, 186(3) : 593-608. doi: 10.1111/j.1469-8137.2010.03214.x
[11] Facchinelli A, Sacchi E, Mallen L. Multivariate statistical and GIS-based approach to identify heavymetal sources in soils[J]. Environmental Pollution, 2001, 114(3) : 313-324. doi: 10.1016/S0269-7491(00)00243-8
[12] Huang B, Sun W, Zhao Y, et al. Temporal and spatial variability of soil organic matter and total nitrogen in an agricultural ecosystem as affected by farming practices[J]. Geoderma, 2007, 139(3/4) : 336-345.
[13] Jordan T E, Cornwell J C, Boynton W R, et al. Changes in phosphorus biogcochemistry along an estuarine salinity gradient: The iron conveyer belt[J]. Limnology and Oceanography, 2008, 53(1) : 172-184. doi: 10.4319/lo.2008.53.1.0172
[14] LiuR, Wang M, Chen W P, et al. Spatial pattern of heavy metals accumulation risk in urban soils of Beijing and its influencing factors[J]. Environmental Pollution, 2016, 210: 174-181. doi: 10.1016/j.envpol.2015.11.044
[15] Negrin V L, Spetter C V, Asteasuain R O, et al, Influence of flooding and vegetation oncarbon, nitrogen, and phosphorus dynamics in the pore water of a Spartina alterniflora salt marsh[J]. Journal of Environmental Sciences, 2011, 23(2) : 212-221. doi: 10.1016/S1001-0742(10)60395-6
[16] Oliver M A, Webster R. Kriging: a method of interpolation for geographical informationsystems[J]. Int. J. Geogr. Inf. Syst., 1990, 4: 313-332. doi: 10.1080/02693799008941549
[17] Sah R N, Mikkelsen D S. Effects of anaerobic decomposition of organic matter on sorption and transformations of phosphate in drained soils: Ⅰ[J]. Effects on Phosphate Sorption Soil Science, 1986, 142(5) : 267-274.
[18] Sardans J, Rivasubach A, Penuelas J. The C: N: P stoichiometry of organisms and ecosystems in a changing world: A review and perspectives[J]. Perspectives in Plant Ecology Evolution & Systematics, 2012, 14(1) : 33-47.
[19] Zhang Z M, Zhou Y C, Huang X F, et al. Applicability of GIS-based spatial interpolation and simulation for estimating the soil organic carbon storage in karst regions[J]. Global Ecology and Conservation, 2020, 21: e00849. doi: 10.1016/j.gecco.2019.e00849
[20] 安永龙, 杜子图, 黄勇. 基于地统计学和GIS技术的北京市大兴区礼贤镇土壤养分空间变异性研究[J]. 现代地质, 2018, 32(6) : 1311-1321. doi: 10.19657/j.geoscience.1000-8527.2018.06.19
[21] 安永龙, 万利勤, 李霞, 等. 承德市土壤重金属空间结构与分布特征[J]. 水文地质工程地质, 2020, 47(6) : 119-131. https://www.cnki.com.cn/Article/CJFDTOTAL-SWDG202006015.htm
[22] 常妮. 汉诺坝碱性玄武岩巨量地幔岩石堆积机制研究[D]. 中国地质大学(北京) 硕士学位论文, 2020.
[23] 陈绪钰, 王东辉, 倪化勇, 等. 长江经济带上游地区丘陵城市工程建设适宜性评价——以泸州市规划中心城区为例[J]. 吉林大学学报(地球科学版), 2020, 50(1) : 194-207. doi: 10.13278/j.cnki.jjuese.20180303
[24] 董正武, 玉米提· 哈力克, 李生宇, 等. 古尔班通古特沙漠西南缘柽柳沙包的土壤化学计量特征[J]. 生态学报, 2020, 40(20) : 7389-7400. https://www.cnki.com.cn/Article/CJFDTOTAL-STXB202020030.htm
[25] 付海曼, 贾黎明. 土壤对氮、磷吸附/解吸附特性研究进展[J]. 中国农学通报, 2009, 25(21) : 198-203. https://www.cnki.com.cn/Article/CJFDTOTAL-ZNTB200921045.htm
[26] 贾恒义. 黄土高原主要土壤成壤过程与矿物元素再分配[J]. 水土保持研究, 1995, (4) : 56-60, 68. https://www.cnki.com.cn/Article/CJFDTOTAL-STBY504.013.htm
[27] 姜华, 唐晓华, 杨利亚, 等. 基于土地资源的市县级多要素国土空间开发适宜性评价研究——以湖北省宜昌市为例[J]. 中国地质, 2020, 47(6) : 1776-1792. https://www.cnki.com.cn/Article/CJFDTOTAL-DIZI202006015.htm
[28] 李启权, 岳天祥, 范泽孟, 等. 中国表层土壤有机质空间分布模拟分析方法研究[J]. 自然资源学报, 2010, 25(8) : 1385-1399. https://www.cnki.com.cn/Article/CJFDTOTAL-ZRZX201008015.htm
[29] 林燕, 白秀佳, 叶泽宇, 等. 基于ArcGIS的南通市农业生产适宜性评价[J]. 地质通报, 2021, 40(6) : 968-977. http://dzhtb.cgs.cn/gbc/ch/reader/view_abstract.aspx?file_no=20210612&flag=1
[30] 刘雪松, 刘金巍, 魏建朋, 等. 赣江梅江河河流作用对土壤元素分配的影响[J]. 人民长江, 2019, 50(10) : 69-72, 76. https://www.cnki.com.cn/Article/CJFDTOTAL-RIVE201910012.htm
[31] 刘永生, 杨楠, 王轶, 等. 保定—沧州地区基于空间自相关分析的土壤区域监测点网络密度研究[J]. 水文地质工程地质, 2012, 39(5) : 126-131. https://www.cnki.com.cn/Article/CJFDTOTAL-SWDG201205024.htm
[32] 刘源, 李晓晶, 段玉玺, 等. 库布齐沙漠东部植被恢复对土壤生态化学计量的影响[J]. 干旱区研究, 2022, 39(3) : 924-932. https://www.cnki.com.cn/Article/CJFDTOTAL-GHQJ202203025.htm
[33] 卢建男, 刘凯军, 王瑞雄, 等. 中国荒漠植物-土壤系统生态化学计量学研究进展[J]. 中国沙漠, 2022, 42(2) : 173-182. https://www.cnki.com.cn/Article/CJFDTOTAL-ZGSS202202020.htm
[34] 罗艳, 贡璐, 朱美玲, 等. 塔里木河上游荒漠区4种灌木植物叶片与土壤生态化学计量特征[J]. 生态学报, 2017, 37(24) : 8326-8335. https://www.cnki.com.cn/Article/CJFDTOTAL-STXB201724019.htm
[35] 骆珊, 张德明, 卢定彪, 等. 乌蒙山区毕节市耕地土壤微量元素丰缺评价及其影响因素[J]. 地质通报, 2021, 40(9) : 1570-1583. http://dzhtb.cgs.cn/gbc/ch/reader/view_abstract.aspx?file_no=20210916&flag=1
[36] 秦王念, 颜雄, 李文昭, 等. 基于CNKI数据库的生态化学计量文献计量分析[J]. 现代农业科技, 2021, (24) : 228-230. https://www.cnki.com.cn/Article/CJFDTOTAL-ANHE202124085.htm
[37] 曲林雨. 汉诺坝玄武岩结构和化学特征多样性的联系[D]. 中国地质大学(北京) 硕士学位论文, 2020.
[38] 石建省, 马荣, 马震. 区域地球多圈层交互带调查探索研究[J]. 地球学报, 2019, 40(6) : 767-780. https://www.cnki.com.cn/Article/CJFDTOTAL-DQXB201906001.htm
[39] 孙厚云, 卫晓锋, 贾凤超, 等. 冀北承德地区土壤生源要素生态化学计量与空间分异特征[J]. 生态学报, 2022, 42(5) : 1750-1765. https://www.cnki.com.cn/Article/CJFDTOTAL-STXB202205008.htm
[40] 孙厚云, 卫晓锋, 张晓敏, 等. 河北承德中部伊逊河红旗地区土壤生源要素空间分布格局及其影响因素[J]. 矿产勘查, 2021, 12(4) : 1008-1018. https://www.cnki.com.cn/Article/CJFDTOTAL-YSJS202104030.htm
[41] 田静, 盛茂银, 汪攀, 等. 西南喀斯特土地利用变化对植物凋落物-土壤C、N、P化学计量特征和土壤酶活性的影响[J]. 环境科学, 2019, 40(9) : 4278-4286. https://www.cnki.com.cn/Article/CJFDTOTAL-HJKZ201909050.htm
[42] 汪璇, 王成秋, 唐将, 等. 基于地统计学和GIS的三峡库区土壤微量营养元素空间变异性研究[J]. 土壤通报, 2009, 40(2) : 359-365. https://www.cnki.com.cn/Article/CJFDTOTAL-TRTB200902037.htm
[43] 王学求, 周建, 徐善法, 等. 全国地球化学基准网建立与土壤地球化学基准值特征[J]. 中国地质, 2016, 43(5) : 1469-1480. https://www.cnki.com.cn/Article/CJFDTOTAL-DIZI201605001.htm
[44] 卫晓锋, 孙厚云, 张竞, 等. 承德特色林果资源的生态地球化学过程及其品质提升意义[J]. 水文地质工程地质, 2020, 47(6) : 99-108. https://www.cnki.com.cn/Article/CJFDTOTAL-SWDG202006013.htm
[45] 魏卓群, 白军红, 张玲, 等. 黄河口潮间带芦苇湿地土壤生源要素的时空动态变化特征[J]. 北京师范大学学报(自然科学版), 2021, 57(1) : 43-50. https://www.cnki.com.cn/Article/CJFDTOTAL-BSDZ202101008.htm
[46] 吴美玲, 田晋文. 基于GIS和地统计学的黔西北农业园区土壤养分空间变异特征研究[J]. 中国农学通报, 2019, 35(17) : 48-53. https://www.cnki.com.cn/Article/CJFDTOTAL-ZNTB201917009.htm
[47] 吴云霞, 蔡奎, 吕凤军, 等. 冀西北农牧交错带表层土壤营养元素特征研究——以河北省康保县为例[J]. 干旱区资源与环境, 2019, 33(1) : 84-89. https://www.cnki.com.cn/Article/CJFDTOTAL-GHZH201901013.htm
[48] 奚小环. 自然资源时期: 大数据与地球系统科学——再论全面发展时期的勘查地球化学[J]. 物探与化探, 2019, 43(3) : 449-460. https://www.cnki.com.cn/Article/CJFDTOTAL-WTYH201903001.htm
[49] 夏汉平, 高子勤. 磷酸盐在白浆土中的吸附与解吸特性[J]. 土壤通报, 1992, 23: 283-287. https://www.cnki.com.cn/Article/CJFDTOTAL-TRXB199302004.htm
[50] 熊杏, 熊清华, 郭熙, 等. 南方典型丘陵区耕地土壤全氮、有机碳和碳氮比空间变异特征及其影响因素[J]. 植物营养与肥料学报, 2020, 26(9) : 1656-1668. https://www.cnki.com.cn/Article/CJFDTOTAL-ZWYF202009009.htm
[51] 杨社锋, 方维萱, 胡瑞忠, 等. 老挝南部波罗芬高原玄武岩砖红壤风化壳微量元素地球化学特征[J]. 矿产与地质, 2005, (6) : 723-727. https://www.cnki.com.cn/Article/CJFDTOTAL-KCYD200506029.htm
[52] 杨之江, 陈效民, 景峰, 等. 基于GIS和地统计学的稻田土壤养分与重金属空间变异[J]. 应用生态学报, 2018, 29(6) : 1893-1901. https://www.cnki.com.cn/Article/CJFDTOTAL-YYSB201806021.htm
[53] 赵明松, 张甘霖, 王德彩, 等. 徐淮黄泛平原土壤有机质空间变异特征及主控因素分析[J]. 土壤学报, 2013, 50(1) : 1-11. https://www.cnki.com.cn/Article/CJFDTOTAL-TRXB201301001.htm
[54] 中国环境监测总站. 中国土壤元素背景[M]. 北京: 中国环境科学出版社, 1990: 1-501.
[55] 中华人民共和国国资源部. DZ/T 0295—2016, 土地质量地球化学评价规范[S]. 北京: 地质出版社, 2016.
[56] 中华人民共和国国土资源部. DZ/T 0258—2014, 多目标区域地球化学调查规范(1∶250000) [S]. 北京: 地质出版社, 2014.
[57] 朱礼学. 土壤pH值及CaCO3在多目标地球化学调查中的研究意义[J]. 四川地质学报, 2001, (4) : 226-228. https://www.cnki.com.cn/Article/CJFDTOTAL-SCDB200104005.htm
[58] 朱秋莲, 邢肖毅, 张宏, 等. 黄土丘陵沟壑区不同植被区土壤生态化学计量特征[J]. 生态学报, 2013, 33(15) : 4674-4682. https://www.cnki.com.cn/Article/CJFDTOTAL-STXB201315019.htm
-


图(10)
表(4)
计量
- 文章访问数: 1624
- PDF下载数: 70
- 施引文献: 0