

Temporal and spatial changes in net primary productivity and land surface temperature and their influencing factors in Jiangsu coastal zone in recent 30 years
-
摘要:
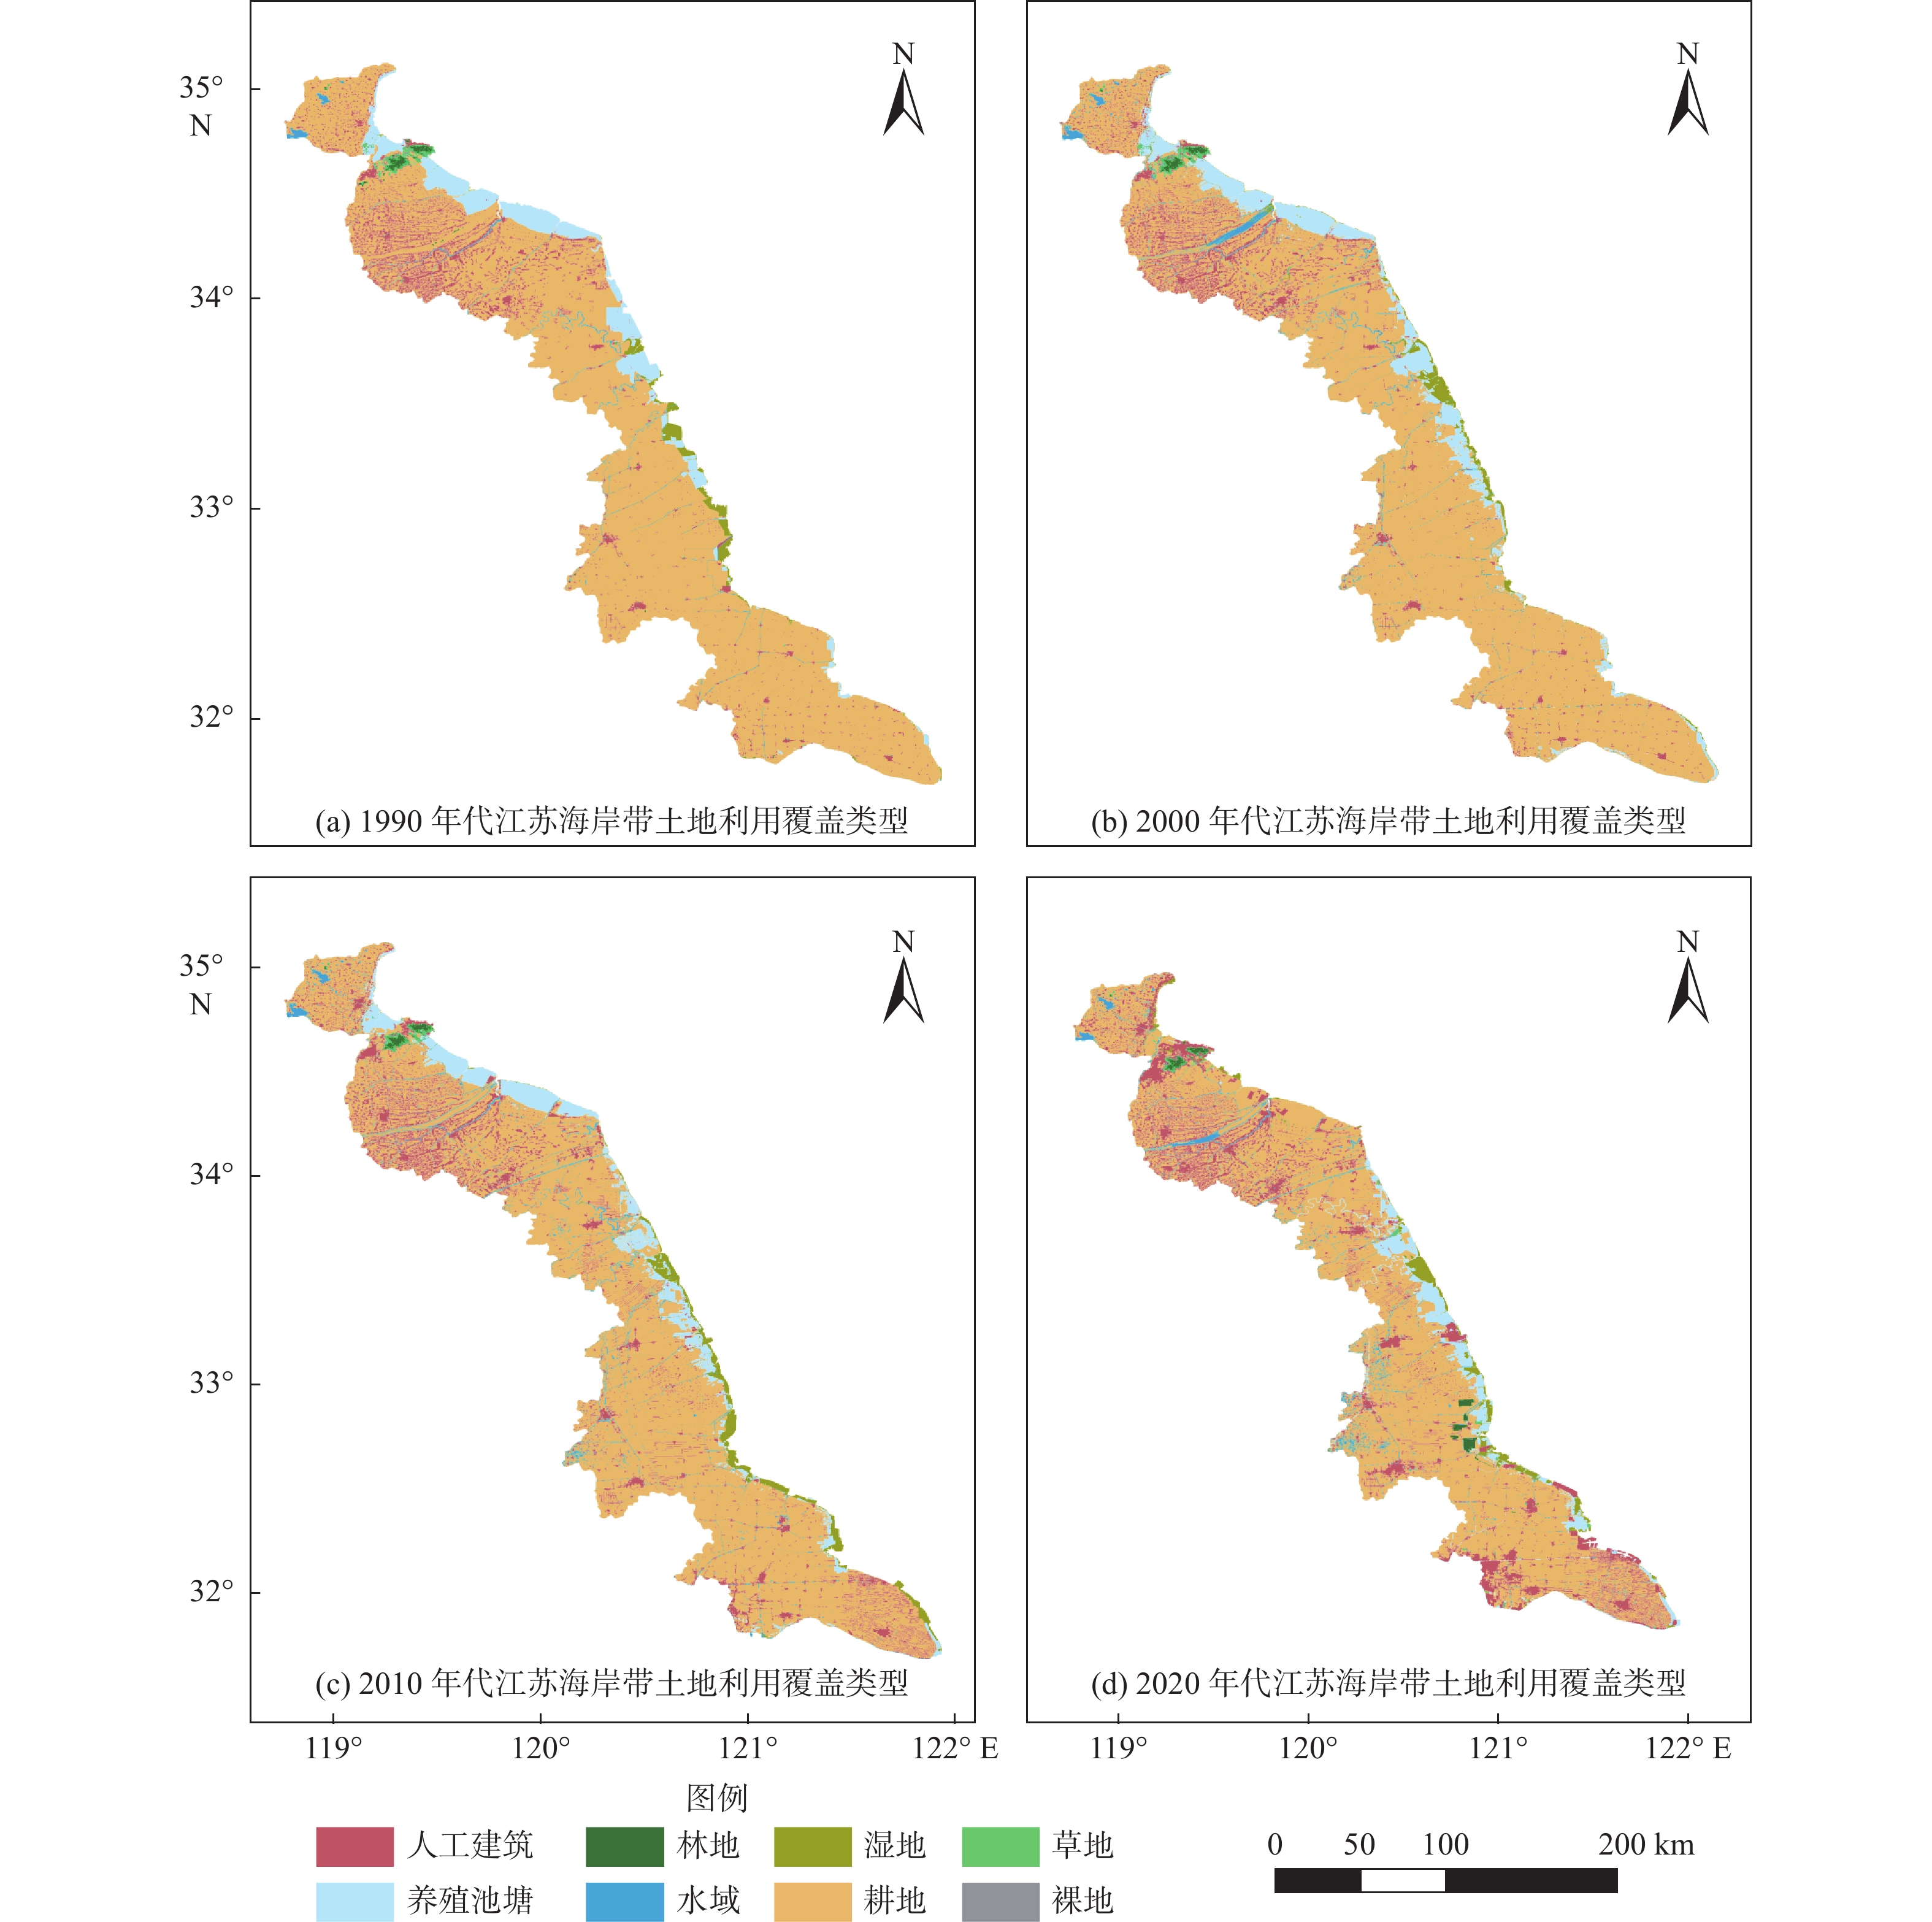
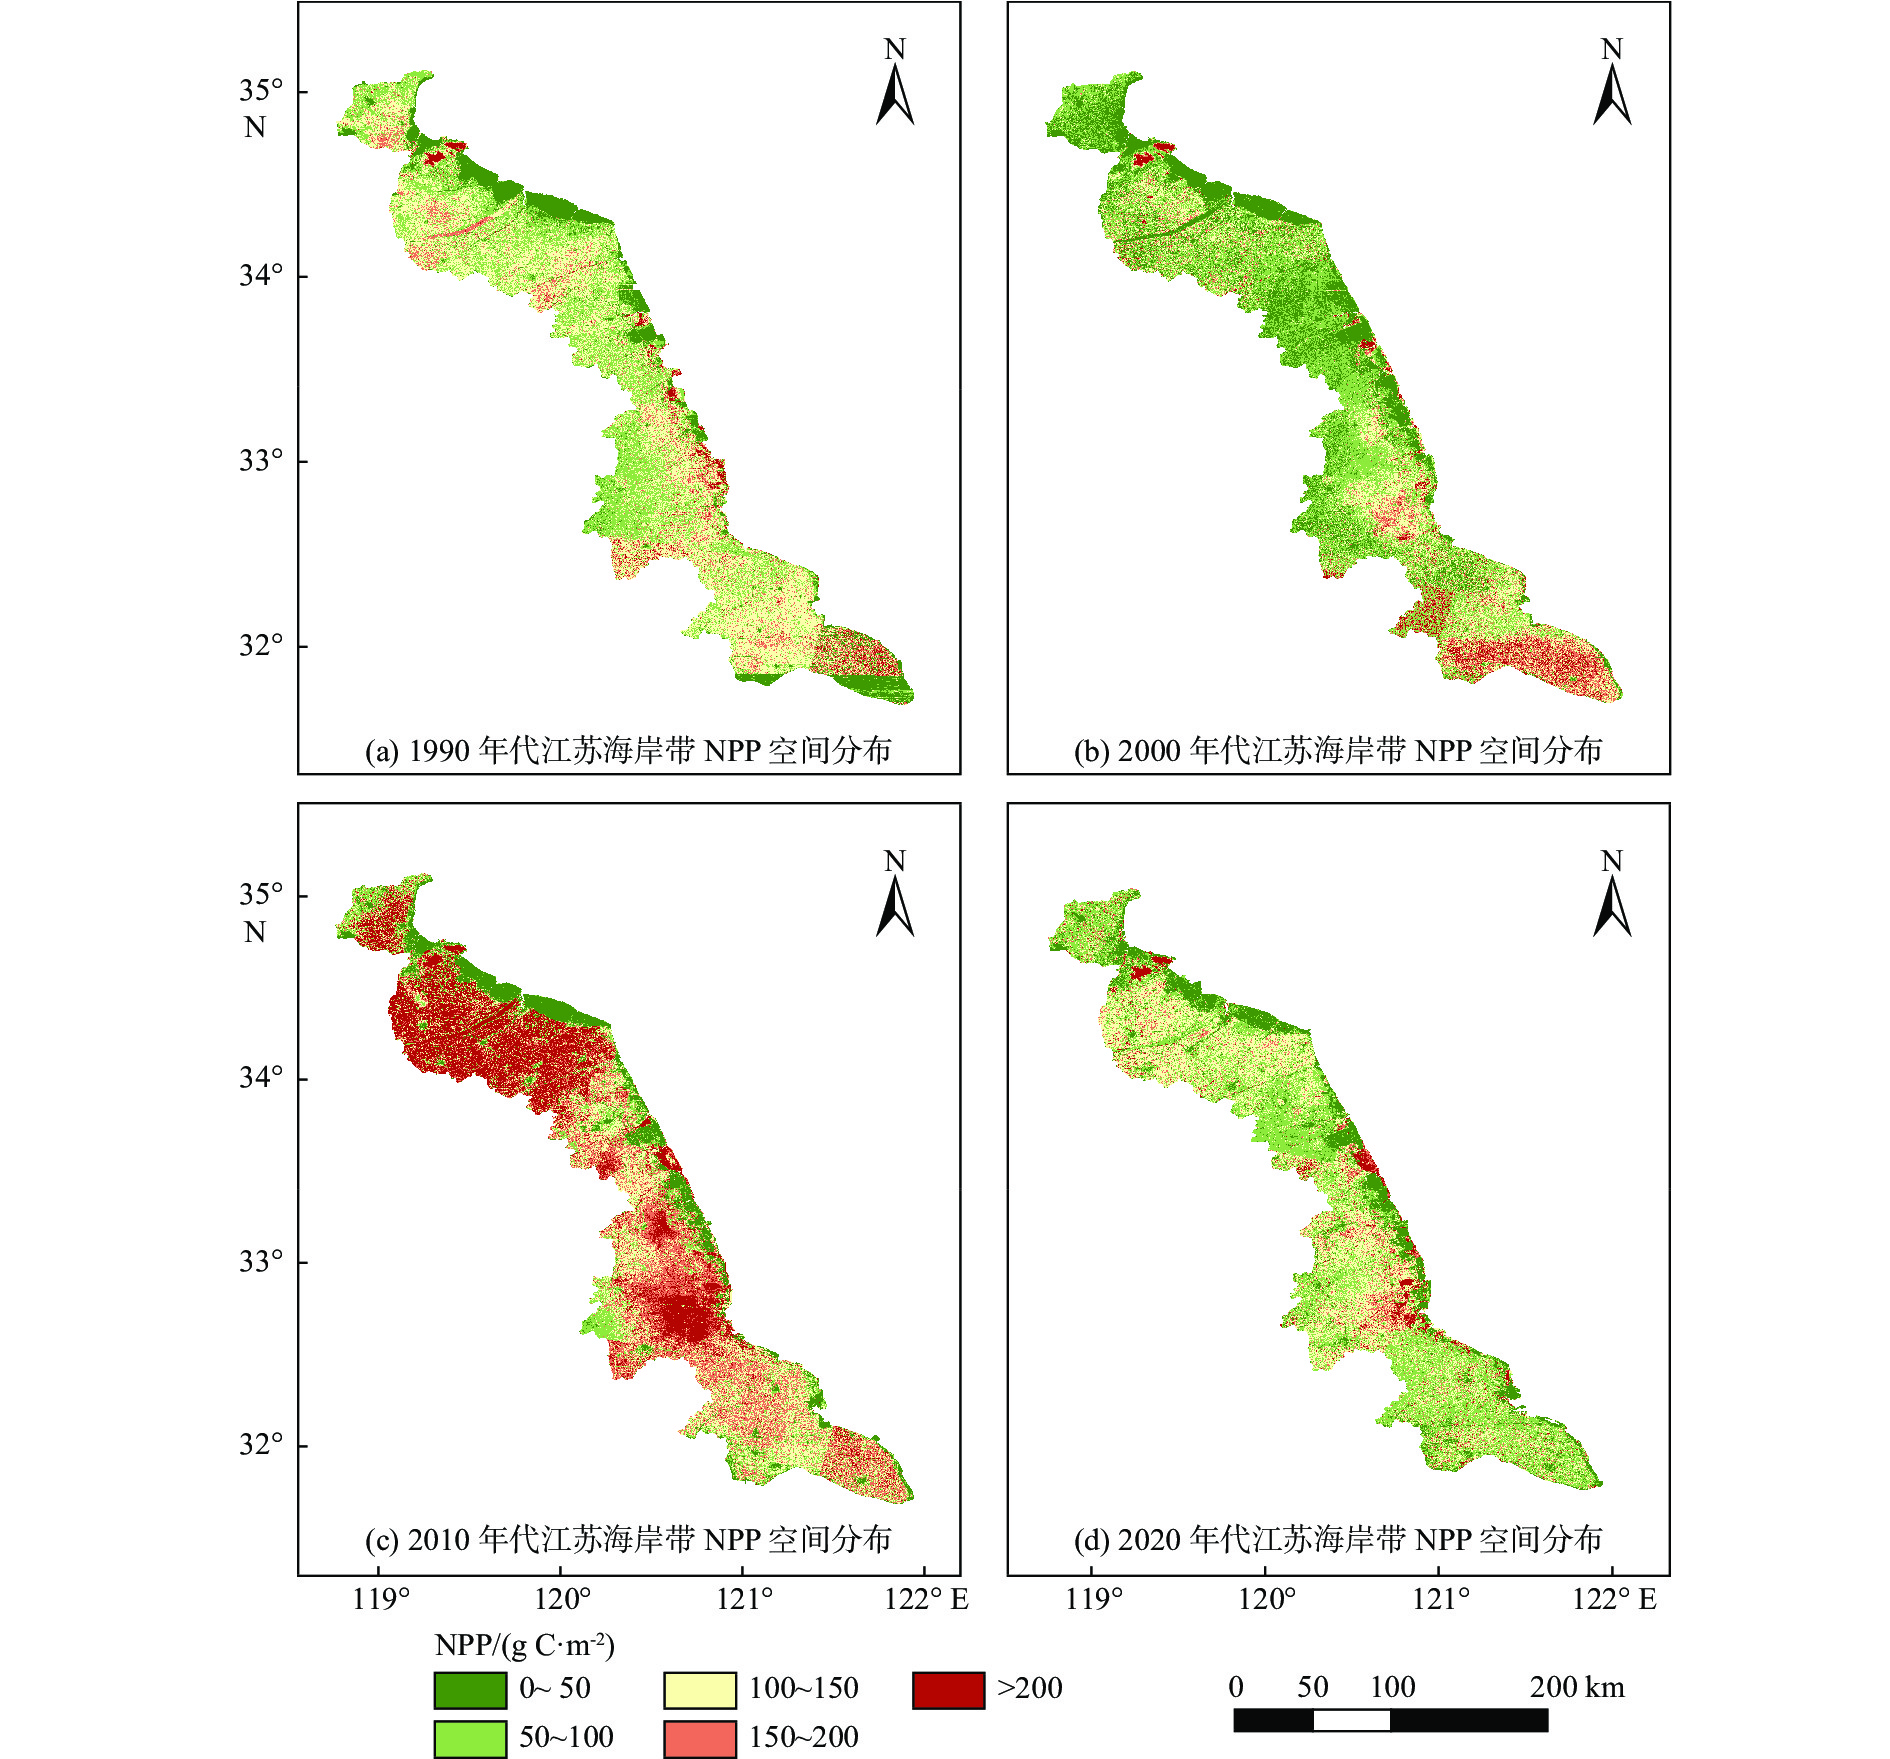
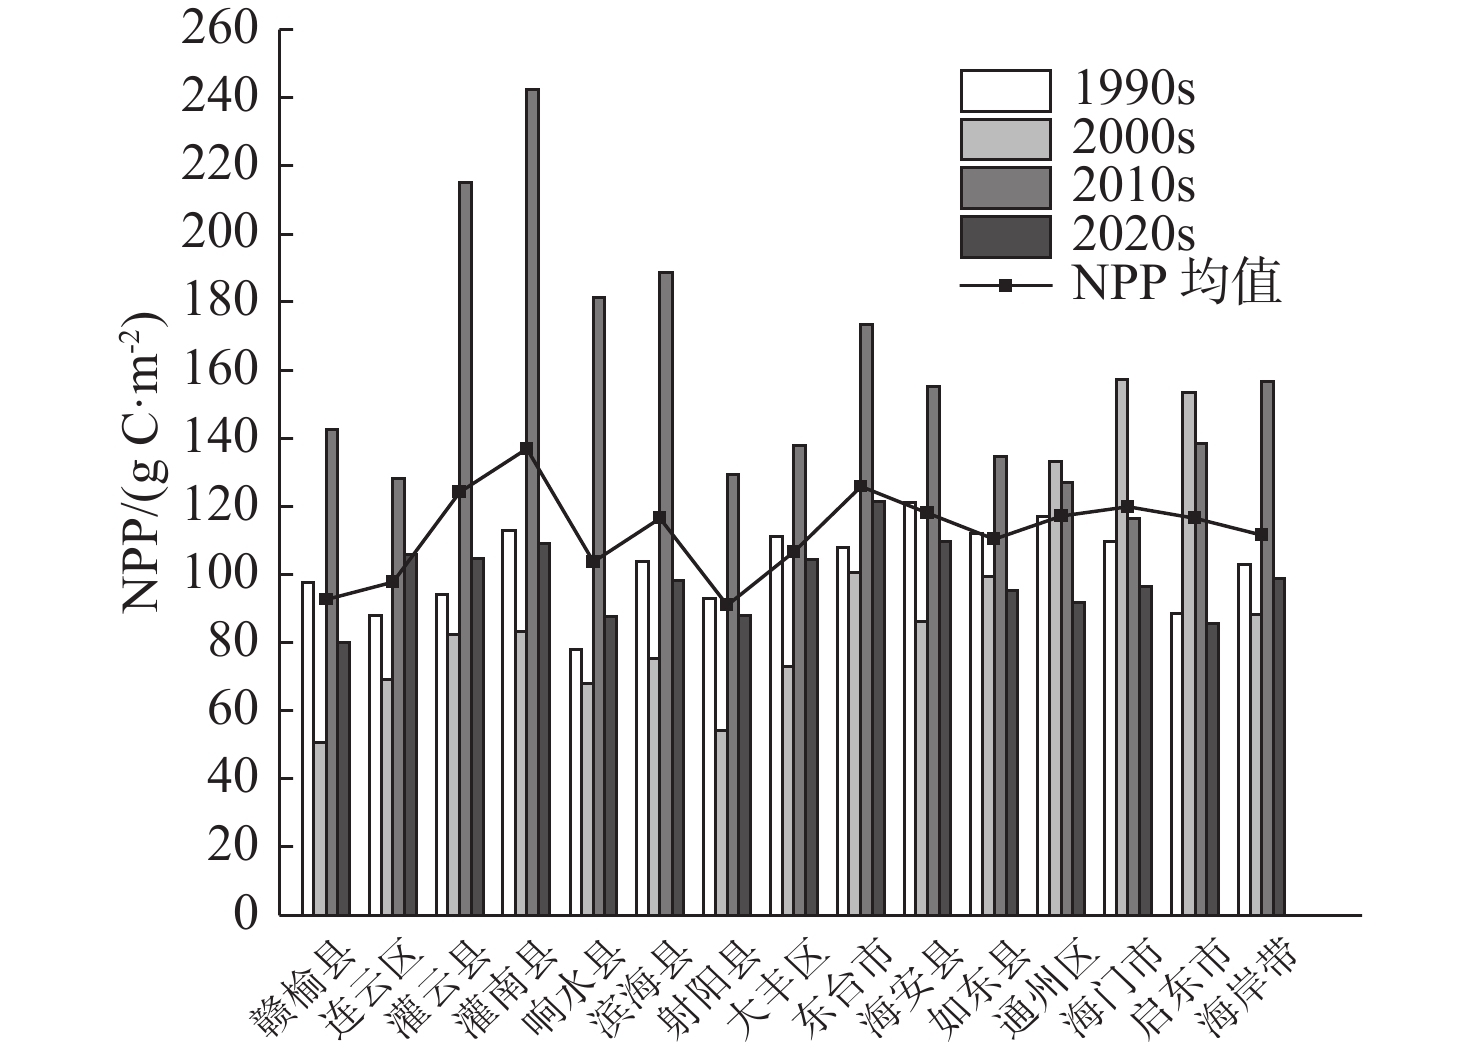
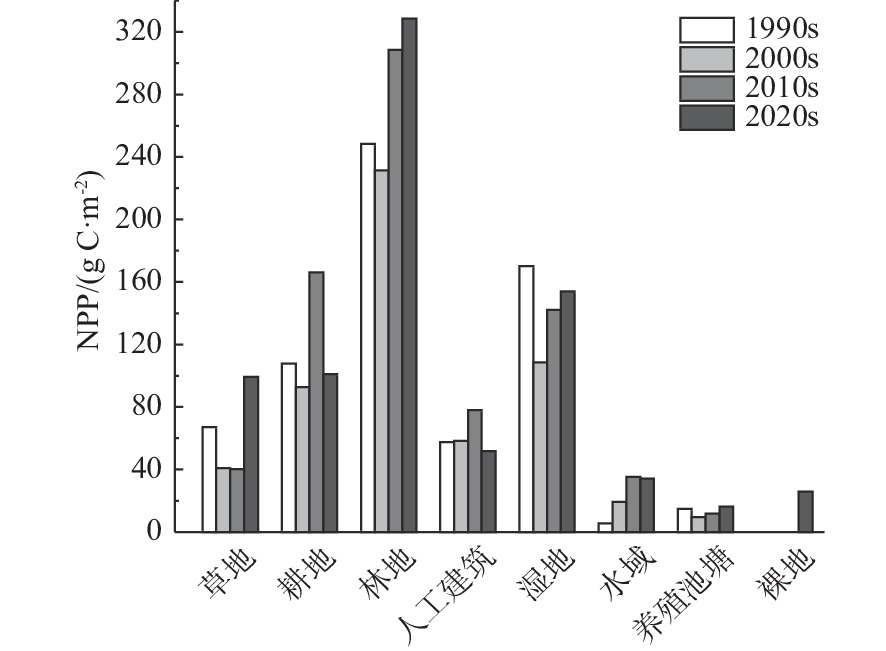
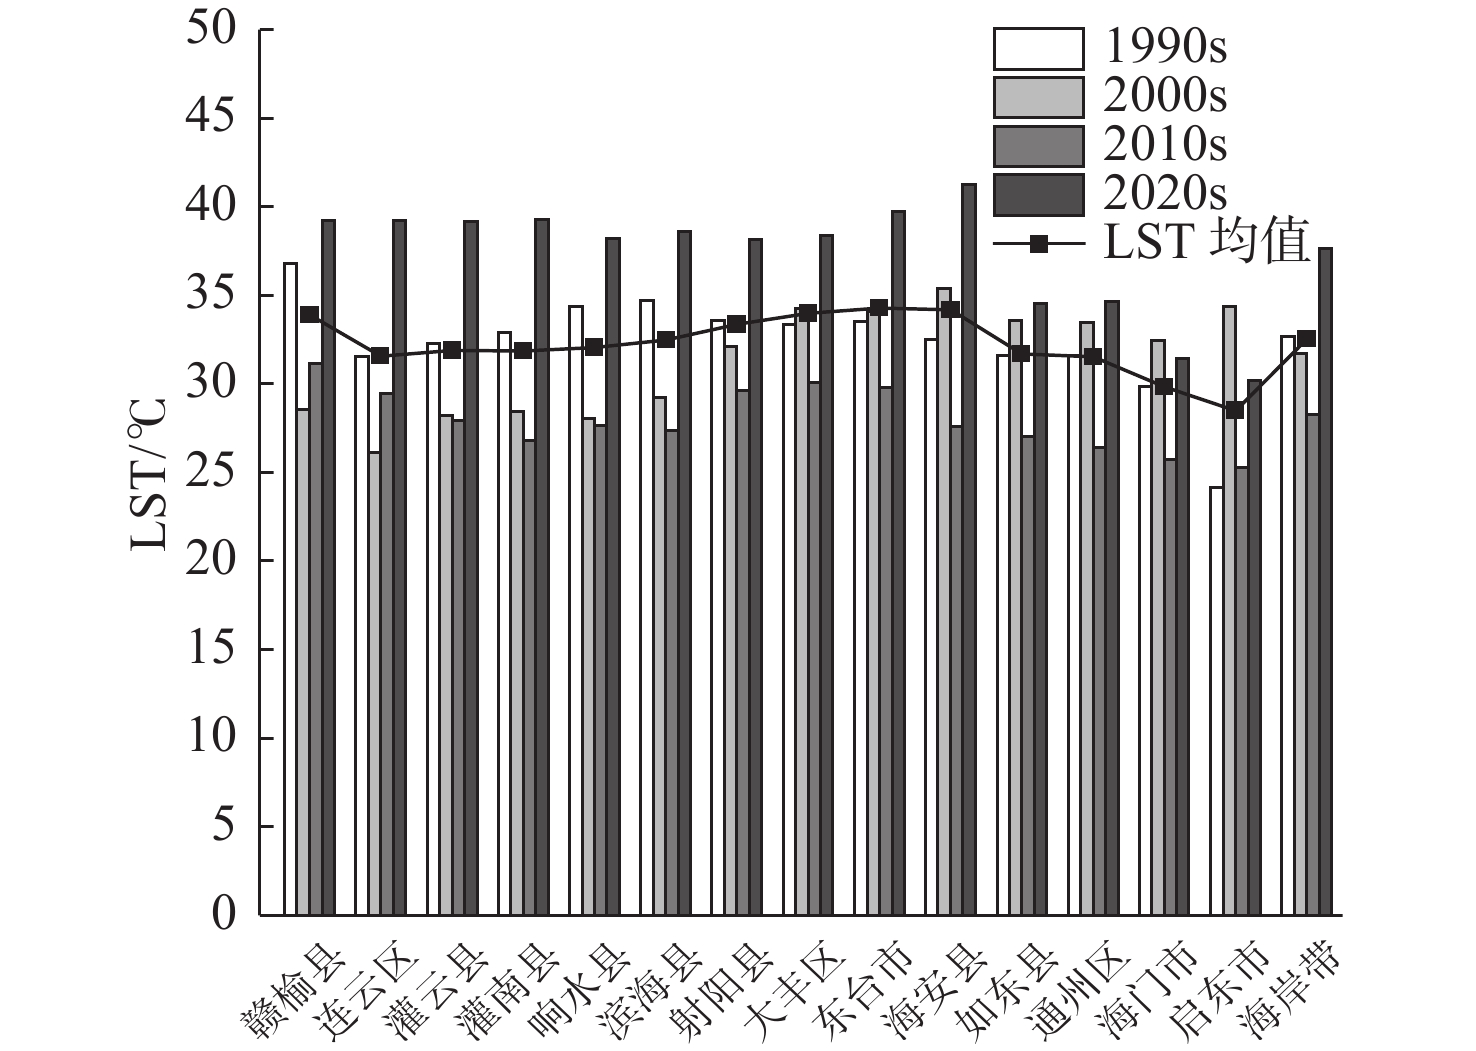
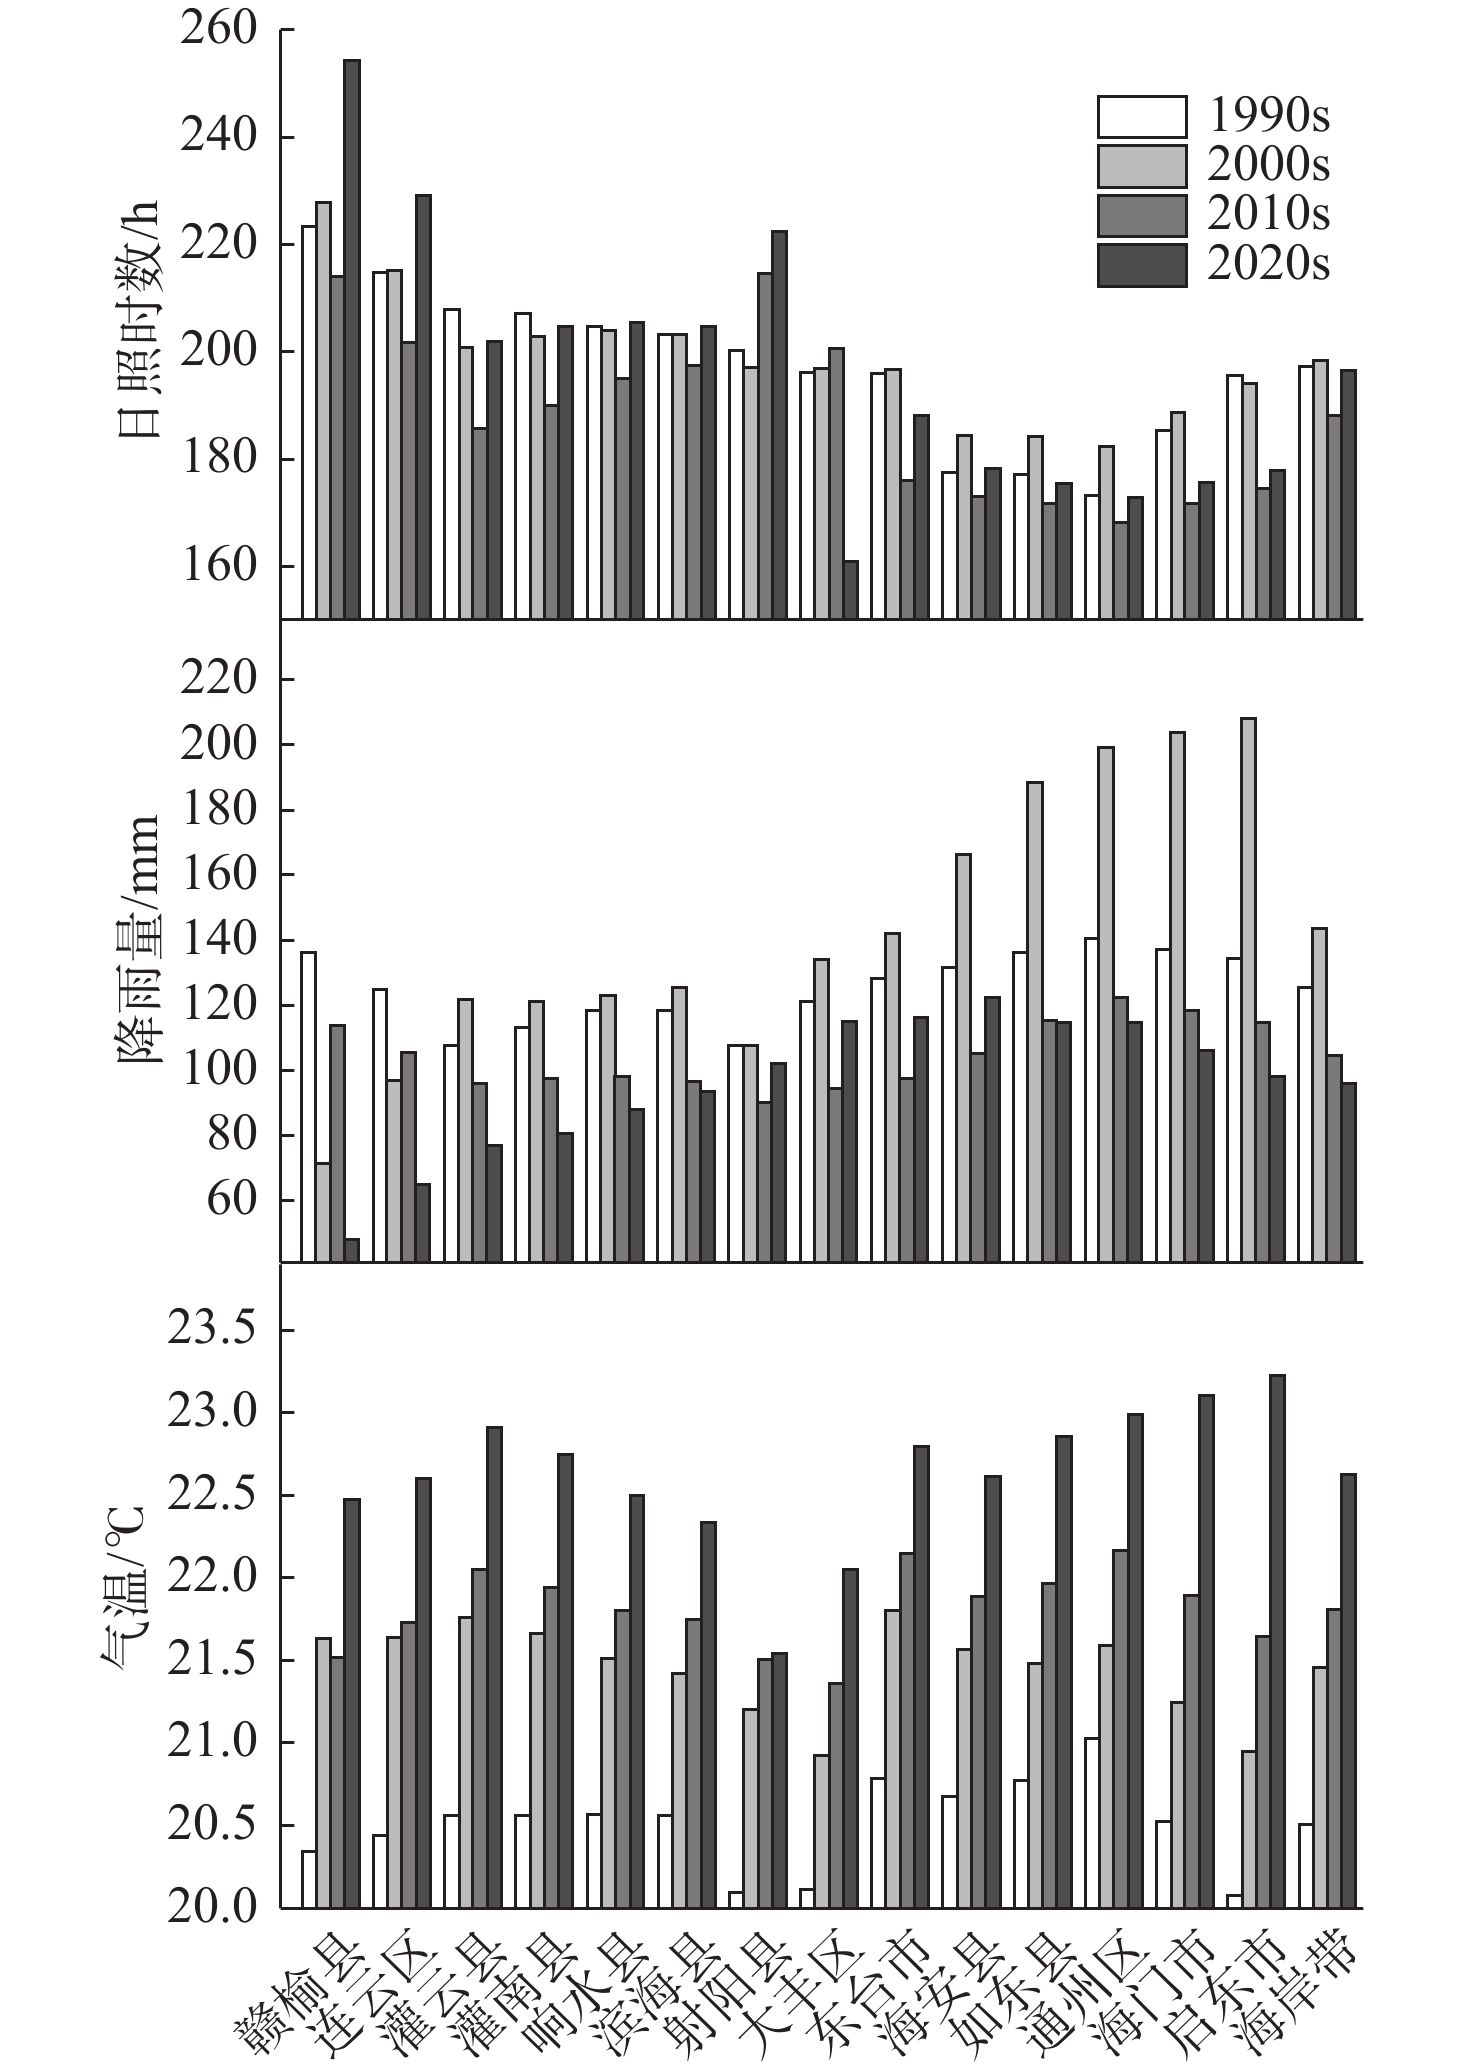
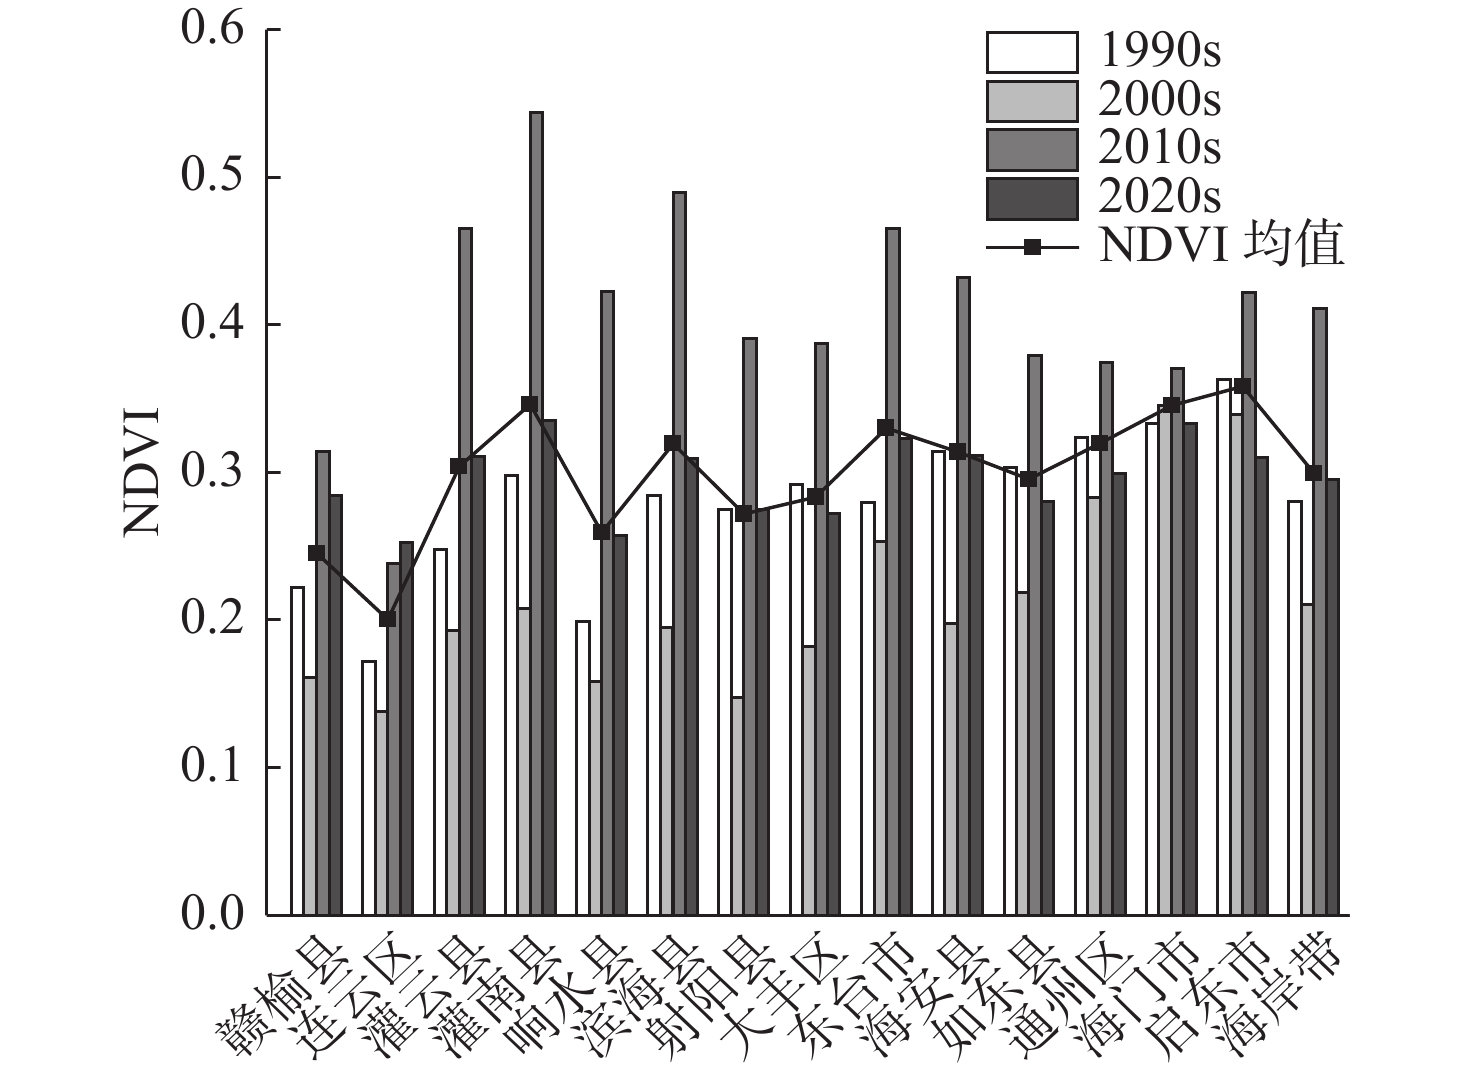
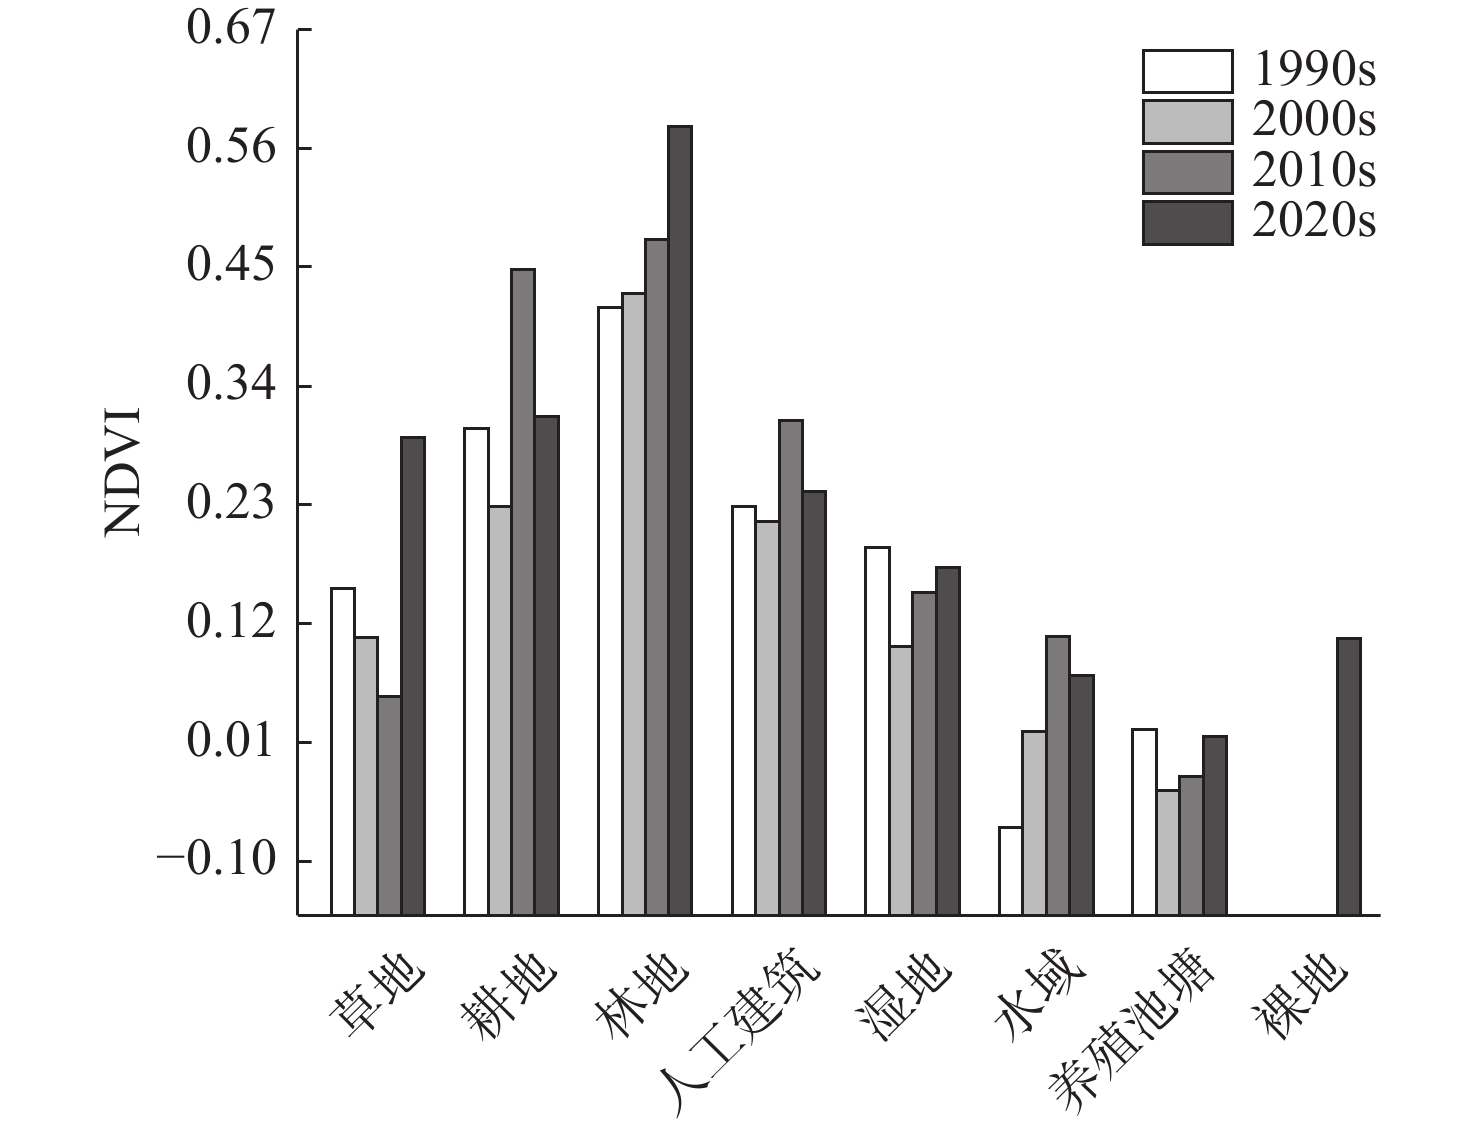
近30年来,复杂的气候变化与剧烈的人类活动造成江苏省海岸带生态演变剧烈,且呈现显著的空间异质性。植被净初级生产力(NPP)和地表温度(LST)是生态系统的2个关键参数,通过将1990—2020年Landsat遥感影像与CASA计算模型和相关性分析等方法结合,分析了江苏海岸带NPP和LST的时空变化及影响因素,结果表明:①由于人类对沿海滩涂资源的利用以及养殖业的发展等,江苏海岸带范围随岸线不断变化,岸线逐步向海推进,且南部向海推进范围大于北部。②近30年来,江苏海岸带NPP和LST呈现出显著的时空异质性特征。时间上1990、2000、2010、2020年代的NPP月均值分别为102.88、88.23、156.62、98.90 g C·m−2,呈现下降-上升-下降趋势,而LST月均值分别为32.6、31.7、28.3、37.6 ℃,呈现先下降后上升的趋势。空间上,NPP与LST在江苏海岸带南北分布呈现出一定差异性。③地表覆盖类型是影响江苏海岸带NPP和LST时空异质性的主要因素。林地的NPP最高,养殖池塘NPP最低;人工建筑的LST值最高,湿地、水域与养殖池塘的LST值相对较低。此外,随着气温升高,NPP和LST有逐渐上升的趋势,而植被覆盖度的升高则导致NPP上升和LST下降。
Abstract:In the past 30 years, complex climate change and increasingly frequent human activities have caused dramatic ecological evolution and significant spatial heterogeneity in the coastal zone of Jiangsu Province. The Net primary productivity (NPP) and land surface temperature (LST) are two key parameters of ecosystem. By combining the Landsat remote sensing images of the area from 1990 to 2020 with the CASA (Carnegie-Ames-Stanford Approach) computational model and correlation analysis, the spatial and temporal changes of NPP and LST in Jiangsu coastal zone and the influencing factors were analyzed. Results show that, ① due to the utilization of coastal beach resources and the development of aquaculture, the coastlines of Jiangsu have been gradually moving toward the sea, and the extent of moving to the sea in the southern part is greater than that in the northern part. ② The NPP and LST of Jiangsu coastal zone in the past 30 years show significant spatial and temporal heterogeneity. Temporally, the monthly mean values of NPP in 1990s, 2000s, 2010s, and 2020s are 102.88, 88.23, 156.62, and 98.90 g C·m−2, respectively, showing a decreasing-increasing-decreasing trend, while the mean values of LST are 32.6, 31.7, 28.3, and 37.6 ℃, showing a decreasing and then increasing trend. Spatially, the distributions of NPP and LST in the northern and southern parts of Jiangsu coastal zone showed certain differences. ③ NPP was the highest in forest land and the lowest in farming ponds; and LST values were the highest in artificial buildings and relatively low in wetlands, waters, and farming ponds. In addition, NPP and LST tended to increase gradually with increasing temperature and the increase of vegetation coverage led to the increase of NPP and decrease of LST.
-

-
表 1 遥感影像选取时间
Table 1. The dates of remote sensing image
项目 条带号 日期 Landsat 5 118/38 19910513 20000606 20080511 119/37 19890530 20000613 20090606 119/38 19920522 20000613 20100524 120/36 19920529 19990618 20070507 Landsat 8 118/38 20180523 119/37 20170527 119/38 20170527 120/36 20180606  下载: 导出CSV
表 2 近30年江苏海岸线参数变化
Table 2. Changes of coastline parameters of Jiangsu Province in the past 30 years
年代 海岸线长度/km 分形维数D 相关系数 相对误差 1990s 838.422 1.045 0.999 0.005 2000s 921.446 1.050 0.999 0.034 2010s 891.406 1.040 0.999 0.038 2020s 920.553 1.058 0.999 0.050
下载: 导出CSV
表 3 江苏海岸带不同土地覆盖类型的面积变化
Table 3. Changes in area of each land cover type in Jiangsu coastal zone
km2 年代 耕地 林地 养殖池塘 湿地 草地 人工建筑 水域 1990s 18 702.40 100.31 1 577.09 354.17 85.17 1 550.71 159.42 2000s 18 839.10 84.77 1 730.31 400.09 77.75 1 636.19 375.08 2010s 18 486.20 86.29 1 602.23 613.50 51.87 2 331.25 418.26 2020s 18 031.30 189.03 1 177.99 537.71 61.06 3 528.57 482.72
下载: 导出CSV
表 4 近30年地表温度与植被净初级生产力变化值相关性
Table 4. Correlation between net primary productivity and land surface temperature changes in the past 30 years
项目 2000-1990年NPP 2010-2000年NPP 2020-2010年NPP LST对应变化 0.276** 0.272** −0.178** 注:**在0.01水平(双侧)显著相关,*在0.05水平(双侧)显著相关。
下载: 导出CSV
表 5 近30年各个县级城市植被净初级生产力与地表温度的相关性
Table 5. Correlation between net primary productivity and land surface temperature in various county-level cities in the past 30 years
项目 1990s 2000s 2010s 2020s 海岸带 −0.020** 0.185** 0.062** 0.184** 赣榆县 0.044** 0.345** −0.126** −0.126** 连云区 0.036** 0.006 −0.009 −0.053** 灌云县 −0.071** 0.262** −0.161** 0.383** 灌南县 −0.329** −0.256** −0.117** 0.039** 响水县 0.333** 0.443** 0.362** 0.605** 滨海县 −0.043** 0.136** 0.205** 0.228** 射阳县 0.159** 0.071** 0.237** 0.383** 大丰区 −0.213** 0.084** 0.224** 0.377** 东台市 −0.402** −0.153** 0.379** 0.102** 海安县 −0.298** −0.095** 0.403** −0.070** 如东县 −0.062** −0.017** 0.164** 0.103** 通州区 −0.203** −0.022** −0.406** −0.123** 海门市 −0.054** −0.169** −0.409** −0.118** 启东市 −0.063** 0.068** −0.304** 0.172** 注:**在0.01水平(双侧)显著相关,*在0.05水平(双侧)显著相关。
下载: 导出CSV
表 6 近30年不同地表覆盖类型植被净初级生产力与地表温度的相关性
Table 6. Correlation between net primary productivity and land surface temperature of different land cover types in the past 30 years
项目 1990s 2000s 2010s 2020s 草地 0.041 0.360** 0.421** 0.248** 耕地 −0.112** 0.108** −0.030** 0.156** 林地 −0.277** −0.387** −0.103** −0.546** 人工建筑 −0.117** −0.503** −0.462** 0.013 湿地 −0.237** 0.100** 0.417** 0.344** 水域 0.592** 0.532** 0.438** 0.716** 养殖池塘 0.179** 0.328** 0.272** 0.459** 裸地 — — — −0.609** 注:**在0.01水平(双侧)显著相关,*在0.05水平(双侧)显著相关。
下载: 导出CSV
表 7 近30年植被净初级生产力与地表温度敏感性分析
Table 7. Sensitivity analysis of net primary productivity and land surface temperature in the past 30 years
项目 地表覆盖 降雨量 气温 日照时数 1990NPP 0.52 0.12 0.09 0.10 2000NPP 0.28 0.49 0.11 0.23 2010NPP 0.32 0.21 0.10 0.22 2020NPP 0.52 0.05 0.06 0.06 1990LST 0.04 0.27 0.08 0.14 2000LST 0.15 0.48 0.39 0.45 2010LST 0.06 0.06 0.08 0.08 2020LST 0.13 0.29 0.29 0.22
下载: 导出CSV
表 8 近30年植被净初级生产力与地表温度变化相关性分析
Table 8. Correlation between net primary productivity and land surface temperature changes in the past 30 years
项目 地表覆盖 降雨量 气温 日照时数 2000—1990NPP 0.342 0.750** −0.480 0.074 2010—2000NPP −0.145 0.662** −0.664** 0.219 2020—2010NPP −0.323 0.160 0.094 −0.253 2000—1990LST −0.527 0.847** −0.613* 0.272 2010—2000LST −0.543 0.939** 0.940** 0.941** 2020—2010LST 0.650 0.179 −0.497 0.172 注:**在0.01水平(双侧)显著相关,*在0.05水平(双侧)显著相关。
下载: 导出CSV
表 9 近30年植被净初级生产力与地表温度变化敏感性分析
Table 9. Sensitivity analysis of net primary productivity and land surface temperature changes in the past 30 years
项目 地表覆盖 降雨量 气温 日照时数 2000-1990NPP 0.01 0.36 0.14 0.02 2010-2000NPP 0.11 0.34 0.36 0.12 2020-2010NPP 0.08 0.15 0.08 0.23 2000-1990LST 0.07 0.53 0.38 0.02 2010-2000LST 0.06 0.38 0.34 0.13 2020-2010LST 0.09 0.04 0.13 0.10
下载: 导出CSV
-
[1] 沙宏杰,张东,施顺杰,等. 基于耦合模型和遥感技术的江苏中部海岸带生态系统健康评价[J]. 生态学报,2018,38(19):7102-7112.
[2] 崔昊天,贺桂珍,吕永龙,等. 海岸带城市生态承载力综合评价:以连云港市为例[J]. 生态学报,2020,40(8):2567-2576.
[3] 张旭,张继伟,陈凤桂,等. 基于GIS的海口海岸带空间功能分区研究[J]. 海洋开发与管理,2020,38(5):35-41.
[4] 戴亚南,彭检贵. 江苏海岸带生态环境脆弱性及其评价体系构建[J]. 海洋学研究,2009,27(1):78-82.
[5] 毋亭,侯西勇. 海岸线变化研究综述[J]. 生态学报,2016,36(4):1170-1182.
[6] 刘玉斌,李宝泉,王玉珏,等. 基于生态系统服务价值的莱州湾–黄河三角洲海岸带区域生态连通性评价[J]. 生态学报,2019,39(20):7514-7524.
[7] HALPERN B S,WALBRIDGE S,SELKOE K A,et al. A global map of human impact on marine ecosystems[J]. Science,2008,319(5865):948-952. doi: 10.1126/science.1149345
[8] 孙晓萌,吕晨璨,张雪琦,等. 粤港澳大湾区海岸带生态修复工程中的景感生态学应用分析[J]. 生态学报,2020,40(22):8044-8052.
[9] 闫少锋,陆茜,张金池,等. 江苏沿海地区NDVI的演变特征及其对区域气候变化的响应[J]. 南京林业大学学报(自然科学版),2012,36(1):43-47.
[10] 殷国梅,冀超,刘思博,等. 毛乌素沙化草地植被群落特征及物种多样性对不同生态修复措施的响应[J]. 畜牧与饲料科学,2022,43(1):68-75. doi: 10.12160/j.issn.1672-5190.2022.01.011
[11] 朱永华,席小康,马鹏飞,等. 植被净初级生产力时空变化及其影响因素分析[J]. 内蒙古农业大学学报(自然科学版),2021,43(1):21-26.
[12] 池源,石洪华,王晓丽,等. 庙岛群岛南五岛生态系统净初级生产力空间分布及其影响因子[J]. 生态学报,2015,35(24):8094-8106.
[13] 张静静,郝海超,郝兴明,等. 塔里木河下游生态输水对天然植被NPP的影响[J]. 干旱区地理,2020,44(3):708-717.
[14] 刘宇,匡耀求,吴志峰,等. 不同土地利用类型对城市地表温度的影响:以广东东莞为例[J]. 地理科学,2006,26(5):5597-5602.
[15] 吴虹蓉,施冬. 基于Landsat卫星的植被覆盖度和地表温度关系研究[J]. 科技经济导刊,2021,29(12):120-121.
[16] 安彬,肖薇薇,张淑兰,等. 1960—2017年黄土高原地表温度时空变化特征[J]. 干旱区地理,2021,44(3):778-785. doi: 10.12118/j.issn.10006060.2021.03.20
[17] 池源,石洪华,孙景宽,等. 近30年来黄河三角洲植被净初级生产力时空特征及主要影响因素[J]. 生态学报,2018,38(8):2683-2697.
[18] FIELD C B,BEHRENFELD M J,RANDERSON J T,et al. Primary production of the biosphere:integrating terrestrial and oceanic components[J]. Science,1998,281(5374):237-240. doi: 10.1126/science.281.5374.237
[19] 谷雷,岳彩荣,张国飞,等. 基于Google Earth Engine平台的大湄公河次区域2001—2019年植被NPP时空变化分析[J]. 西部林业科学,2021,50(2):132-139.
[20] 陈峰,李红波,刘亚静. 基于GIS和CASA的滇南山区植被NPP时空分异及其影响因素:以云南省元阳县为例[J]. 生态学杂志,2018,37(7):2148-2158.
[21] LIU Y Y,YANG Y,WANG Q,et al. Assessing the dynamics of grassland net primary productivity in response to climate change at the global scale[J]. Chinese Geographical Science,2019,29(5):725-740. doi: 10.1007/s11769-019-1063-x
[22] 任晋媛,佟斯琴,包玉海,等. 内蒙古地区极端气候变化及其对植被净初级生产力的影响[J]. 生态学杂志,2021,40(8):2410-2420.
[23] 王金杰,赵安周,张兆江,等. 2000—2018年京津冀地区植被净初级生产力时空演变及其驱动因素[J]. 生态科学,2021,40(1):103-111.
[24] ZHAO F B,WU Y P,SIVAKUMAR B,et al. Climatic and hydrologic controls on net primary production in a semiarid loess watershed[J]. Journal of Hydrology,2018,568:803-815.
[25] 刘婧,汤峰,张贵军,等. 2000—2015年滦河流域植被净初级生产力时空分布特征及其驱动因子分析[J]. 中国生态农业学报(中英文),2021,29(4):659-671.
[26] DASH P,GOTTSCHE F M,OLESEN F S,et al. Land surface temperature and emissivity estimation from passive sensor data:theory and practice–current trends[J]. International Journal of Remote Sensing,2002,23(13):2563-2594. doi: 10.1080/01431160110115041
[27] LI Z L,BECKER F. Feasibility of land surface temperature and emissivity determination from AVHRR data[J]. Remote Sensing of Environment,1993,43(1):67-85. doi: 10.1016/0034-4257(93)90065-6
[28] 王丽平,段四波,张霄羽,等. 2003—2018年中国地表温度年最大值的时空分布及变化特征[J]. 干旱区地理,2021,44(5):1299-1308.
[29] 沈中健,曾坚. 1996—2017年闽三角城市群区域热岛时空格局演化分析[J]. 安全与环境学报,2020,20(4):1567-1578.
[30] 孙凤云,邓灵稚,刘垚燚,等. 基于增强回归树与区域增温敏感性指数的城市升温效应空间分异研究[J]. 生态学报,2021,41(15):5929-5939.
[31] 陆晓君,刘珍环. 城市“源–汇”热景观变化及其空间作用强度特征:以深圳西部地区为例[J]. 生态学报,2021,41(16):6329-6338.
[32] 宁立新,周云凯,张启斌,等. 近19年江苏海岸带地区土地利用变化特征[J]. 水土保持研究,2017,24(4):227-233.
[33] 胡雪松,贾济红,吴凌颖. 1985—2015年江苏省海岸线变迁研究[J]. 测绘技术装备,2019,21(1):22-25.
[34] 孙伟红,黄燕,黄博. 江苏省海岸线时空变化特征研究[J]. 现代测绘,2018,41(4):32-35.
[35] 许凤娇,吕晓. 基于土地利用变化的江苏沿海地区生态风险格局[J]. 生态学报,2018,38(20):7312-7325.
[36] 邵琦,王思懿,杨春熙,等. Landsat 5 TM、Landsat 7 ETM+及Landsat 8 OLI交叉定标研究[J]. 产业与科技论坛,2017,16(17):54-57.
[37] 马小峰,邹亚荣,刘善伟. 基于分形维数理论的海岸线遥感分类与变迁研究[J]. 海洋开发与管理,2015,32(1):30-33. doi: 10.3969/j.issn.1005-9857.2015.01.008
[38] POTTER C S,RANDERSON J T,FIELD C B,et al. Terrestrial ecosystem production:a process model based on global satellite and surface data[J]. Global Biogeochemical Cycles,1993,7(4):811-841. doi: 10.1029/93GB02725
[39] 覃志豪,LI W J,ZHANG M H,等. 单窗算法的大气参数估计方法[J]. 国土资源遥感,2003(2):37-43.
[40] 覃志豪,ZHANG M H,ARNON K,等. 用陆地卫星TM6数据演算地表温度的单窗算法[J]. 地理学报,2001,56(4):456-466.
[41] 覃志豪,李文娟,徐斌,等. 陆地卫星TM6波段范围内地表比辐射率的估计[J]. 国土资源遥感,2004(3):28-32,36-41,74.
[42] 池源,石洪华,王晓丽,等. 庙岛群岛南五岛地表温度时空特征及影响因子[J]. 生态学杂志,2015,34(8):2309-2319.
[43] CHI Y,SUN J K,SUN Y G,et al. Multi–temporal characterization of land surface temperature and its relationships with normalized difference vegetation index and soil moisture content in the Yellow River Delta,China[J]. Global Ecology and Conservation,2020,23:e01092. doi: 10.1016/j.gecco.2020.e01092
[44] RUJOIU-MARE M R,MIHAI B A. Mapping land cover using remote sensing data and GIS techniques:a case study of Prahova Subcarpathians[J]. Procedia Environmental Sciences,2016,32:244-255. doi: 10.1016/j.proenv.2016.03.029
[45] CHEN J,CHEN L J,CHEN F,et al. Collaborative validation of GlobeLand30:methodology and practices[J]. Geo-spatial Information Science,2021,24(1):134-144. doi: 10.1080/10095020.2021.1894906
[46] 朱文泉,潘耀忠,何浩,等. 中国典型植被最大光利用率模拟[J]. 科学通报,2006,51(6):700-706.
[47] CHI Y,SHI H H,WANG X L,et al. The spatial distribution and impact factors of net primary productivity in the island ecosystem of five southern islands of Miaodao Archipelago[J]. Acta Ecologica Sinica,2015,35(24):8094-8106.
[48] 朱文泉,潘耀忠,张锦水. 中国陆地植被净初级生产力遥感估算[J]. 植物生态学报,2007,31(3):413-424.
[49] QIN Z H,DALL'OLMO G,KARNIELI A,et al. Derivation of split window algorithm and its sensitivity analysis for retrieving land surface temperature from NOAA‐advanced very high resolution radiometer data[J]. Journal of Geophysical Research:Atmospheres,2001,106(D19):22655-22670. doi: 10.1029/2000JD900452
[50] 王敬文,赵微,叶江霞,等. 应用Landsat–8数据分析山地地表温度格局及影响要素[J]. 东北林业大学学报,2021,49(5):97-104. doi: 10.3969/j.issn.1000-5382.2021.05.017
[51] 元冰瑜,高建华,池源,等. 1990—2020年江苏省海岸带景观生态状况指数跨尺度时空特征[J]. 应用生态学报,2022,33(2):489-499.
[52] 王劲峰,徐成东. 地理探测器:原理与展望[J]. 地理学报,2017,72(1):116-134.
[53] 都彦廷,张冬有. 大兴安岭地区2001—2019年地表温度时空分布及影响因素分析[J]. 森林工程,2020,36(6):9-18. doi: 10.3969/j.issn.1006-8023.2020.06.002
[54] CHI Y,ZHANG Z W,GAO J H,et al. Evaluating landscape ecological sensitivity of an estuarine island based on landscape pattern across temporal and spatial scales[J]. Ecological Indicators,2019,101:221-237. doi: 10.1016/j.ecolind.2019.01.012
[55] 任景全,刘玉汐,王丽伟,等. 吉林省地表温度时空变化及影响因素研究[J]. 中国农学通报,2020,36(5):103-109.
-


图(13)
表(9)
计量
- 文章访问数: 1172
- PDF下载数: 117
- 施引文献: 0