

Assessment of nutrient pollution and eutrophication in Hangzhou Bay and its adjacent waters in summer
-
摘要:
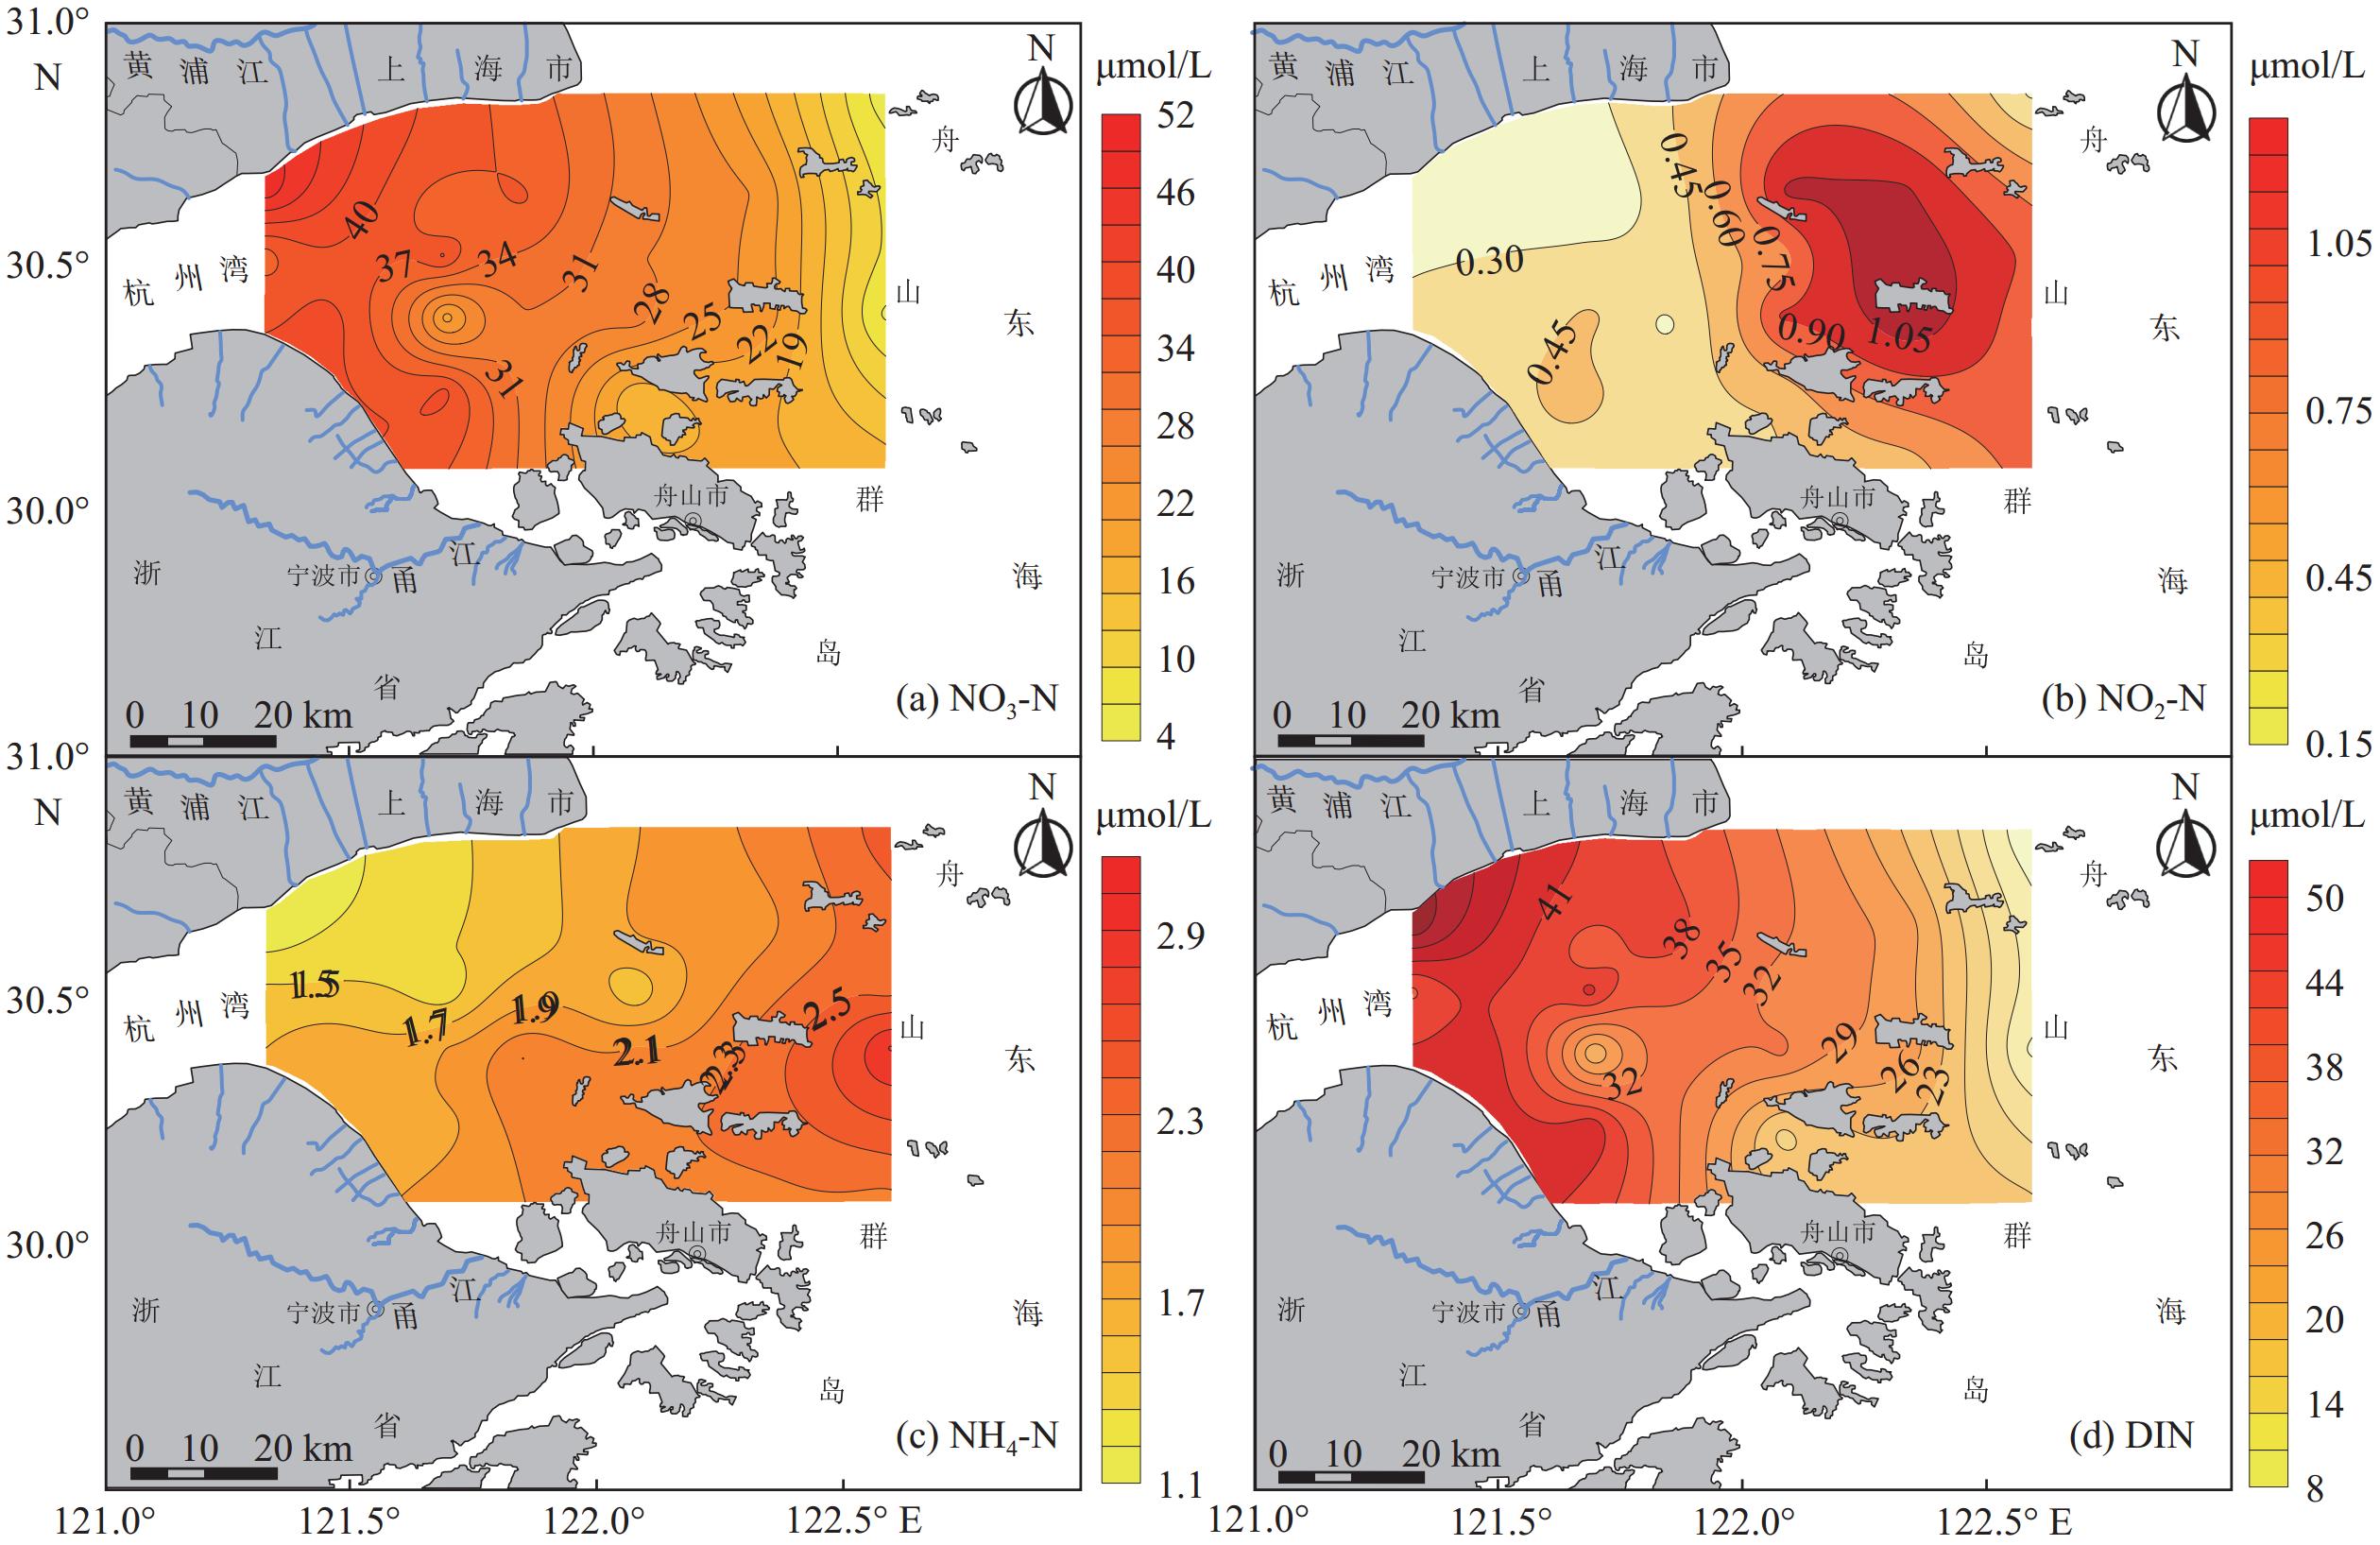
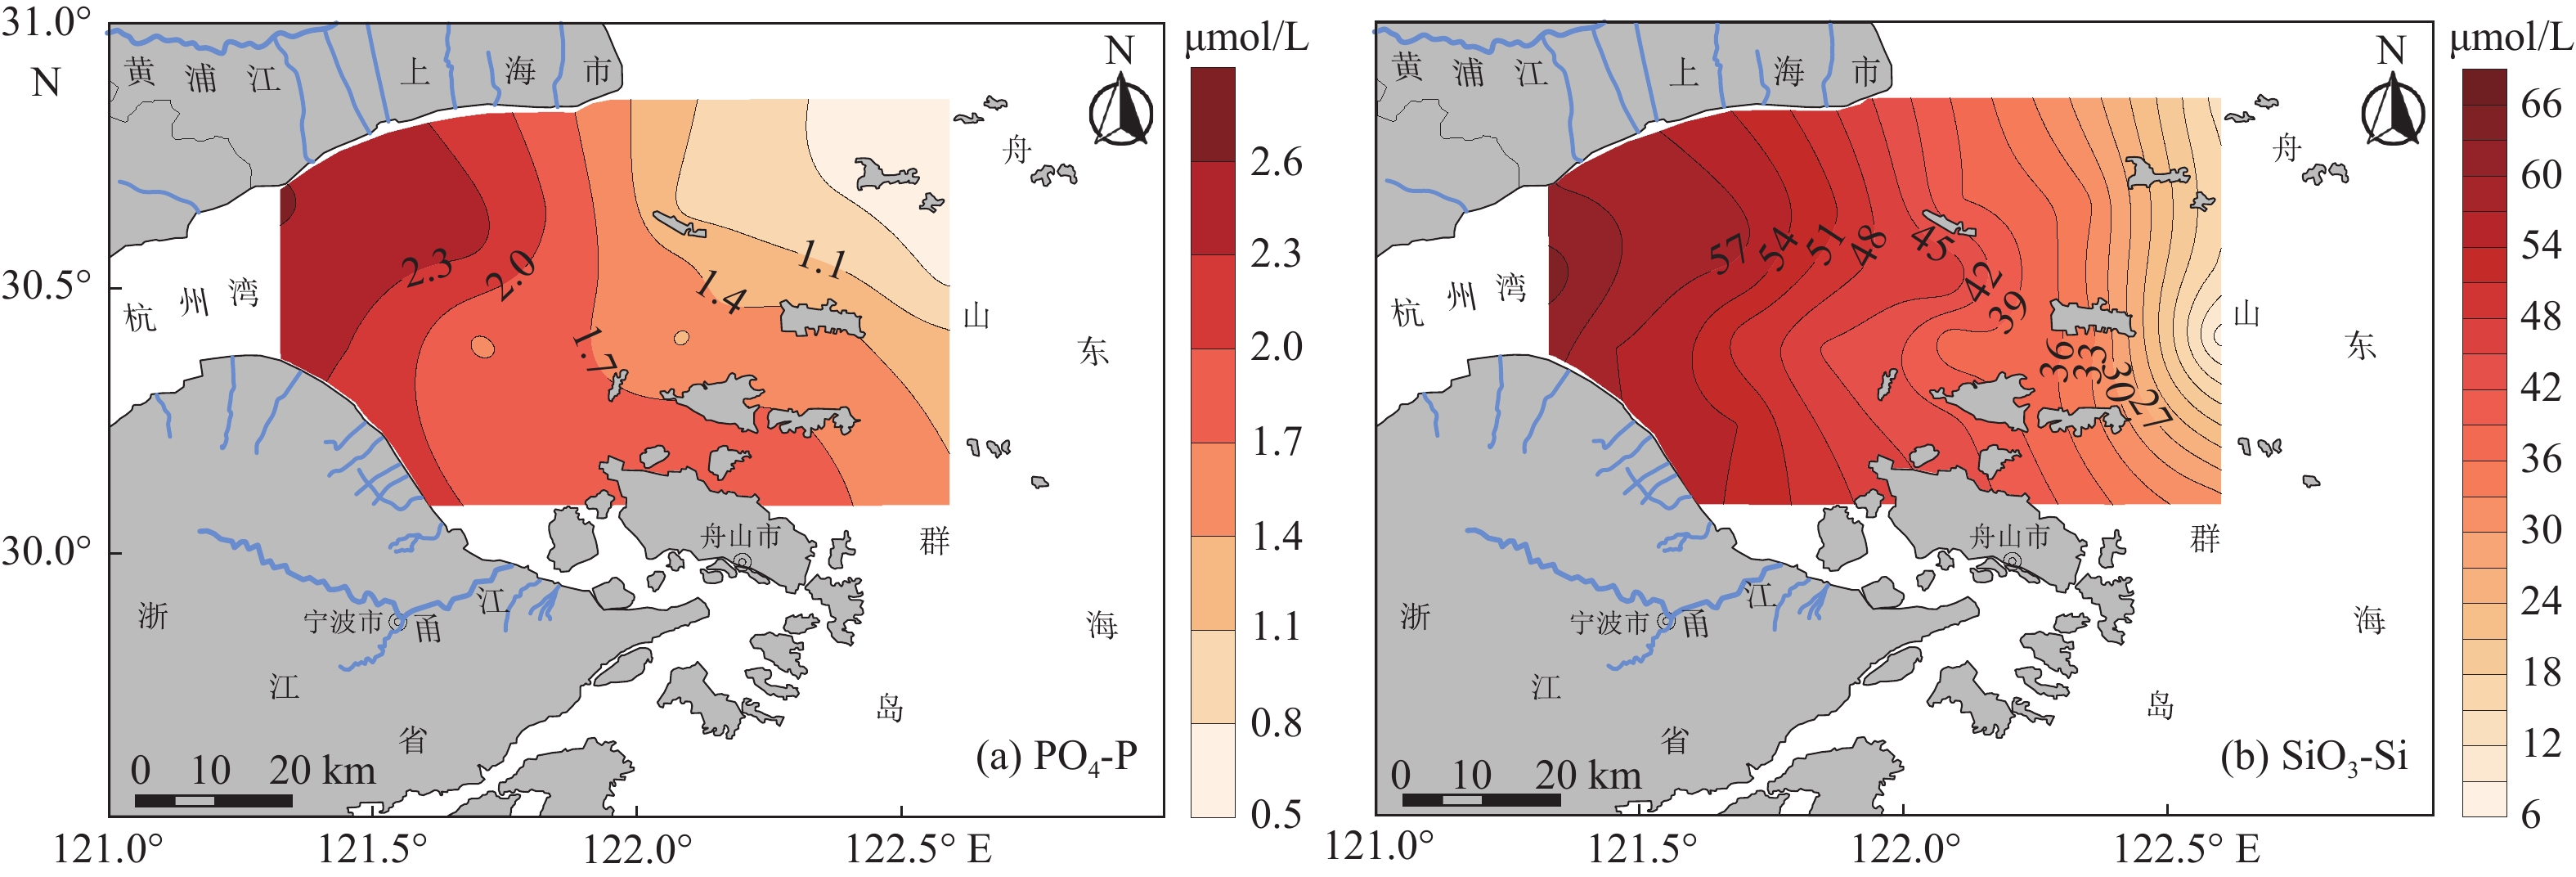
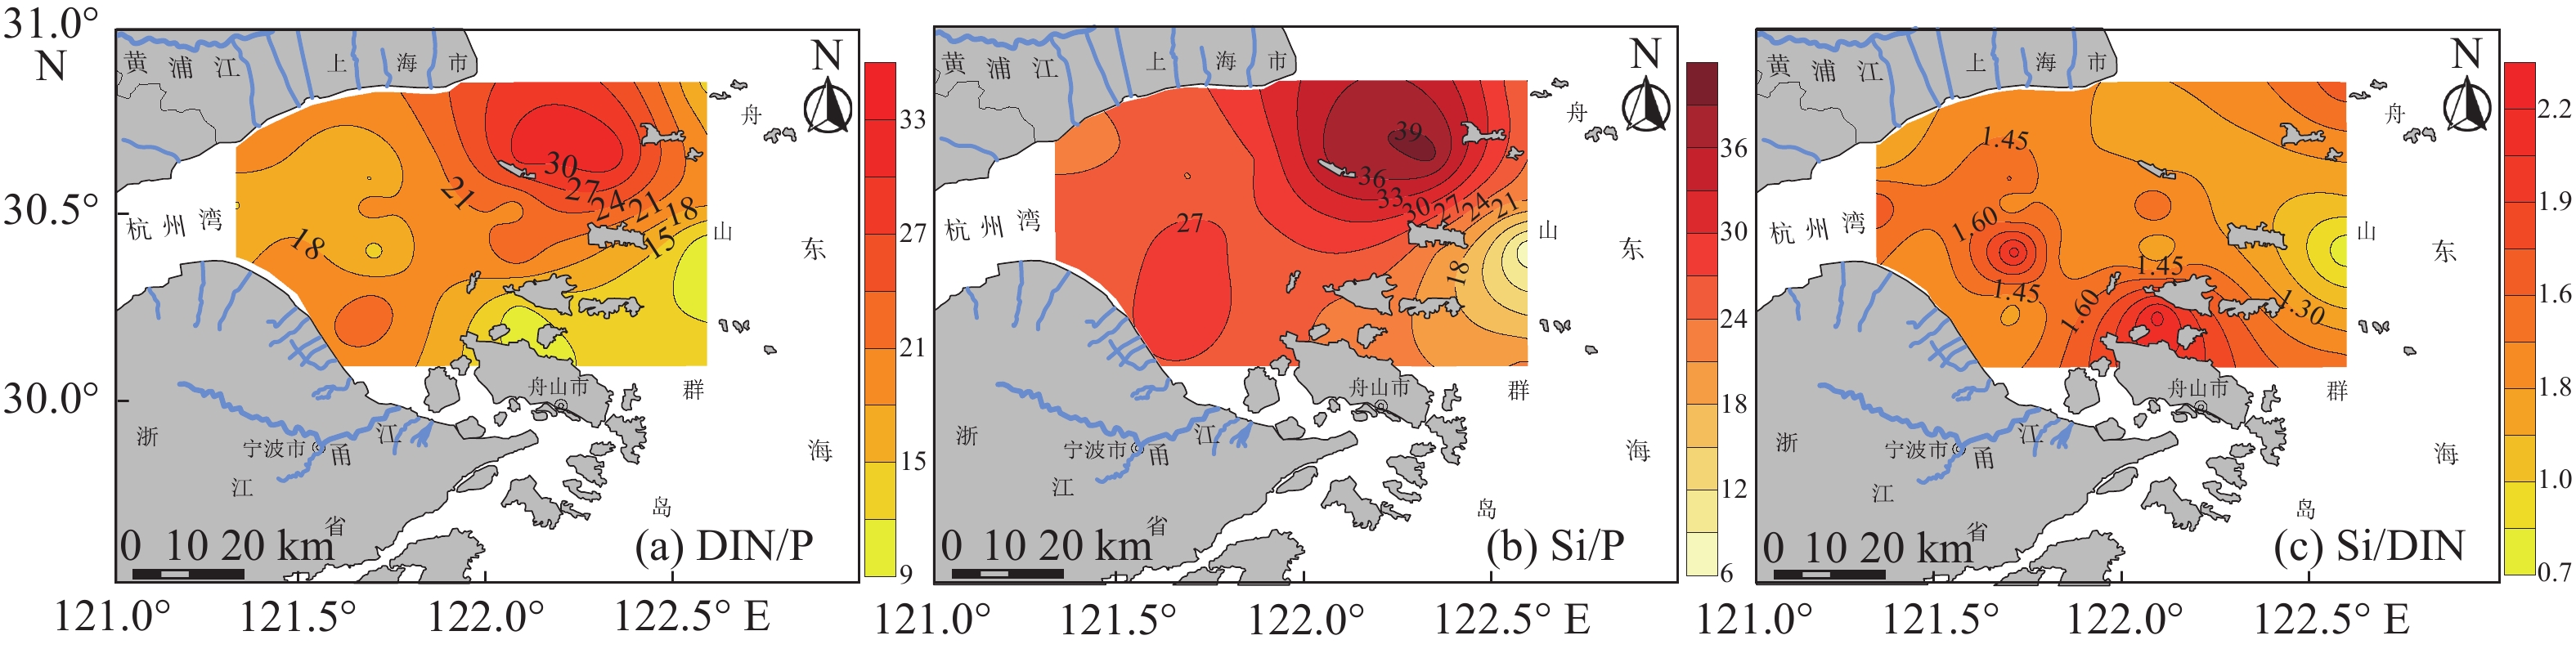
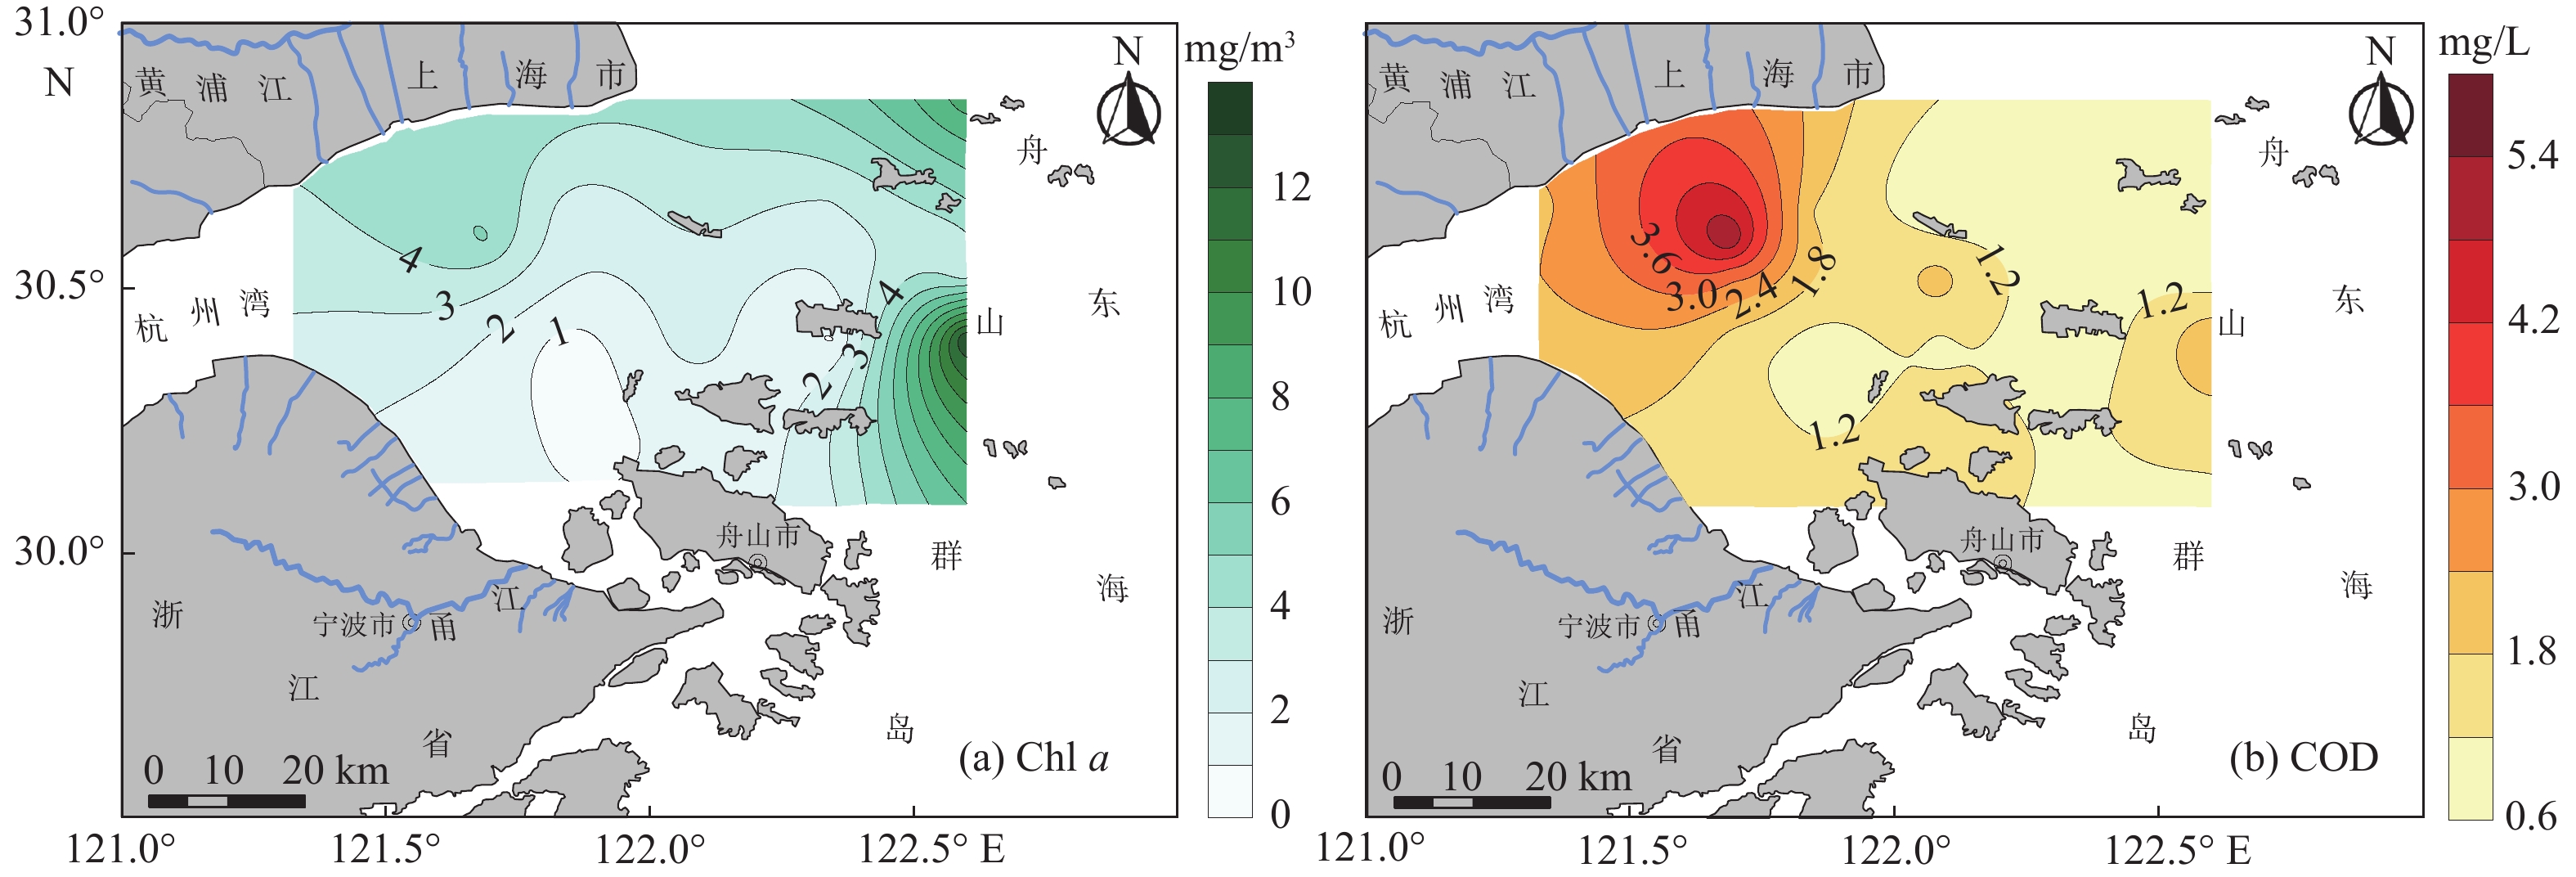
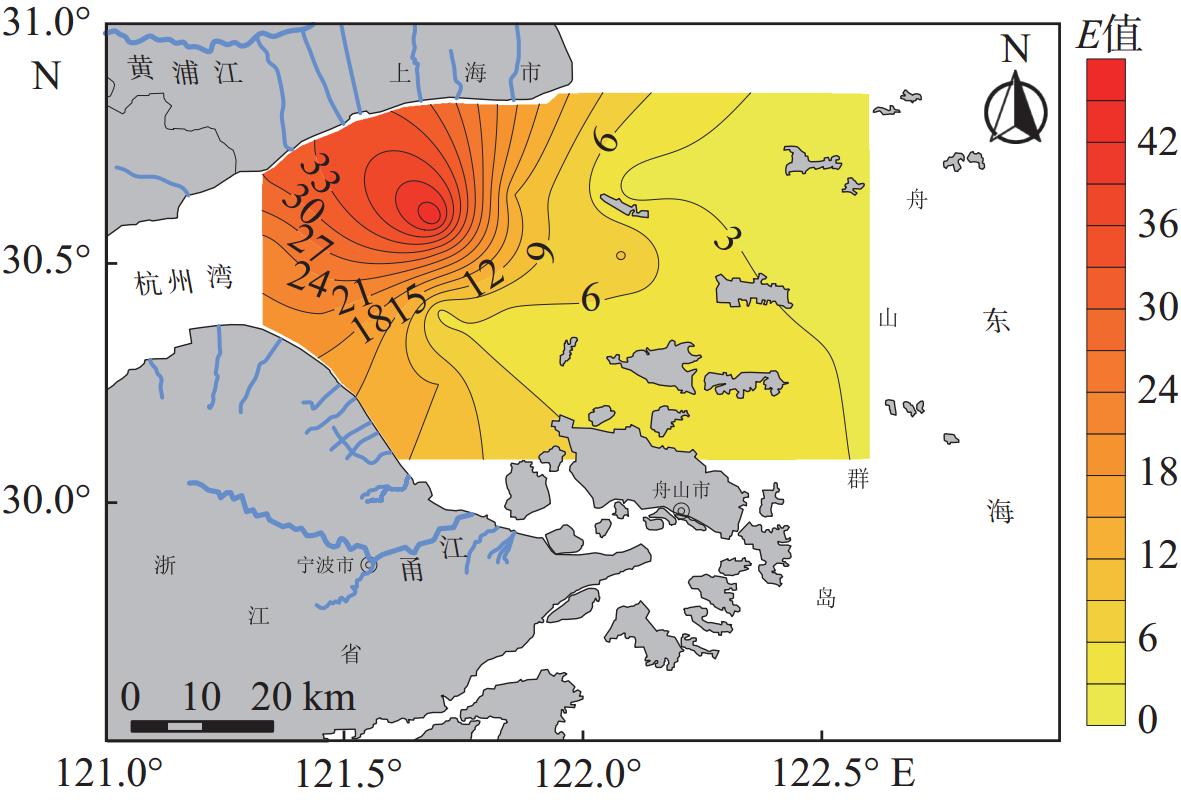
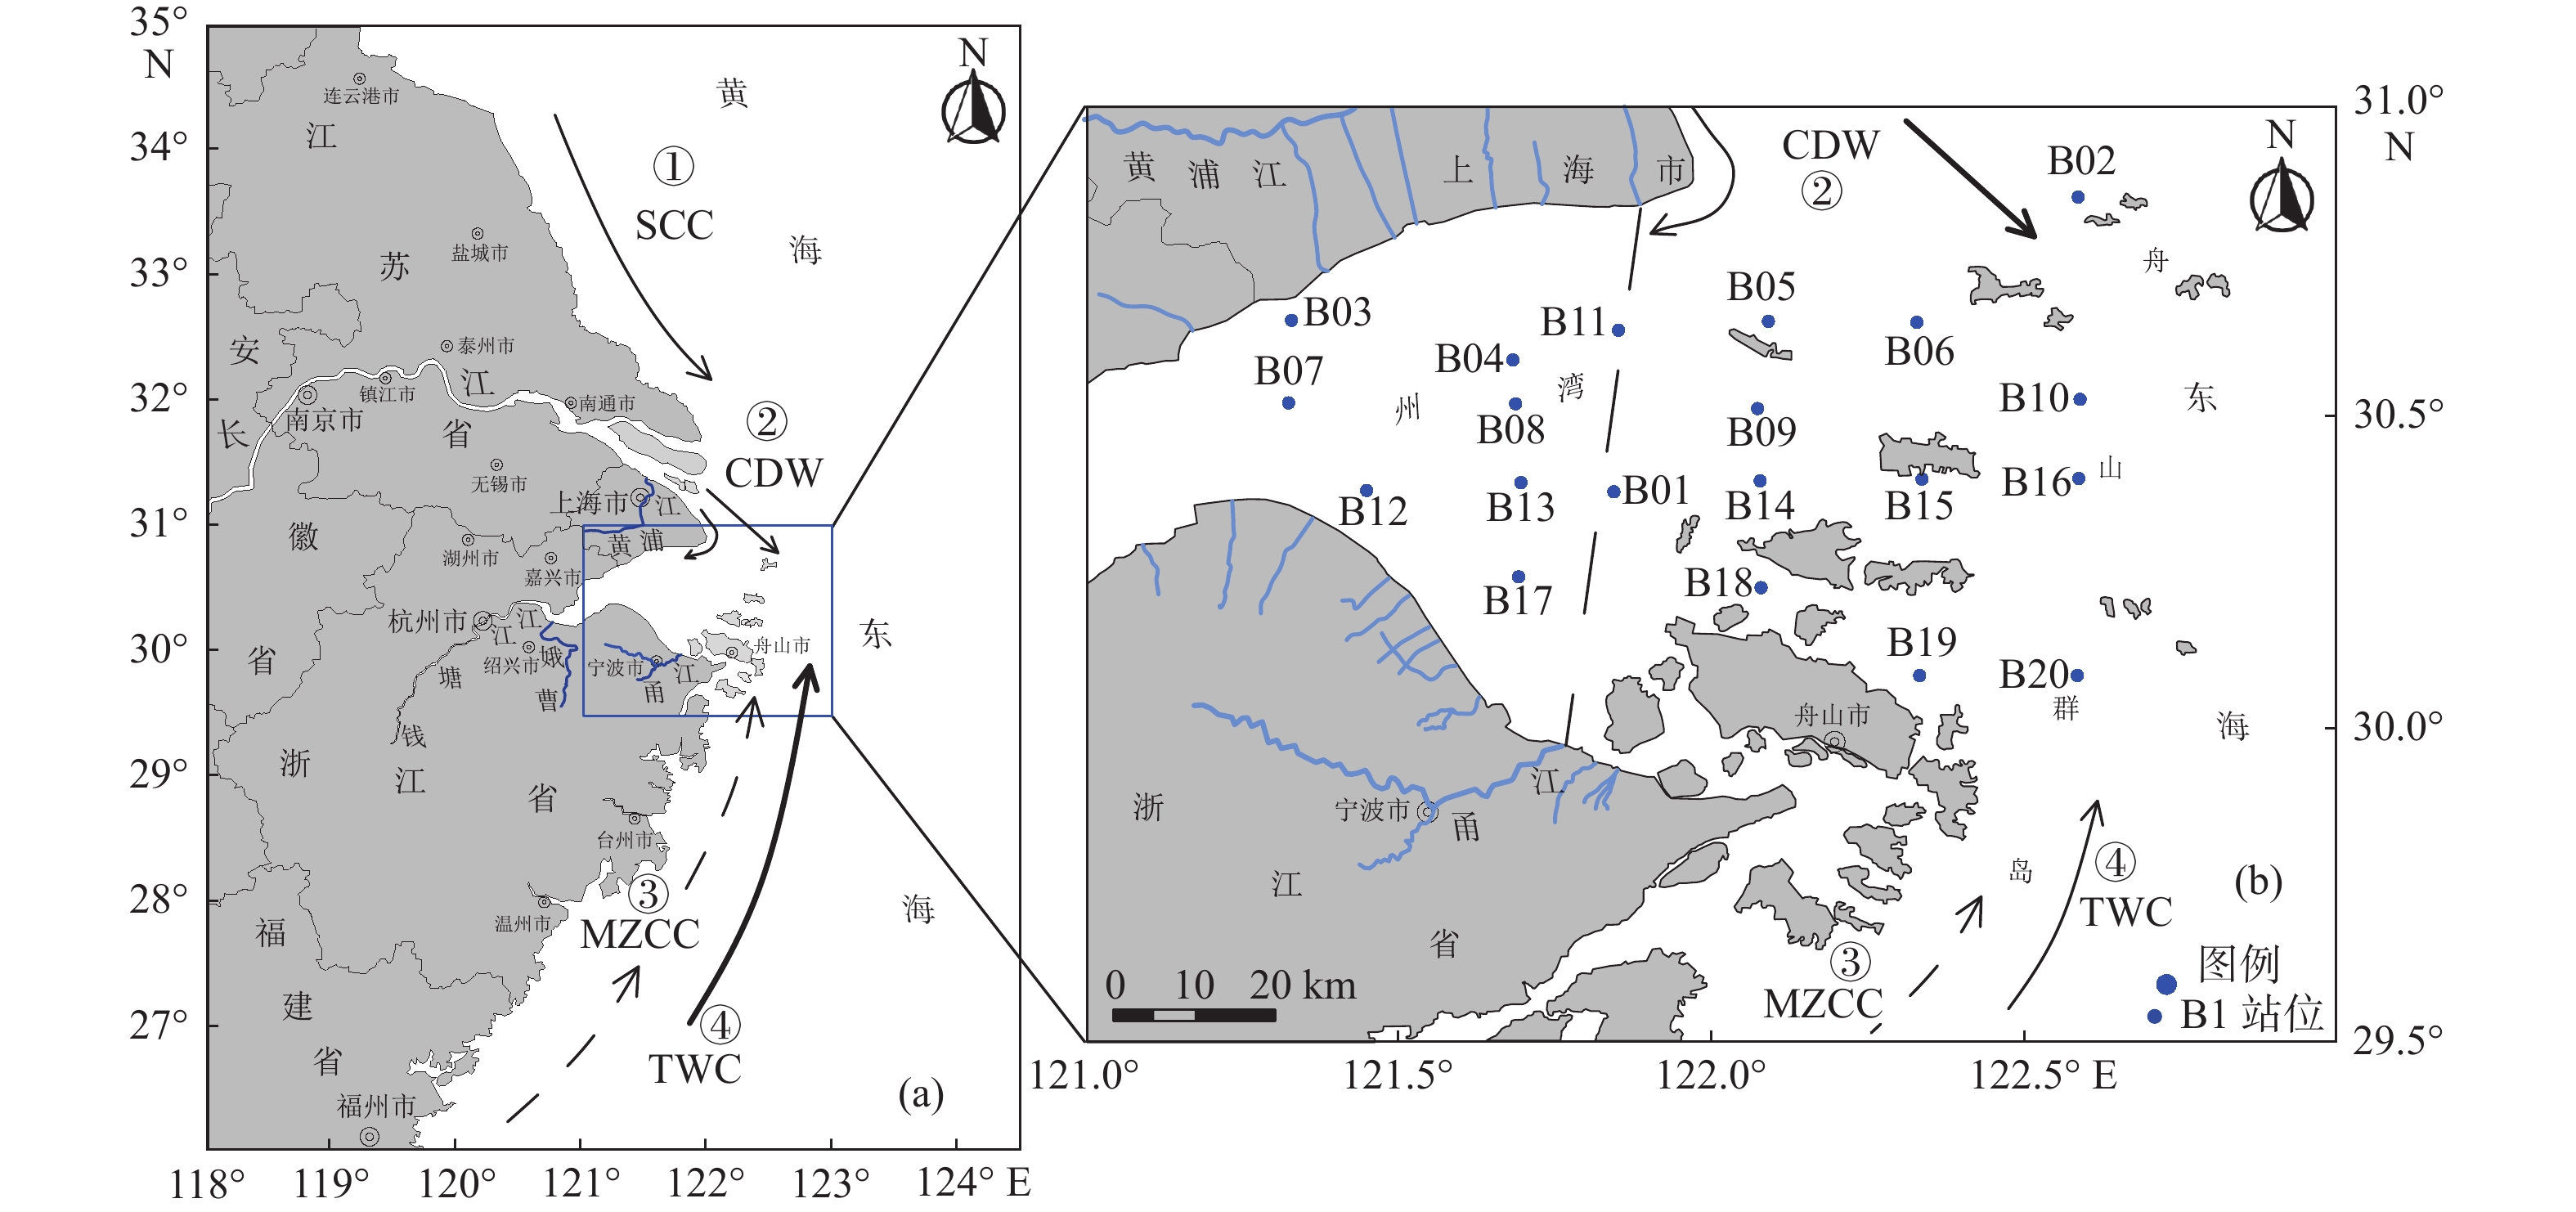
基于2022年夏季对杭州湾及其邻近海域的生态环境调查数据,采用单因子污染指数法、营养盐结构和限制性分析与富营养化状态指数法分别对该区表层营养盐和有机污染特征进行系统研究,对其富营养化状况进行系统评价,并通过Pearson相关性统计分析初步探讨了营养盐污染对浮游植物生长的影响以及水域富营养化的控制因素。结果表明,该区氮(N)、磷(P)污染较为严重,溶解无机氮(DIN)和溶解无机磷(DIP)含量超过国家第Ⅲ类海水水质标准的站位数量占比分别为55%和80%;海水表层N/P和Si/P比值失衡,分别有20%和5%的站位水体浮游植物生长存在P和Si潜在限制。调查区叶绿素a (Chl a)含量主要受水体透明度的影响,呈现东部高于西部、湾外高于湾内的空间分布特征;其中,湾外东部水域Chl a含量较高,表明藻类细胞密度较大,存在暴发赤潮的风险。化学耗氧量(COD)的调查结果表明,该区总体有机污染并不显著,95%的站位符合国家第Ⅲ类水质标准。富营养化评价结果表明,该区90%的站位处于富营养化状态,其中40%的站位为重度富营养化;富营养化因子对E值的贡献排序为COD>DIN>DIP。初步研究表明,杭州湾及其邻近海域存在N、P营养盐污染,水体的富营养化问题值得关注并有待开展后续研究。
Abstract:Based on the ecological environment survey data of Hangzhou Bay and its adjacent waters in summer 2022, by using the single factor pollution index method, nutrient structure and limitation analysis, and eutrophication status index method, the characteristics of surface nutrient and organic pollution in the bay were systematically studied, and the eutrophication status was evaluated. Through the Pearson correlation statistical analysis, the impact of nutrient pollution on the growth of phytoplankton and the control factors of eutrophication in water bodies were preliminarily explored. Results indicate that the pollution of nitrogen (N) and phosphorus (P) nutrients in the region was relatively severe. 55% and 80% of the stations in which dissolved inorganic nitrogen (DIN) and dissolved inorganic phosphorus (DIP) content exceeded China's national Class III seawater quality benchmarks, respectively. The N/P and Si/P ratios of surface seawater were imbalanced, and 20% and 5% of the stations showed potential limitations of P and Si on the growth of phytoplankton, respectively The chlorophyll a (Chl a) content was mainly affected by the transparency of the water body, showing a spatial distribution characteristic: higher in the east than in the west, and higher outside the bay than inside the bay. The Chl a content in the eastern waters outside the bay was relatively high, indicating a high density of algae cells and a risk of red tide outbreaks. The survey results of chemical oxygen demand (COD) indicate that the overall organic pollution in the area is not significant, and 95% of the stations could meet China’s national Class Ⅲ water quality benchmarks. Results of the eutrophication assessment indicate that 90% of the stations in the area were in eutrophication state (40% were severely eutrophicated). The order of contribution to the eutrophication was COD>DIN>DIP. Preliminary studies have shown that N and P nutrient pollution still exists in the Hangzhou Bay and its adjacent waters, and the eutrophication of water bodies deserves attention and further research is needed.
-
Key words:
- Hangzhou Bay /
- nutrients /
- eutrophication /
- phytoplankton /
- influencing factor
-

-
表 1 营养盐限制评价标准
Table 1. Assesment criteria of nutrient limitation
绝对限制 阈值评价标准 潜在限制 比值评价标准 N绝对限制 DIN<1 μmol/L N潜在限制 DIN/P<10,Si/DIN>1 P绝对限制 P<0.03 μmol/L P潜在限制 DIN/P>22,Si/P>22 Si绝对限制 Si<2 μmol/L(硅藻) Si潜在限制 Si/P<10,Si/DIN<1  下载: 导出CSV
富营养化 非富营养化 轻度富营养化 中度富营养化 重度富营养化 E E<1 1<E≤3 3<E≤9 E>9
下载: 导出CSV
表 3 调查区表层NO3-N、NO2-N、NH4-N、DIN、PO4-P、SiO3-Si数据统计
Table 3. Statistics of NO3-N, NO2-N, NH4-N, DIN, PO4-P, SiO3-Si in the study area
μmol/L 调查区 站位数 数据项 NO3-N NO2-N NH4-N DIN PO4-P SiO3-Si 调查区 20 变化范围 0.50~44.82 44.47~45.36 28.55~41.92 7.45~17.92 0.57~2.62 7.62~64.59 平均值±标准差 10.87±12.03 49.27±4.24 35.66±3.04 15.08±2.92 1.66±0.59 41.85±16.01 杭州湾内 8 变化范围 4.84~44.82 0.44~0.51 0.32~0.39 0.16~0.18 1.77~2.62 44.65~64.59 平均值±标准差 21.73±12.71 0.47±0.02 0.36±0.02 0.17±0.01 2.14±0.22 54.53±4.97 杭州湾外 12 变化范围 0.50~9.38 0.45~0.61 0.29~0.42 0.07~0.17 0.57~1.84 7.62~49.31 平均值±标准差 3.63±2.45 0.51±0.05 0.36±0.04 0.14±0.03 1.30±0.43 32.56±13.60
下载: 导出CSV
表 4 调查区表层海水营养盐限制状况站位统计
Table 4. Station statistics of nutrient limitation of surface seawater in the study area
营养盐 限制状况 站位数量 百分比/% DIN 绝对限制 0 0 潜在限制 0 0 P 绝对限制 0 0 潜在限制 4 20 Si 绝对限制 0 0 潜在限制 1 5
下载: 导出CSV
表 5 调查区表层海水COD单因子污染指数评价结果
Table 5. Assessment results of COD single factor pollution index of surface seawater in the study area
海水水质标准 Ⅰ类 Ⅱ类 Ⅲ类 Ⅳ类超Ⅳ类 站位占比/% 65 25 5 5 指数范围 0.31~0.81 0.69~0.80 0.80~1.07 - 均值±标准差 0.56±0.19 0.74±0.04 0.80±0.0 -
下载: 导出CSV
表 6 调查区表层海水水质标准评估结果
Table 6. Assessment results of surface seawater quality standards in the study area
海 域 海水水质标准 DIN/% DIP/% COD/% 调查区
表层海水Ⅲ类 45 20 95 Ⅳ类 20 10 0 超Ⅳ类 35 70 5
下载: 导出CSV
表 7 调查区表层海水COD、DIN和DIP对E值的贡献率
Table 7. Contribution rate of COD, DIN and DIP of surface seawater in the study area to E value
调查区 站位数 数据项 E值 ECOD/% EDIN/% EDIP/% 调查区 20 变化范围 0.50~44.82 44.47~45.36 28.55~41.92 7.45~17.92 平均值±标准差 10.87±12.03 49.27±4.24 35.66±3.04 15.08±2.92 杭州湾内 8 变化范围 4.84~44.82 44.47~51.46 32.06~38.53 16.16~17.92 平均值±标准差 21.73±12.71 47.29±2.15 35.81±2.04 16.89±0.69 杭州湾外 12 变化范围 0.50~9.38 0.45~0.61 0.29~0.42 0.07~0.17 平均值±标准差 3.63±2.45 50.58±4.84 35.55±3.64 13.86±3.23
下载: 导出CSV
表 8 调查区营养盐、COD和E值历史调查数据汇总及对比
Table 8. Summary and comparison of historical data on nutrients, COD, and E values in the study area
汇总项 是否与调查区位置相同 调查时间 平均值 变化范围 数据来源 DIN/(μmol/L) 是 2001年夏季 68.77 10.71~501.14 文献[20] 是 2006年夏季 54.42 0.30~145.41 文献[17] 是 2015年夏季 97.14 34.29~155.7 文献[44] 是 2015年夏季 101.67 ﹣ 文献[22] 2022年夏季 29.72 8.07~52.06 本研究 PO4P/(μmol/L) 同上 2001年夏季 5.06 0.32~5.55 文献[20] 2006年夏季 1.01 0.03~1.94 文献[17] 2015年夏季 5.16 1.19~33.23 文献[44] 2015年夏季 1.6 ﹣ 文献[22] 2022年夏季 1.66 0.57~2.62 本研究 SiO3Si/(μmol/L) 同上 2001年夏季 ﹣ ﹣ 文献[20] 2006年夏季 41.89 1.11~96.27 文献[17] 2015年夏季 ﹣ ﹣ 文献[44] 2015年夏季 ﹣ ﹣ 文献[22] 2022年夏季 41.85 7.62~64.59 本研究 COD/(mg/L) 同上 2001年夏季 2.45 0.39~6.68 文献[20] 2006年夏季 ﹣ ﹣ 文献[17] 2015年夏季 1.87 0.56~3.18 文献[44] 2015年夏季 ﹣ ﹣ 文献[22] 2022年夏季 1.71 0.62~5.36 本研究 E值 同上 2001年夏季 21.7 5.90~90.00 文献[20] 2006年夏季 - - 文献[17] 2015年夏季 58.3 8.00~445.00 文献[44] 2015年夏季 - - 文献[22] 2022年夏季 10.87 0.50~44.82 本研究 注:“﹣”表示文献中未列出相关数据;历史调查区范围: 30°00′—31°00′N、121°00′—123°00′E[19],29°30′—31°00′N、120°30′—122°30′ E[20],30°12′—30°48′N、120°54′—122°00′ E[22],29°54′—30°00′ N、121°00′—122°30′ E[44]。
下载: 导出CSV
表 9 调查区西部叶绿素与环境参数、COD和营养盐的Pearson相关性分析结果
Table 9. Pearson correlation analysis of chlorophyll with environmental parameters, COD, and nutrients in the western study area
Chl a S T pH SPM ZSD COD PO4−P SiO3−Si DIN DIN/P Si/DIN Si/P Chl a 1 −0.643 −0.773* 0.056 0.675 0.222 0.888** 0.806* 0.732* 0.221 −0.588 0.413 −0.565 S 1 0.513 −0.111 −0.131 −0.740* −0.335 −0.898** −0.966** −0.401 0.484 −0.432 0.383 T 1 −0.106 −0.293 −0.005 −0.586 −0.535 −0.499 0.010 0.538 −0.452 0.368 pH 1 −0.017 −0.370 0.199 −0.175 0.150 −0.353 −0.062 0.462 0.639 SPM 1 −0.135 0.842** 0.362 0.337 −0.012 −0.371 0.271 −0.265 ZSD 1 −0.099 0.739* 0.680 0.512 −0.262 0.078 −0.507 COD 1 0.545 0.474 −0.100 −0.620 0.506 −0.424 PO4−P 1 0.901** 0.438 −0.582 0.349 −0.710* SiO3−Si 1 0.412 −0.473 0.435 −0.339 DIN 1 0.471 −0.638 −0.223 DIN/P 1 −0.886** 0.554 Si/DIN 1 −0.113 Si/P 1 注:**表示相关置信水平<0.01;*表示相关置信水平<0.05;其他为不相关。
下载: 导出CSV
表 10 调查区东部叶绿素与环境参数、COD和营养盐的Pearson相关性分析结果
Table 10. Pearson correlation analysis results of chlorophyll, environmental parameters, COD, and nutrients in the eastern study area
Chl a S T pH SPM ZSD COD PO4−P SiO3−Si DIN DIN/P Si/DIN Si/P Chl a 1 0.438 −0.470 0.724** −0.455 0.620* 0.401 −0.431 −0.766** −0.653* −0.351 −0.440 −0.583* S 1 −0.904** 0.465 −0.206 0.545 −0.116 0.023 −0.611* −0.597* −0.618* −0.230 −0.817** T 1 −0.501 0.181 −0.612* −0.001 0.151 0.717** 0.785** 0.667* 0.188 0.826** pH 1 −0.479 0.700* −0.028 −0.719** −0.901** −0.744** −0.138 −0.421 −0.418 SPM 1 −0.723** 0.291 0.702* 0.587* 0.069 −0.404 0.801** 0.018 ZSD 1 −0.189 −0.656* −0.767** −0.578* −0.091 −0.431 −0.337 COD 1 0.281 −0.020 −0.222 −0.483 0.058 −0.399 PO4−P 1 0.693* 0.391 −0.399 0.498 −0.125 SiO3−Si 1 0.779** 0.248 0.584* 0.613* DIN 1 0.660* −0.017 0.678* DIN/P 1 −0.349 0.826** Si/DIN 1 0.224 Si/P 1 注:**表示相关置信水平<0.01;*表示相关置信水平<0.05;其他为不相关。
下载: 导出CSV
表 11 调查区表层海水E值与环境因子、叶绿素、COD和营养盐的 Pearson相关性分析结果
Table 11. Pearson correlation analysis results between surface seawater E value and environmental factors, chlorophyll, COD, and nutrients in the study area
E S T pH SPM Chl a Chl b Chl c COD DIN PO4−P SiO3−Si DIN/P Si/DIN Si/P E 1 −0.194 −0.244 −0.407 0.487* −0.273 0.094 −0.023 0.326 0.686** 0.588** 0.639** 0.122 −0.081 0.102 S 1 0.259 −0.077 −0.194 −0.204 −0.140 −0.308 −0.238 −0.119 −0.078 −0.158 0.010 −0.208 −0.149 T 1 0.153 −0.505* −0.216 −0.276 −0.487* −0.624** −0.281 −0.533* −0.310 0.336 0.041 0.376 pH 1 −0.482* 0.637** −0.379 −0.114 −0.267 −0.788** −0.758** −0.845** −0.137 −0.176 −0.280 SPM 1 −0.120 0.193 0.022 0.831** 0.527* 0.696** 0.638** −0.142 0.189 −0.022 Chl a 1 −0.299 0.236 0.222 −0.480* −0.311 −0.571** −0.374 −0.314 −0.561* Chl b 1 0.761** 0.170 0.404 0.360 0.445* 0.209 0.172 0.318 Chl c 1 0.211 0.265 0.209 0.178 0.127 −0.169 0.048 COD 1 0.357 0.604** 0.468* −0.269 0.079 −0.193 DIN 1 0.765** 0.874** 0.423 −0.169 0.352 PO4−P 1 0.873** −0.220 0.198 −0.102 SiO3−Si 1 0.165 0.295 0.382 DIN/P 1 −0.400 0.807** Si/DIN 1 0.201 Si/P 1 注:**表示相关置信水平<0.01;*表示相关置信水平<0.05;其他为不相关。
下载: 导出CSV
-
[1] RABALAIS N N. Nitrogen in aquatic ecosystems[J]. AMBIO:A Journal of the Human Environment,2002,31(2):102-112. doi: 10.1579/0044-7447-31.2.102
[2] GRUBER N,GALLOWAY J N. An Earth-system perspective of the global nitrogen cycle[J]. Nature,2008,451(7176):293-296. doi: 10.1038/nature06592
[3] RABALAIS N N. Eutrophication of estuarine and coastal ecosystems[M]. New York: John Wiley & Sons,Inc. ,2010:115-135.
[4] CLOERN J E. Our evolving conceptual model of the coastal eutrophication problem[J]. Marine Ecology Progress Series,2001,210:223-253. doi: 10.3354/meps210223
[5] 中华人民共和国自然资源部. 2021年中国海洋灾害公报[EB/OL]. [2022-07-09]. http://www.mnr.gov.cn/sj/sjfw/hy/gbgg/zghyzhgb/.
[6] QUN D,ZHANG Z Y. Analysis on environmental pollution in China’s coastal ecosystem[J]. Journal of Resources and Ecology,2019,10(4):424-431. doi: 10.5814/j.issn.1674-764x.2019.04.009
[7] BEARDSLEY R,LIMEBURNER R,YU H. Discharging of the Changjiang (Yangtze River) into the East China Sea[J]. Continental Shelf Research,1985,4:57-76. doi: 10.1016/0278-4343(85)90022-6
[8] 苏纪兰. 中国近海的环流动力机制研究[J]. 海洋学报(中文版),2001,23(4):1-16.
[9] 上海市海洋局. 2016年上海市海洋质量环境公报[EB/OL]. [2023-02-22]. http://swj.sh.gov.cn/gsgg/20200814/df4f5de2c9974b3cb049b420913de932.html.
[10] 中华人民共和国水利部. 2021年中国水文年报[EB/OL]. [2023-02-24]. http://www.mwr.gov.cn/sj/tjgb/zgswnb/202210/t20221031_1602523.html.
[11] 宁波市水利局. 2021年宁波市水资源公报[EB/OL]. [2023-02-24]. http://slj.ningbo.gov.cn/col/col1229051287/index.html.
[12] GAO S Q,YU G H,WANG Y H. Distributional features and fluxes of dissolved nitrogen,phosphorus and silicon in the Hangzhou Bay[J]. Marine Chemistry,1993,43(1):65-81.
[13] 王彪,卢士强,矫吉珍. 长江口杭州湾氮磷污染负荷分析[J]. 上海环境科学,2022(1):2-6.
[14] 曹飞凤,代可,陶琦茹,等. 杭州湾区近岸海域污染状况分析及治理对策研究[J]. 环境科学与技术,2020,43(10):60-69.
[15] 化天然,姚炎明,韩宇,等. 基于临界点的杭州湾水体富营养化多年变化研究[J]. 海洋通报,2022,41(4):473-480.
[16] WU B,JIN H Y,GAO S Q,et al. Nutrient budgets and recent decadal variations in a highly eutrophic estuary:Hangzhou Bay,China[J]. Journal of Coastal Research,2020,36(1):63-71.
[17] 章守宇,邵君波,戴小杰. 杭州湾富营养化及浮游植物多样性问题的探讨[J]. 水产学报,2001,25(6):512-517.
[18] 秦铭俐,蔡燕红,王晓波,等. 杭州湾水体富营养化评价及分析[J]. 海洋环境科学,2009,28(S1):53-56.
[19] 高生泉,陈建芳,金海燕,等. 杭州湾及邻近水域营养盐的时空分布与富营养化特征[J]. 海洋学研究,2011,29(3):36-47.
[20] 张健,施青松,邬翱宇,等. 杭州湾丰水期主要污染因子的分布变化及成因[J]. 东海海洋,2002,20(4):35-41.
[21] 卓明. 杭州湾水体富营养化状况变化趋势及成因探究 [C]//2013年中国环境科学学会学术年会论文集(第五卷). 昆明:中国环境科学学会,2013:445-447.
[22] 陈思杨,宋琍琍,余骏,等. 杭州湾营养盐时空分布特征及其影响研究[J]. 海洋开发与管理,2018,35(11):61-66.
[23] 钱塘江志编纂委员会. 钱塘江志[M]. 北京:方志出版社,1998.
[24] 浙江省文水利厅化和旅游厅. 浙江省河流简明手册[M]. 西安:西安地图出版社,1999.
[25] 陈凤激,陈来华,章进,等. 钱塘江河口河海界线划分方案探讨[J]. 浙江水利科技,2022,50(5):36-39.
[26] 中国国家标准化管理委员会. GB 17378—2007海洋监测规范 第3部分:样品采集、贮存与运输[S]. 北京:中国标准出版社,2007.
[27] PEI S F,SHEN Z L,LAWS E A. Nutrient dynamics in the upwelling area of Changjiang (Yangtze River) Estuary[J]. Journal of Coastal Research,2009(253):569-580.
[28] 裴绍峰,沈志良. 长江口上升流区营养盐的分布及其通量的初步估算[J]. 海洋科学,2008,32(9):64-70,75.
[29] 廖名稳,裴绍峰,段云莹,等. 江苏盐城近海富营养化评价与径流输入的影响[J]. 海洋地质前沿,2022,38(9):26-36.
[30] 祝陈坚. 海水分析化学[M]. 青岛:中国海洋大学出版社,2006.
[31] 中国国家标准化管理委员会. GB/T 12763—2007海洋调查规范 第6部分:海洋生物调查[S]. 北京:中国标准出版社,2008.
[32] 周爱国,蔡鹤生. 地质环境质量评级理论与应用[M]. 武汉:中国地质大学出版社,1998.
[33] 中华人民共和国生态环境部. GB 3097—1997 海水水质标准[S]. 北京:中国标准出版社,1998.
[34] REDFIELD A C,KETCHUM B H,RICHARDS F A. The influence of organisms on the composition of sea-water[M]. New York:Interscience,1963:26-87.
[35] HARRISON P J,CONWAY H L,HOLMES R W,et al. Marine diatoms grown in chemostats under silicate or ammonium limitation. III. Cellular chemical composition and morphology of Chaetoceros debilis,Skeletonema costatum,and Thalassiosira gravida[J]. Marine Biology,1977,43(1):19-31. doi: 10.1007/BF00392568
[36] 孙军,刘东艳,杨世民,等. 渤海中部和渤海海峡及邻近海域浮游植物群落结构的初步研究[J]. 海洋与湖沼,2002,33(5):461-471.
[37] 王保栋. 黄海和东海营养盐分布及其对浮游植物的限制[J]. 应用生态学报,2003,14(7):1122-1126.
[38] JUSTIĆ D,RABALAIS N N. ,Turner R. E,et al. Changes in nutrient structure of river-dominated coastal waters:stoichiometric nutrient balance and its consequences[J]. Estuarine,Coastal and Shelf Science,1995,40(3):339-356. doi: 10.1016/S0272-7714(05)80014-9
[39] DORTCH Q,WHITLEDGE T E. Does nitrogen or silicon limit phytoplankton production in the Mississippi River plume and nearby regions?[J]. Continental Shelf Research,1992,12(11):1293-1309. doi: 10.1016/0278-4343(92)90065-R
[40] 邹景忠,董丽萍,秦保平. 渤海湾富营养化和赤潮问题的初步探讨[J]. 海洋环境科学,1983,2(2):41-54.
[41] 中华人民共和国生态环境部. HJ 442.10-2020近岸海域环境监测技术规范 第10部分:评价及报告[S]. 北京:中国环境出版社,2020.
[42] 杨斌,钟秋平,鲁栋梁,等. 钦州湾海域COD时空分布及对富营养化贡献分析[J]. 海洋科学,2014,38(3):20-25.
[43] 尹艳娥,沈盎绿,周进,等. 春夏季长江口及其邻近海域表层和底层环境因素、氮分布分析[J]. 生态环境学报,2016,25(2):272-278.
[44] 李潇,刘书明,付瑞全,等. 杭州湾表层海水营养盐分布特征及富营养化状况研究[J]. 环境科学与管理,2017,42(9):66-71. doi: 10.3969/j.issn.1673-1212.2017.09.015
[45] 张丹,孙振中,张玉平. 春、夏季杭州湾北部近岸水域水化学及营养状况评价[J]. 大连海洋大学学报,2017,32(6):724-731.
[46] 顾骅珊. 杭州湾海域水污染演变及污染源分析[J]. 嘉兴学院学报,2015,27(1):68-75.
[47] 蒋玫,沈新强. 杭州湾及邻近水域叶绿素a与氮磷盐的关系[J]. 海洋渔业,2004,26((1):):35-39.
[48] 王保栋. 长江冲淡水的扩展及其营养盐的输运[J]. 黄渤海海洋学报,1998,16(2):42-48.
[49] 吴洁,虞左明,钱天鸣. 钱塘江干流杭州段水体氮污染特征分析[J]. 长江流域资源与环境,2003,12(6):552-556.
[50] 潘玉球,黄树生. 长江冲淡水输运和扩散途径的分析[J]. 东海海洋,1997,15(2):26-30,32-35.
[51] CONWAY H L. Interactions of inorganic nitrogen in the uptake and assimilation by marine phytoplankton[J]. Marine Biology,1977,39(3):221. doi: 10.1007/BF00390996
[52] SUZUKI I,DULAR U,KWOK S C. Ammonia or ammonium ion as substrate for oxidation by Nitrosomonas europaea cells and extracts[J]. Journal of bacteriology,1974,120(1):556-558. doi: 10.1128/jb.120.1.556-558.1974
[53] MIKE S M,JETTEN. The microbial nitrogen cycle[J]. Environmental Microbiology,2008,10(11):2903-2909. doi: 10.1111/j.1462-2920.2008.01786.x
[54] LI Y,CAO W Z,SU C X,et al. Nutrient sources and composition of recent algal blooms and eutrophication in the northern Jiulong River,Southeast China[J]. Marine Pollution Bulletin,2011,63(5):249-254.
[55] 刘子琳,宁修仁,蔡昱明. 杭州湾:舟山渔场秋季浮游植物现存量和初级生产力[J]. 海洋学报(中文版),2001,12(4):93-99.
[56] WANG Y H,CHEN J F,ZHOU F,et al. Spatial and temporal variations of chlorophyll a and primary productivity in the Hangzhou Bay[J]. Journal of Marine Science and Engineering,2022,10(3):356.
[57] GOLDMAN J C. Temperature effects on steady-state growth,phosphorus uptake,and the chemical composition of a marine phytoplankter[J]. Microbial ecology,1979,5(3):153-166. doi: 10.1007/BF02013523
[58] GAYOSO A M. Long-term phytoplankton studies in the Baha Blanca estuary,Argentina[J]. ICES Journal of Marine Science,1998,55(4):655-660. doi: 10.1006/jmsc.1998.0375
[59] 王颢,石晓勇,张传松,等. 2004年春季东海赤潮高发区COD分布及其与赤潮关系的初步研究[J]. 海洋科学,2008,32(12):82-86.
[60] 张运林,杨龙元,秦伯强,等. 太湖北部湖区COD浓度空间分布及与其它要素的相关性研究[J]. 环境科学,2008,29(6):1457-1462.
[61] 秦铭俐,魏永杰,王晓波,等. 杭州湾枯水期浮游植物群落结构的研究[J]. 海洋环境科学,2008,108(S1):57-60.
[62] 贾海波,唐静亮,胡颢琰. 1992—2012杭州湾海域生物多样性的变化趋势及原因分析[J]. 海洋学报,2014,36(12):111-118.
[63] ZHANG Y X,YU J,JIANG Z B,et al. Variations of summer phytoplankton community related to environmental factors in a macro-tidal estuarine embayment,Hangzhou Bay,China[J]. Journal of Ocean University of China,2015,14(6):1025-1033. doi: 10.1007/s11802-015-2483-6
[64] 孙志林,杜利华,龚玉萌,等. 长江口和杭州湾污染物稀释扩散及交汇数值模拟研究[J]. 海洋工程,2019,37(2):68-75.
[65] 刘希真,李宏亮,陈建芳,等. 长江口跨越锋面颗粒磷季节分布变化特征及影响因素[J]. 海洋学研究,2011,29(3):88-98.
-
图(6)
表(11)
计量
- 文章访问数: 872
- PDF下载数: 141
- 施引文献: 0