

Chemical Characteristics and Eutrophication of Surface Seawater in the South China Sea Coastal Area
-
摘要:
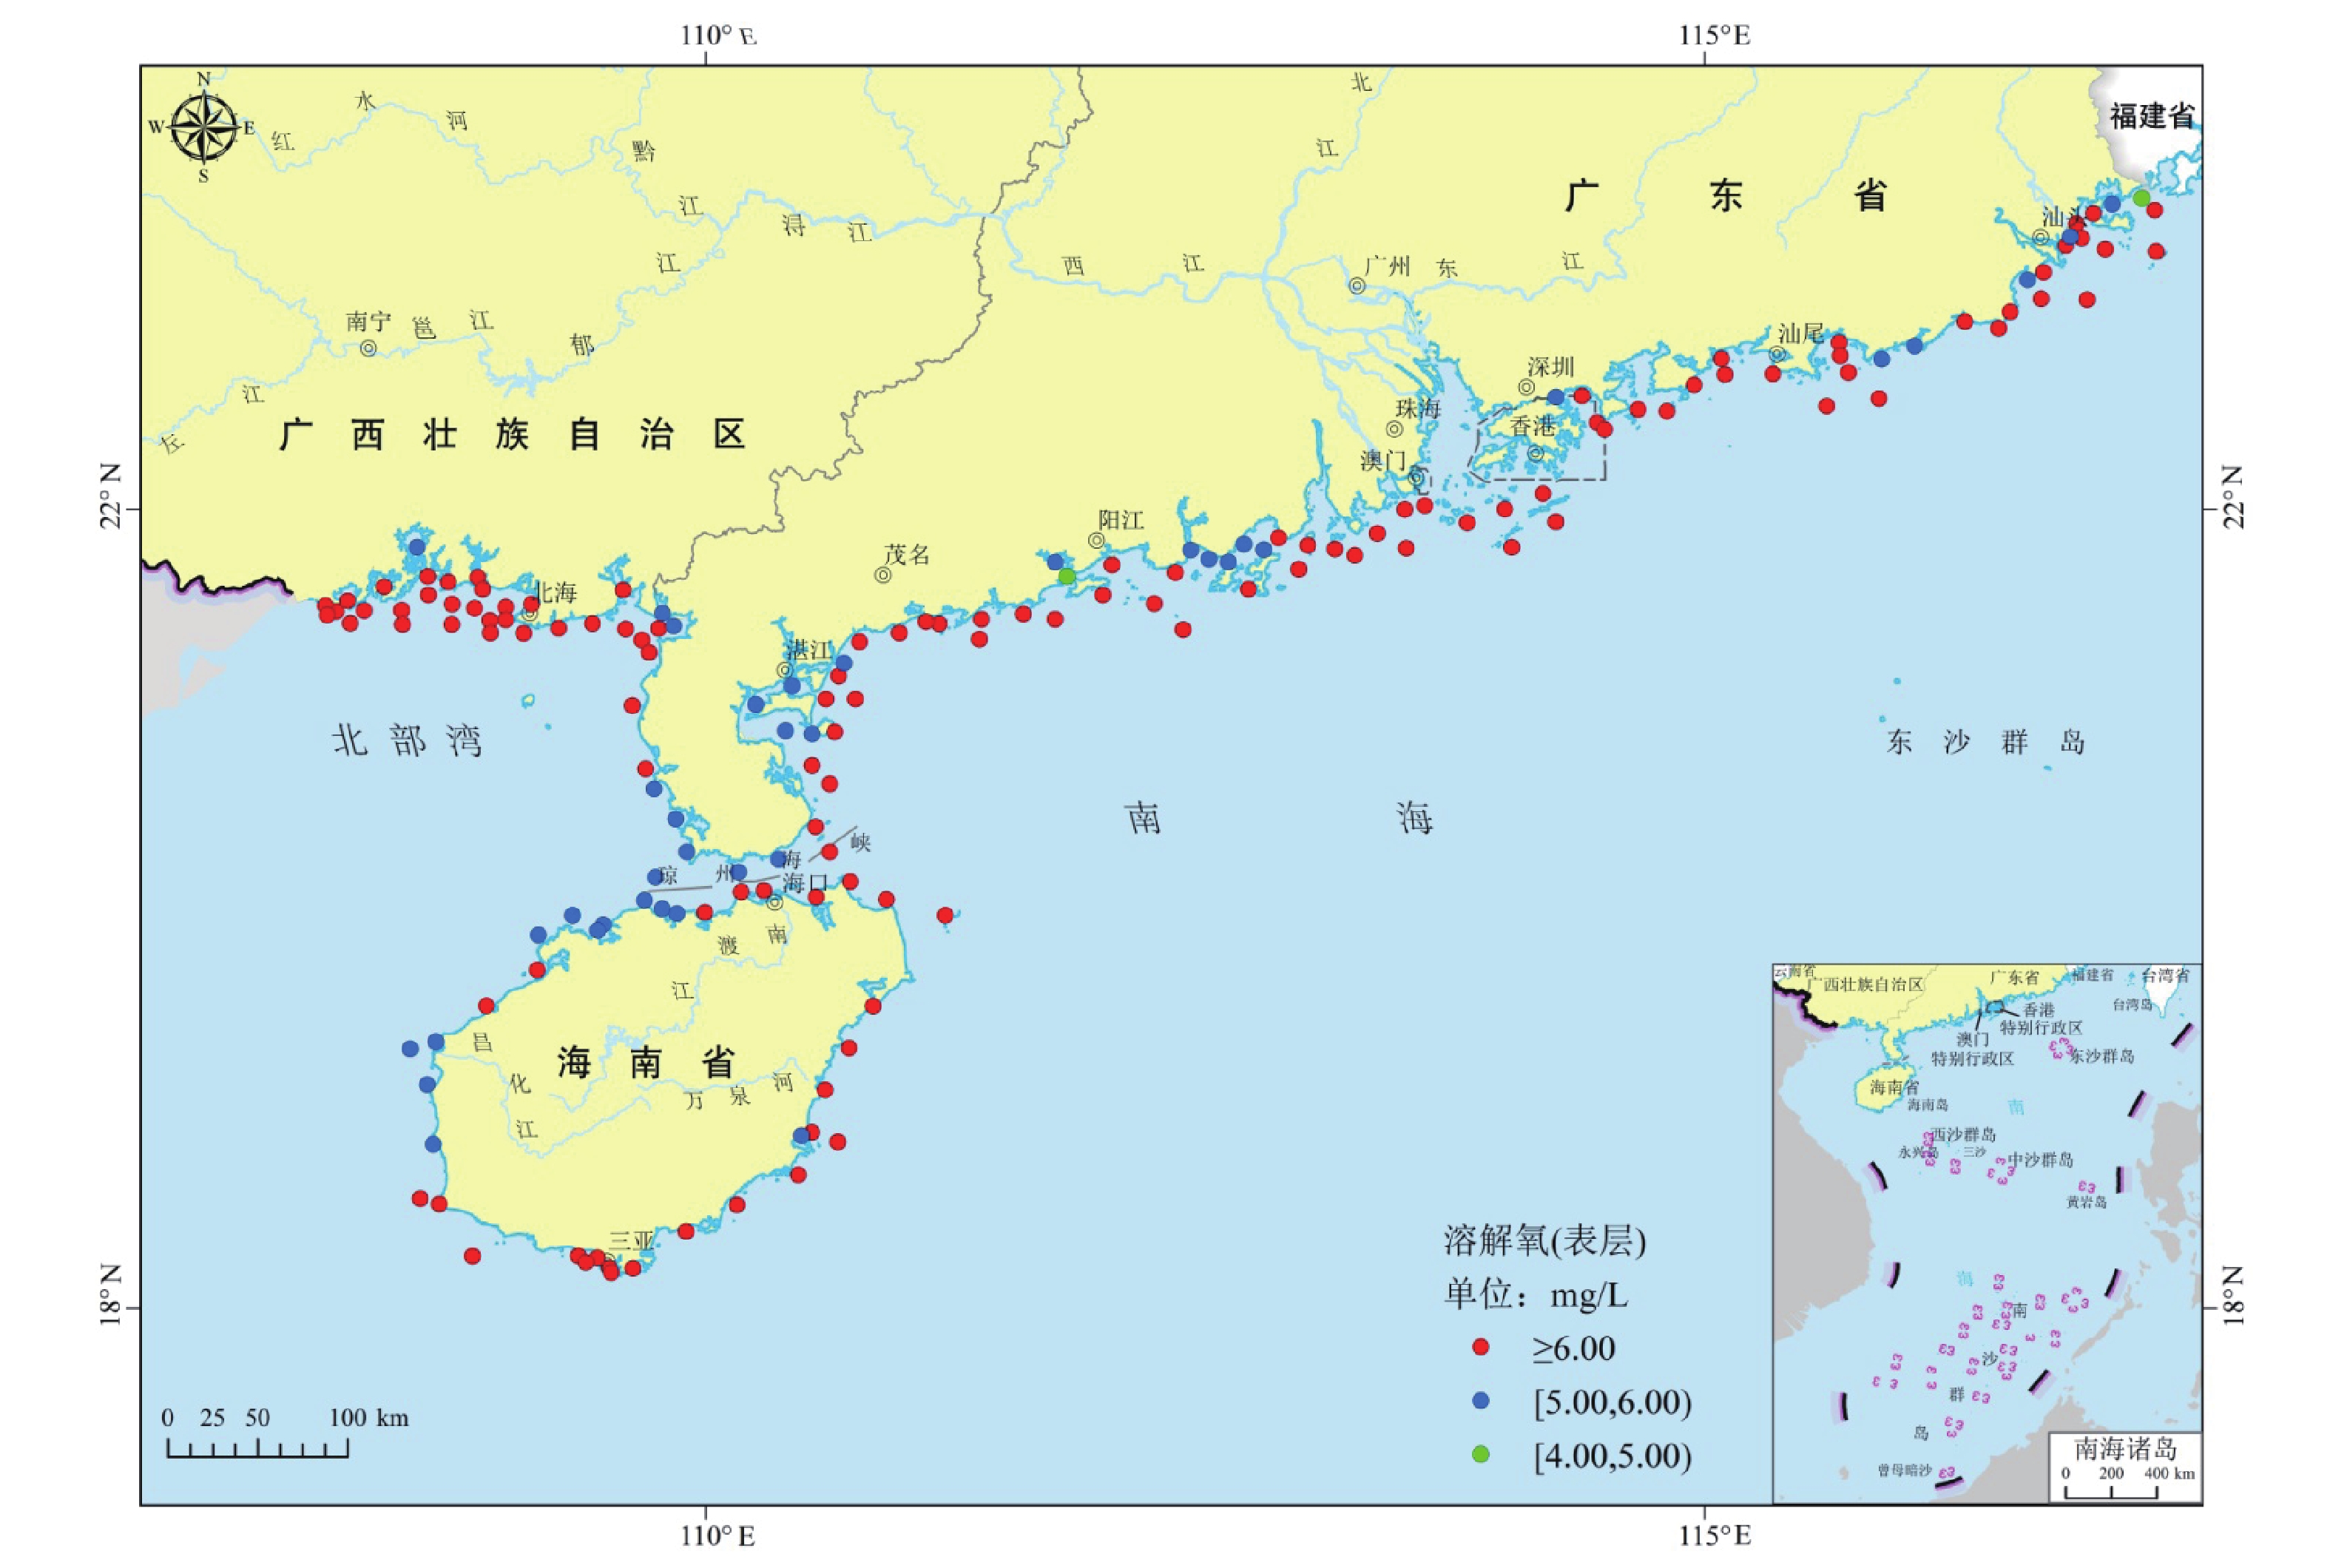
南海近岸海域面临严重的富营养化的威胁,而有关南海近岸海域的富营养化状态仍缺乏系统的研究。本文采集了中国南海近岸海域161个站点的水质样品并获得了其pH、溶解氧(DO)、化学需氧量(COD)、活性磷酸盐、无机氮(亚硝酸盐氮、硝酸盐氮和氨氮)等数据并估算了各站点的富营养化指数(E)。研究结果表明,北部湾和珠江口海域的水体pH值总体偏高,而粤西、粤东和海南海域的水体pH值相对较低;北部湾和珠江口的水体DO水平较高,而粤西、粤东和海南的DO浓度较低;北部湾水体的COD浓度最高,而珠江口、粤西和粤东海域略低,海南海域的COD浓度最低;无机氮浓度在北部湾海域最高,粤东和珠江口次之,粤西和海南海域相对较低;活性磷酸盐浓度最高的海域为粤东,其次为珠江口和北部湾,而粤西和海南海域最低。基于上述数据,估算结果显示北部湾海域E值最高(最大63.34,均值6.30),粤东次之(最大17.84,均值3.74),粤西(最大17.33,均值0.44)和珠江口(最大2.93,均值0.39)相对较低,而海南海域E值最低(最大0.49,均值0.02),指示重度富营养化海域主要位于北部湾、粤东和粤西海域,轻度富营养化海域主要为珠江口海域,其他海域富营养化程度较轻。引起北部湾海域重度富营养化的关键因素是工农业生产活动以及水产养殖过程中无机氮的过度排放,而粤东海域富营养化加剧可能主要与富含活性磷酸盐工农业废水和生活污水的过度排放有关。北部湾和粤东海域严重的富营养化导致水体的pH和DO明显降低,进而可能加剧水体的富营养化程度。
Abstract:Offshore waters of the South China Sea are facing serious threats of eutrophication, which is short of systematic research. In this study, total of 161 water samples were collected from sites in the offshore areas of the South China Sea, and data on pH, dissolved oxygen (DO), chemical oxygen demand (COD), reactive phosphorus, and inorganic nitrogen (nitrite nitrogen, nitrate nitrogen, and ammonia nitrogen) were obtained, along with the estimation of eutrophication index (E) for each site. The results indicate that the water in the Beibu Gulf and Pearl River Estuary generally have higher pH values, while those in Western Guangdong, Eastern Guangdong, and Hainan have relatively lower pH values. The DO levels in the Beibu Gulf and Pearl River Estuary are comparatively high, while those in Western Guangdong, Eastern Guangdong, and Hainan are lower. The COD concentration is highest in the Beibu Gulf, slightly lower in the Pearl River Estuary, Western Guangdong, and Eastern Guangdong, and the lowest in Hainan. The concentration of inorganic nitrogen is highest in the Beibu Gulf, followed by Eastern Guangdong and the Pearl River Estuary, and relatively lower in Western Guangdong and Hainan. The highest concentration of labile phosphorus is found in Eastern Guangdong, followed by the Pearl River Estuary and Beibu Gulf, with the lowest levels in Western Guangdong and Hainan. Based on the aforementioned data, the estimated results show that the Beibu Gulf has the highest E values (maximum of 63.34, average of 6.30), followed by Eastern Guangdong (maximum of 17.84, average of 3.74), Western Guangdong (maximum of 17.33, average of 0.44), and the Pearl River Estuary (maximum of 2.93, average of 0.39), while Hainan has the lowest E values (maximum of 0.49, average of 0.02), indicating that severe eutrophication mainly happened in the Beibu Gulf, Eastern Guangdong, and Western Guangdong areas, with mild eutrophication primarily in the Pearl River Estuary area, and other areas showing light eutrophication. The key factor causing severe eutrophication in the Beibu Gulf is the excessive discharge of inorganic nitrogen from industrial and agricultural production activities and aquaculture processes, while the exacerbation of eutrophication in Eastern Guangdong may be mainly related to the excessive discharge of labile phosphorus-rich industrial and agricultural wastewater and domestic sewage. Severe eutrophication in the Beibu Gulf and Eastern Guangdong has led to a significant decrease in water pH and DO, which may further intensify the threat of eutrophication.
-
Key words:
- nutrients /
- eutrophication /
- ecological risk /
- offshore waters /
- South China Sea
-

-
表 1 南海近岸海域水体要素统计表
Table 1. Statistics of water essential factors in the South China Sea coastal area
海域 描述 pH 溶解氧
(mg/L)化学需氧量
(mg/L)硝酸盐-氮
(μg /L)亚硝酸盐-氮
(μg /L)氨-氮
(μg /L)无机氮-氮
(μg /L)活性磷酸盐
(μg /L)富营养化
指数珠江口 最小值 8.08 5.98 0.42 0.30 0.64 0.54 1.74 1.21 0.00 最大值 8.48 8.72 1.60 820 45.60 28.10 861 14.20 2.93 平均值 8.27 7.43 0.92 155 18.95 9.35 183 6.21 0.39 粤西 最小值 7.52 4.76 0.29 0.80 0.18 0.54 11.00 0.36 0.00 最大值 8.66 8.18 2.52 444 118 112 650 47.60 17.33 平均值 8.13 6.30 1.25 56.26 13.81 30.37 100.43 3.02 0.44 粤东 最小值 7.68 4.67 0.64 20.20 1.20 17.70 48.00 1.00 0.01 最大值 8.44 9.22 2.84 1204 67.40 261 1370 66.30 17.84 平均值 8.06 6.66 1.27 294 22.81 69.94 387 15.78 3.74 海南 最小值 8.02 5.36 0.12 0.76 0.69 2.26 7.24 0.64 0.00 最大值 8.22 8.04 2.51 44.30 15.60 23.40 54.00 32.90 0.49 平均值 8.12 6.19 0.46 8.13 3.61 8.42 20.16 4.31 0.02 北部湾 最小值 7.29 5.22 0.56 0.30 0.18 4.80 5.48 0.36 0.00 最大值 8.74 12.63 3.88 1390 244 523 1990 46.20 63.34 平均值 8.25 8.03 1.72 320 58.56 168 546 7.74 6.30  下载: 导出CSV
-
[1] 陈一波,宋国宝,赵文星,陈景文.2016.中国海水养殖污染负荷估[J]. 海洋环境科学,35(1):1-6.
[2] 党二莎,唐俊逸,周连宁,叶 超,鲍晨光.2019.珠江口近岸海域水质状况评价及富营养化分析[J]. 大连海洋大学学报,34(4):580-587.
[3] 樊艳翔,雷社平,解建仓.2023.广东省河流水体富营养化综合评价及分异特征——基于博弈论组合赋权法与VIKOR模型[J]. 生态环境学报,32(10):1811-1821.
[4] 冈市友利. 1972. 浅海的污染与赤潮的发生——内湾赤潮的发生机制[R]. 东京:日本水产资源保护协会,58-76.
[5] 国家质量监督检验检疫总局,中国国家标准化管理委员会. 2007a. 海洋监测规范 第4部分:海水分析[S].
[6] 国家质量监督检验检疫总局,中国国家标准化管理委员会. 2007b. 海洋调查规范 第4部分:海水化学要素调查[S].
[7] 黄沛桓,王 刚,黄子茵,管东生.2021.华南近岸海域水质评价及其影响因素[J]. 热带地理,41(1):124-135.
[8] 林晓娟,高 姗,仉天宇,刘桂梅.2018.海水富营养化评价方法的研究进展与应用现状[J]. 地球科学进展,33(4):373-384. doi: 10.11867/j.issn.1001-8166.2018.04.0373
[9] 王 申,高珊珊,蒋 力,黎祖福,申倩倩,冯建祥.2018.水产养殖系统氮磷营养盐收支及其生态影响研究[J]. 水产学杂志,31(5):50-57. doi: 10.3969/j.issn.1005-3832.2018.05.011
[10] 徐俊杰,徐宏根,刘道涵,陈 松,刘 磊,刘 慧,柳 潇,刘 盼.2020.南海南部曾母盆地的原型盆地划分及其形成演化过程[J]. 华南地质,36(3):221-231. doi: 10.3969/j.issn.1007-3701.2020.03.002
[11] 杨 静,张仁铎,赵庄明,翁士创,李凤华.2015.近25年广西北部湾海域营养盐时空分布特征[J]. 生态环境学报,24(9):1493-1498.
[12] 姚 云,沈志良.2005.水域富营养化研究进展[J]. 海洋科学,29:53-57. doi: 10.3969/j.issn.1000-3096.2005.02.011
[13] Cai W J, Hu X, Huang W J, Murrell M C, Lehrter J C, Lohrenz S E, Chou W C, Zhai W D, Hollibaugh J T, Wang Y C, Zhao P S, Guo X H, Gundersen K, Dai M H, Gong G C. 2011. Acidification of subsurface coastal waters enhanced by eutrophication[J]. Nature Geoscience, 4(11): 766-770. doi: 10.1038/ngeo1297
[14] Camargo J A, Alonso Á, 2006. Ecological and toxicological effects of inorganic nitrogen pollution in aquatic ecosystems: A global assessment[J]. Environment International, 32(6): 831-849.
[15] Conley D J, Paerl H W, Howarth R W, Boesch D F, Seitzinger S P, Havens K E, Lancelot C, Likens G E. 2009. Controlling eutrophication: nitrogen and phosphorus[J]. Science, 323(5917): 1014-1015. doi: 10.1126/science.1167755
[16] Díaz R J, Rosenberg R. 2008. Spreading dead zones and consequences for marine ecosystems[J]. Science, 321(5891): 926-929. doi: 10.1126/science.1156401
[17] Havens K E. 2008. Cyanobacteria blooms: effects on aquatic ecosystems[M]. // Cyanobacterial harmful algal blooms, Springer, 733-747.
[18] He Y X, Zhang P, Xu F, Zhao L R, Zhang J B. 2023. Seasonal nutrients variation, eutrophication pattern, and chlorophyll a response adjacent to Guangdong coastal water, China[J]. Frontiers in Marine Science, 10: 1236609. doi: 10.3389/fmars.2023.1236609
[19] House W A. 1990. The prediction of phosphate coprecipitation with calcite in freshwaters[J]. Water Research, 24(8): 1017-1023. doi: 10.1016/0043-1354(90)90124-O
[20] Howarth R, Chan F, Conley D J, Garnier J, Doney D C, Marion R, Billen G. 2011. Coupled biogeochemical cycles: eutrophication and hypoxia in temperate estuaries and coastal marine ecosystems[J]. Frontiers in Ecology and the Environment, 9(1): 18-26. doi: 10.1890/100008
[21] Huang X P, Huang L M, Yue W Z. 2003. The characteristics of nutrients and eutrophication in the Pearl River estuary, South China[J]. Marine Pollution Bulletin, 47: 30-36. doi: 10.1016/S0025-326X(02)00474-5
[22] Ke S, Zhang P, Ou S J, Zhang J X, Chen J Y, Zhang J B. 2022. Spatiotemporal nutrient patterns, composition, and implications for eutrophication mitigation in the Pearl River Estuary, China[J]. Estuarine, Coastal and Shelf Science, 266: 107749.
[23] Kosten S, Huszar V L M, Bécares E, Costa L S, Van Donk E, Hansson L A, Jeppesen E, Kruk C, Lacerot G, Mazzeo N, Meester L D, Moss B, Lürling M, Nõges T, Romo S, Scheffer, M. 2012. Warmer climates boost cyanobacterial dominance in shallow lakes[J]. Global Change Biology, 18(1): 118-126. doi: 10.1111/j.1365-2486.2011.02488.x
[24] Lao Q B, Liu G Q, Shen Y L, Su Q Z. 2021. Biogeochemical processes and eutrophication status of nutrients in the northern Beibu Gulf, South China[J]. Journal of Earth System Science, 130(4): 199. doi: 10.1007/s12040-021-01706-y
[25] Lei X T, Chen M, Guo L, Zhang X G, Jiang Z H, Chen Z G. 2019. Diurnal variations in the content and oxygen isotope composition of phosphate pools in a subtropical agriculture soil[J]. Geoderma, 337: 863-870. doi: 10.1016/j.geoderma.2018.10.039
[26] Li Y, Geng M D, Yu J L, Du Y X, Xu M, Zhang W Z, Wang J J, Su H J, Wang R, Chen F Z. 2022. Eutrophication decrease compositional dissimilarity in freshwater plankton communities[J]. Science of the Total Environment, 821: 153434. doi: 10.1016/j.scitotenv.2022.153434
[27] Malone T C, Newton A. 2020. The globalization of cultural eutrophication in the coastal ocean: causes and consequences[J]. Frontiers in Marine Science, 7: 670. doi: 10.3389/fmars.2020.00670
[28] Nguyen A T, Némery J, Gratiot N, Dao T S, Le T T M, Baduel C, Garnier, J. 2022. Does eutrophication enhance greenhouse gas emissions in urbanized tropical estuaries?[J]. Environmental Pollution, 303: 119105. doi: 10.1016/j.envpol.2022.119105
[29] Paerl H W, Hall N S, Calandrino E S. 2011. Controlling harmful cyanobacterial blooms in a world experiencing anthropogenic and climatic-induced change[J]. Science of the total environment, 409(10): 1739-1745. doi: 10.1016/j.scitotenv.2011.02.001
[30] Rabalais N N, Turner R E, Díaz R J, Justić D. 2009. Global change and eutrophication of coastal waters[J]. ICES Journal of Marine Science, 66(7): 1528-1537. doi: 10.1093/icesjms/fsp047
[31] Schindler D W, Heckey R E. 2009. Eutrophication: more nitrogen data needed[J]. Science, 324(5928): 721-722.
[32] Smith V H, Schindler D W. 2009. Eutrophication science: where do we go from here?[J]. Trends in ecology & evolution, 24(4): 201-207.
[33] Smith V H, Tilman G D, Nekola J C. 1999. Eutrophication: impacts of excess nutrient inputs on freshwater, marine, and terrestrial ecosystems[J]. Environmental Pollution, 100(1-3): 179-196. doi: 10.1016/S0269-7491(99)00091-3
[34] Sunda W G, Cai W J. 2012. Eutrophication induced CO2-acidification of subsurface coastal waters: interactive effects of temperature, salinity, and atmospheric pCO2[J]. Environmental science & technology, 46(19): 10651-10659.
[35] Wang B D, Xin M, Wei Q S, Xie L P. 2018. A historical overview of coastal eutrophication in the China Seas[J]. Marine Pollution Bulletin, 136: 394-400. doi: 10.1016/j.marpolbul.2018.09.044
[36] Wang M R, Kroeze C, Strokal M, van Vliet M T H, Ma L. 2020. Global change can make coastal eutrophication control in China more difficult[J]. Earth's Future, 8(4): e2019EF001280. doi: 10.1029/2019EF001280
[37] Wang Y J, Liu D Y, Xiao W P, Zhou P, Tian C G, Zhang C S, Du J Z, Guo H, Wang, B D. 2021. Coastal eutrophication in China: Trend, sources, and ecological effects[J]. Harmful Algae, 107: 102058. doi: 10.1016/j.hal.2021.102058
[38] Wei Y Q, Ding D S, Gu T, Xu Y, Sun X M, Qu K M, Sun J, Cui Z G. 2023. Ocean acidification and warming significantly affect coastal eutrophication and organic pollution: A case study in the Bohai Sea[J]. Marine Pollution Bulletin, 186: 114380. doi: 10.1016/j.marpolbul.2022.114380
[39] Xu H L, Zhang Y, Zhu X Z, Zheng M F. 2019. Effects of rainfall-runoff pollution on eutrophication in coastal zone: a case study in Shenzhen Bay, southern China[J]. Hydrology Research, 50(4): 1062-1075. doi: 10.2166/nh.2019.012
[40] Zang N, Zhu J, Wang X, Liao Y J, Cao G Z, Li C H, Liu Q, Yang Z F. 2022. Eutrophication risk assessment considering joint effects of water quality and water quantity for a receiving reservoir in the South-to-North Water Transfer Project, China[J]. Journal of Cleaner Production, 331: 129966. doi: 10.1016/j.jclepro.2021.129966
[41] Zhang P, Chen Y, Peng C H, Dai P D, Lai J Y, Zhao L R, Zhang J B. 2020. Spatiotemporal variation, composition of DIN and its contribution to eutrophication in coastal waters adjacent to Hainan Island, China[J]. Regional Studies in Marine Science, 37: 101332. doi: 10.1016/j.rsma.2020.101332
[42] Zhang Y F, Gao Y H, Kirchman D L, Cottrell M T, Chen R, Wang K, Ouyang Z X, Xu Y Y, Chen B S, Yin K D, Cai W J. 2019. Biological regulation of pH during intensive growth of phytoplankton in two eutrophic estuarine waters[J]. Marine ecology progress series, 609: 87-99. doi: 10.3354/meps12836
[43] Zhou Y, Wang L L, Zhou Y Y, Mao X Z. 2020. Eutrophication control strategies for highly anthropogenic influenced coastal waters[J]. Science of the Total Environment, 705: 135760. doi: 10.1016/j.scitotenv.2019.135760
-


图(9)
表(1)
计量
- 文章访问数: 64
- PDF下载数: 11
- 施引文献: 0